はじめに
OCI(Oracle Cloud Infrastructure)のサービスのメトリクス情報を参照したり、そこからアラームを発行したり、何かしらのアクションを自動化するときに中核となるサービスとして、Monitoring サービスというものがあります。

引用: https://docs.oracle.com/ja-jp/iaas/Content/Monitoring/Concepts/monitoringoverview.htm
これを使う以外にもツールへの習熟度やその他足りない機能(Error Tracking, Profiler, etc.)を補うために 3rd Party の監視系ツール(Datadog, Grafana, etc.)にこれらのメトリクス情報を統合したいという要件はよくあることだと思います。
そこで今回は、OCI Monitoring に集められる Raw Metrics Data を Datadog に連携する方法を紹介します。
※本ブログ記事は、Exporting OCI Monitoring Service Metrics to Datadog を参考とし、一部コードを修正したものとなっています。
連携の概要
以下のような構成で Raw Metrics Data の連携が可能となります。
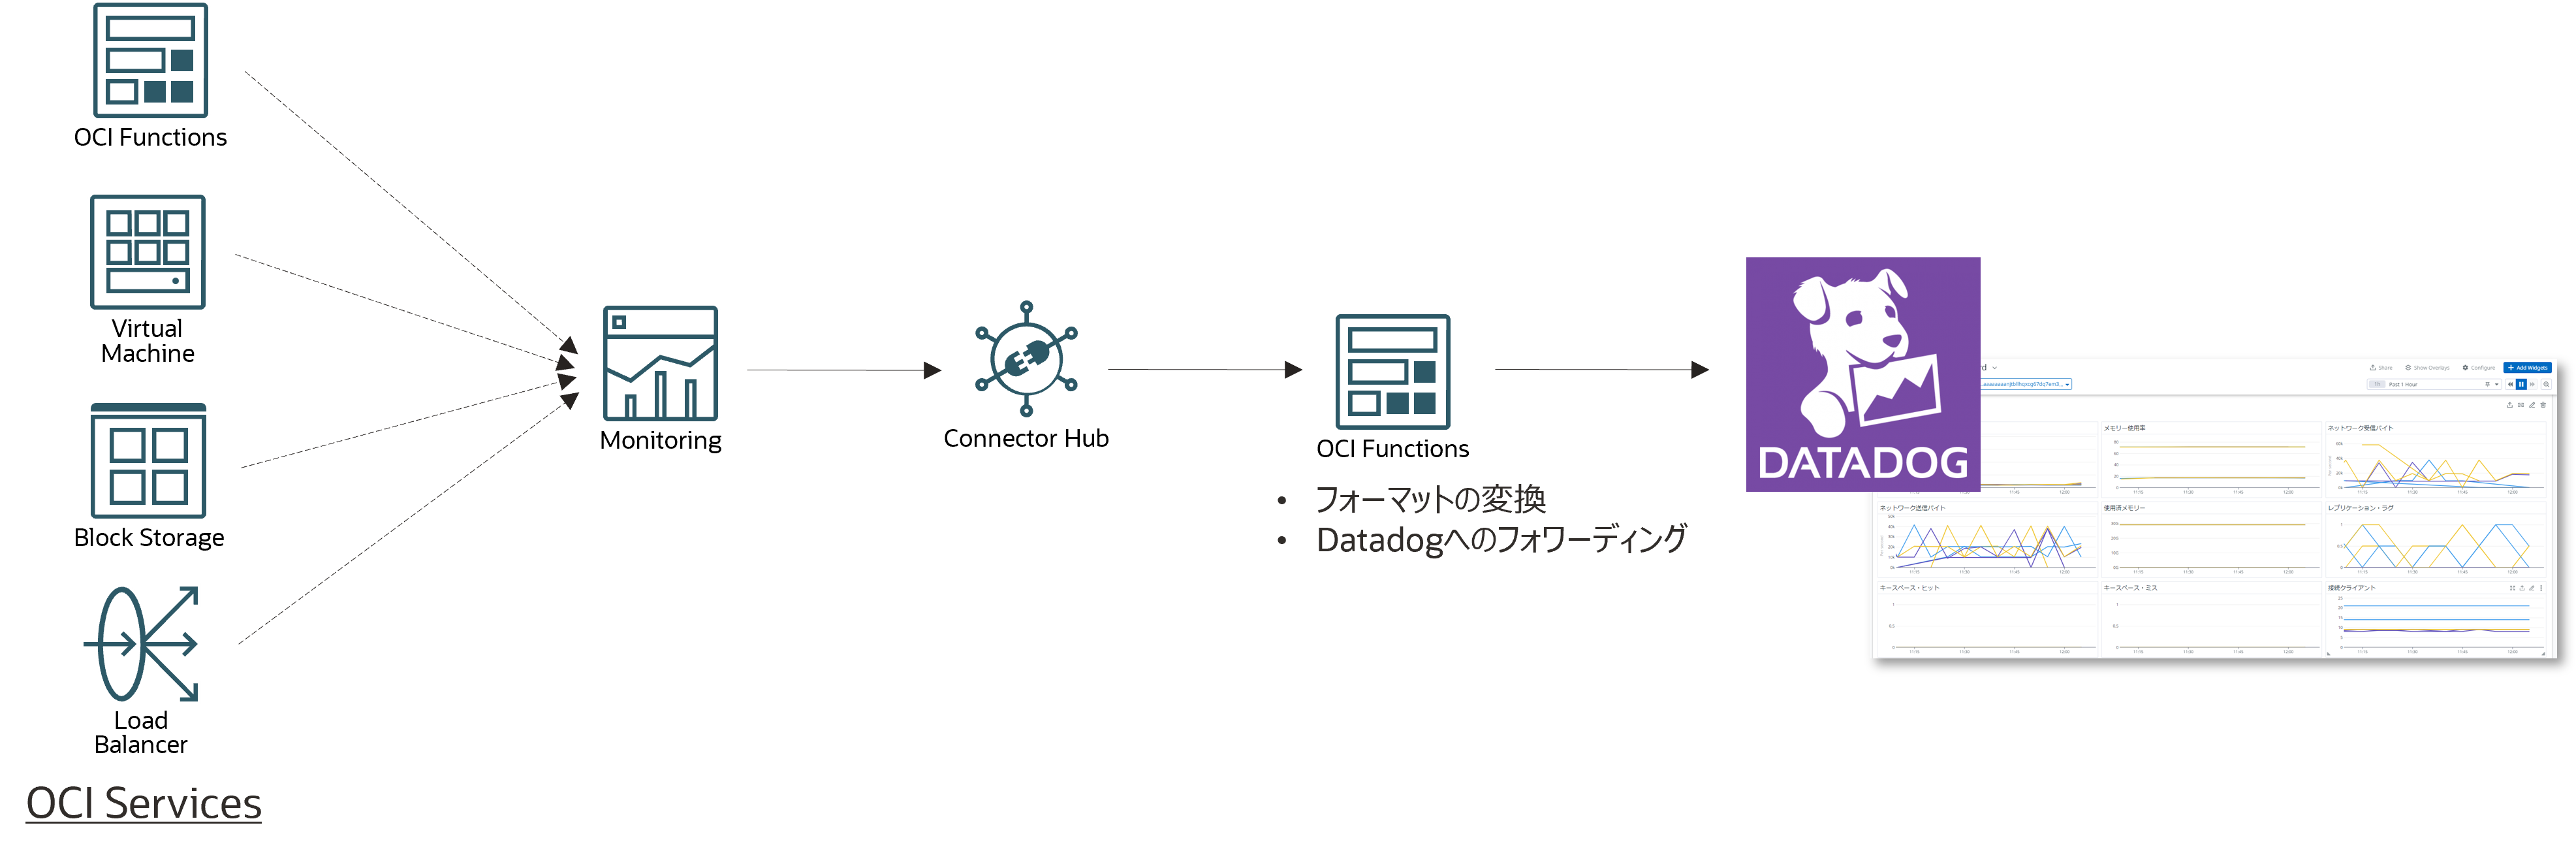
ざっくりとした流れは以下のようになります。
- OCI Monitoring 対応の各サービスから Metrics Data を収集する
- 収集された Metrics Data は Connector Hub によって OCI Functions に渡される
- OCI Functions では、OCI Monitoring の Metrics Format から Datadog の Metrics Format への変換を行い、Datadog のメトリクスエンドポイントに POST する
この際、知っておいた方が良いことがいくつかあるので、補足しておきます。
補足事項
Connector Hub に連携可能な Metric Namespace の上限は 50
1 Connector Hub に連携可能な Metric Namespace の上限は 50 個となっています。Metric Namespace というのは、OCI リソースの測定情報の論理単位(oci_computeagent や oci_faas など)のことで、雑に数えた感じだと 2023/10 現在では 60~70 の Metric Namespace がありそうでしたので全部連携しようと思うと、Connector Hub を複数用意する必要がありますね。Connector Hub を複数に分割しても Datadog へのフォワーディングを行う OCI Functions は 1 つデプロイしておけば十分なのであまり問題になることはないのかな?という印象です。
Connector Hub から OCI Functions の呼び出し
Raw Metrics Data が Connector Hub に入ってからすぐに OCI Functions が呼びだされるわけではなく、いくつかルールが存在します。
- Connector Hub は Raw Metrics Data を JSON のリストとしてバッチ処理でフラッシュします
- 最大のバッチサイズは、6MB ですが時間に関する記述はドキュメントにはありません
- OCI Functions は、1 回の呼び出しで 6MB のデータと同期するように呼び出されます。一時的にバッファーされている入力データが 6MB を超えると、Connector Hub が再度 Functions を呼び出して制限を超えるデータを移動させます。この時の呼び出しは、シーケンシャルに行われます
詳細は、モニタリング・ソースを使用したコネクタの作成をご参照ください。
OCI Functions は汎用的に使えるように実装するべし
各 Metric Namespace 毎に異なる Functions を実装するようではキリがないので汎用的に使える必要があるでしょう。
OCI の Metric Data Format は以下のようになっています。
参考: MetricDataDetails Reference
{
  "namespace": "my_namespace",
  "name": "my_app.success_rate",
  "compartmentId": "ocid1.compartment.oc1..exampleuniqueID",
  "resourceGroup": "my_ResourceGroup",
  "dimensions": {
    "resourceId": "ocid1.instance.region1.phx.exampleuniqueID",
    "availabilityDomain": "cumS:PHX-AD-1"
  },
  "metadata": { "unit": "percent" },
  "datapoints": [
    {
      "timestamp": "2023-03-10T22:19:20Z",
      "value": 83
    },
    {
      "timestamp": "2023-03-10T22:19:40Z",
      "value": 90
    },
    {
      "timestamp": "2023-03-10T22:20:00Z",
      "value": 85
    },
    {
      "timestamp": "2023-03-10T22:21:20Z",
      "value": 87
    },
    {
      "timestamp": "2023-03-10T22:21:40Z",
      "value": 81
    },
    {
      "timestamp": "2023-03-10T22:22:00Z",
      "value": 92
    }
  ]
}
namespace, name, compartmentId, resourceGroup 辺りはどのサービスでも共通で dimensions, metadata の中身が metric namespace 毎に変わるといった形でしょうか。
次に、Datadog の Metric Data Format は以下のようになっています。
参考: Datadog API リファレンス - メトリクス
{
  "series": [
    {
      "metric": "system.load.1",
      "type": 0,
      "points": [
        {
          "timestamp": 1636629071,
          "value": 1.1
        }
      ],
      "tags": ["test:ExampleSubmitmetricsreturnsPayloadacceptedresponse"]
    }
  ]
}
このことから、今回は OCI Functions で以下のようにフォーマット変換をすることにします。
{
  "series": [
    {
      "metric": "<namespace>_<name>",
      "type": "0",
      "points": [
        {
          "timestamp": "<datapoint.timestamp>",
          "value": "<datapoint.value>"
        }
      ],
      "tags": [
        "<namespace>:<namespace-value>",
        "<name>:<name-value>",
        "<compartmentId>:<compartmentId-value>",
        "<resourceGroup>:<resourceGroup-value>",
        "<create from dimensions>",
        "<create from metadata>"
      ]
    }
  ]
}
metric は、namespace, name を組み合わせて作成し、type は 0(unspecified) 固定、points は datapoint がそのまま使えそうで、tags は dimensions, metadata の扱いでちょっと工夫が必要そうです。
OCI Functions の実装
import io
import json
import logging
import os
import re
import requests
from fdk import response
from datetime import datetime

"""
This sample OCI Function maps OCI Monitoring Service Metrics to the DataDog
REST API 'submit-metrics' contract found here:

https://docs.datadoghq.com/api/latest/metrics/#submit-metrics
"""

# Use OCI Application or Function configurations to override these environment variable defaults.

api_endpoint = os.getenv('DATADOG_METRICS_API_ENDPOINT', 'not-configured')
api_key = os.getenv('DATADOG_API_KEY', 'not-configured')
is_forwarding = eval(os.getenv('FORWARD_TO_DATADOG', "True"))
metric_tag_set = set()

# Set all registered loggers to the configured log_level

logging_level = os.getenv('LOGGING_LEVEL', 'INFO')
loggers = [logging.getLogger()] + [logging.getLogger(name) for name in logging.root.manager.loggerDict]
[logger.setLevel(logging.getLevelName(logging_level)) for logger in loggers]

# Exception stack trace logging

is_tracing = eval(os.getenv('ENABLE_TRACING', "False"))

# Constants

TEN_MINUTES_SEC = 10 * 60
ONE_HOUR_SEC = 60 * 60

# Functions

def handler(ctx, data: io.BytesIO = None):
    """
    OCI Function Entry Point
    :param ctx: InvokeContext
    :param data: data payload
    :return: plain text response indicating success or error
    """

    preamble = " {} / event count = {} / logging level = {} / forwarding to DataDog = {}"

    try:
        metrics_list = json.loads(data.getvalue())
        logging.getLogger().info(preamble.format(ctx.FnName(), len(metrics_list), logging_level, is_forwarding))
        logging.getLogger().debug(metrics_list)
        converted_event_list = handle_metric_events(event_list=metrics_list)
        send_to_datadog(event_list=converted_event_list)

    except (Exception, ValueError) as ex:
        logging.getLogger().error('error handling logging payload: {}'.format(str(ex)))
        if is_tracing:
            logging.getLogger().error(ex)


def handle_metric_events(event_list):
    """
    :param event_list: the list of metric formatted log records.
    :return: the list of DataDog formatted log records
    """

    result_list = []
    for event in event_list:
        single_result = transform_metric_to_datadog_format(log_record=event)
        result_list.append(single_result)
        logging.getLogger().debug(single_result)

    return result_list


def transform_metric_to_datadog_format(log_record: dict):
    """
    Transform metrics to DataDog format.
    See: https://github.com/metrics/spec/blob/v1.0/json-format.md
    :param log_record: metric log record
    :return: DataDog formatted log record
    """

    series = [{
        'metric': get_metric_name(log_record),
        'type' : get_metric_type(log_record),
        'points' : get_metric_points(log_record),
        'tags' : get_metric_tags(log_record),
    }]

    result = {
        'series' : series
    }
    return result


def get_metric_name(log_record: dict):
    """
    Assembles a metric name that appears to follow DataDog conventions.
    :param log_record:
    :return:
    """

    elements = get_dictionary_value(log_record, 'namespace').split('_')
    elements += camel_case_split(get_dictionary_value(log_record, 'name'))
    elements = [element.lower() for element in elements]
    return '.'.join(elements)


def camel_case_split(str):
    """
    :param str:
    :return: Splits camel case string to individual strings
    """

    return re.findall(r'[A-Z](?:[a-z]+|[A-Z]*(?=[A-Z]|$))', str)


def get_metric_type(log_record: dict):
    """
    :param log_record:
    :return: The type of metric. The available types are 0 (unspecified), 1 (count), 2 (rate), and 3 (gauge).
    Allowed enum values: 0,1,2,3
    """

    return 0


def get_now_timestamp():
    return datetime.now().timestamp()


def adjust_metric_timestamp(timestamp_ms):
    """
    DataDog Timestamps should be in POSIX time in seconds, and cannot be more than ten
    minutes in the future or more than one hour in the past.  OCI Timestamps are POSIX
    in milliseconds, therefore a conversion is required.

    See https://docs.datadoghq.com/api/latest/metrics/#submit-metrics
    :param oci_timestamp:
    :return:
    """

    # positive skew is expected
    timestamp_sec = int(timestamp_ms / 1000)
    delta_sec = get_now_timestamp() - timestamp_sec

    if (delta_sec > 0 and delta_sec > ONE_HOUR_SEC):
        logging.getLogger().warning('timestamp {} too far in the past per DataDog'.format(timestamp_ms))

    if (delta_sec < 0 and abs(delta_sec) > TEN_MINUTES_SEC):
        logging.getLogger().warning('timestamp {} too far in the future per DataDog'.format(timestamp_ms))

    return timestamp_sec


def get_metric_points(log_record: dict):
    """
    :param log_record:
    :return: an array of arrays where each array is a datapoint scalar pair
    """

    result = []

    datapoints = get_dictionary_value(dictionary=log_record, target_key='datapoints')
    for point in datapoints:
        dd_point = {'timestamp': adjust_metric_timestamp(point.get('timestamp')),
                    'value': point.get('value')}

        result.append(dd_point)

    return result


def get_metric_tags(log_record: dict):
    """
    Assembles tags from selected metric attributes.
    See https://docs.datadoghq.com/getting_started/tagging/
    :param log_record: the log record to scan
    :return: string of comma-separated, key:value pairs matching DataDog tag format
    """

    result = []

    for tag in get_metric_tag_set(log_record):
        value = get_dictionary_value(dictionary=log_record, target_key=tag)
        logging.getLogger().debug("value: {}".format(value))
        if value is None:
            continue

        if isinstance(value, str) and ':' in value:
            logging.getLogger().warning('tag contains a \':\' / ignoring {}'.format(value))
            value = value.replace(':', '_')

        tag = '{}:{}'.format(tag, value)
        result.append(tag)

    return result


def get_metric_tag_set(log_record: dict):
    """
    :return: the set metric payload keys from input metrics(oci).
    """

    target_keys = ["dimensions", "metadata"]
    metric_tag_set = ["namespace", "compartmentId", "name", "resourceGroup"]

    for key in target_keys:
        if key in log_record:
            metric_tag_set.extend(list(log_record.get(key).keys()))

    logging.getLogger().debug("tag ket set / {}".format(metric_tag_set))

    return metric_tag_set


def send_to_datadog (event_list):
    """
    Sends each transformed event to DataDog Endpoint.
    :param event_list: list of events in DataDog format
    :return: None
    """

    if is_forwarding is False:
        logging.getLogger().debug("DataDog forwarding is disabled - nothing sent")
        return

    if 'v2' not in api_endpoint:
        raise RuntimeError('Requires API endpoint version "v2": "{}"'.format(api_endpoint))

    # creating a session and adapter to avoid recreating
    # a new connection pool between each POST call

    try:
        session = requests.Session()
        adapter = requests.adapters.HTTPAdapter(pool_connections=10, pool_maxsize=10)
        session.mount('https://', adapter)

        for event in event_list:
            api_headers = {'Content-type': 'application/json', 'DD-API-KEY': api_key}
            logging.getLogger().debug("json to datadog: {}".format (json.dumps(event)))
            response = session.post(api_endpoint, data=json.dumps(event), headers=api_headers)

            if response.status_code != 202:
                raise Exception ('error {} sending to DataDog: {}'.format(response.status_code, response.reason))

    finally:
        session.close()


def get_dictionary_value(dictionary: dict, target_key: str):
    """
    Recursive method to find value within a dictionary which may also have nested lists / dictionaries.
    :param dictionary: the dictionary to scan
    :param target_key: the key we are looking for
    :return: If a target_key exists multiple times in the dictionary, the first one found will be returned.
    """

    if dictionary is None:
        raise Exception('dictionary None for key'.format(target_key))

    target_value = dictionary.get(target_key)
    if target_value:
        return target_value

    for key, value in dictionary.items():
        if isinstance(value, dict):
            target_value = get_dictionary_value(dictionary=value, target_key=target_key)
            if target_value:
                return target_value

        elif isinstance(value, list):
            for entry in value:
                if isinstance(entry, dict):
                    target_value = get_dictionary_value(dictionary=entry, target_key=target_key)
                    if target_value:
                        return target_value


def local_test_mode(filename):
    """
    This routine reads a local json metrics file, converting the contents to DataDog format.
    :param filename: cloud events json file exported from OCI Logging UI or CLI.
    :return: None
    """

    logging.getLogger().info("local testing started")

    with open(filename, 'r') as f:
        transformed_results = list()

        for line in f:
            event = json.loads(line)
            logging.getLogger().debug(json.dumps(event, indent=4))
            transformed_result = transform_metric_to_datadog_format(event)
            transformed_results.append(transformed_result)

        logging.getLogger().debug(json.dumps(transformed_results, indent=4))
        send_to_datadog(event_list=transformed_results)

    logging.getLogger().info("local testing completed")


"""
Local Debugging mode
"""

if __name__ == "__main__":
    filename = os.getenv('FILENAME', 'oci-metrics-test-file.json')
    local_test_mode(filename)
処理の流れをざっくりと説明します。
まず、以下の関数が Functions のエントリーポイントとなります。Connector Hub からは JSON リストでメトリクスデータが入力されるので、入力データ全体を handle_metric_events に渡します。
def handler(ctx, data: io.BytesIO = None):
    """
    OCI Function Entry Point
    :param ctx: InvokeContext
    :param data: data payload
    :return: plain text response indicating success or error
    """

    preamble = " {} / event count = {} / logging level = {} / forwarding to DataDog = {}"

    try:
        metrics_list = json.loads(data.getvalue())
        logging.getLogger().info(preamble.format(ctx.FnName(), len(metrics_list), logging_level, is_forwarding))
        logging.getLogger().debug(metrics_list)
        converted_event_list = handle_metric_events(event_list=metrics_list)
        send_to_datadog(event_list=converted_event_list)

    except (Exception, ValueError) as ex:
        logging.getLogger().error('error handling logging payload: {}'.format(str(ex)))
        if is_tracing:
            logging.getLogger().error(ex)
handle_metric_events では、入力データに対して 1 件づつ OCI Metrics Data Format → Datadog Metrics Data Format への変換(transform_metric_to_datadog_format)を行います。
def handle_metric_events(event_list):
    """
    :param event_list: the list of metric formatted log records.
    :return: the list of DataDog formatted log records
    """

    result_list = []
    for event in event_list:
        single_result = transform_metric_to_datadog_format(log_record=event)
        result_list.append(single_result)
        logging.getLogger().debug(single_result)

    return result_list
transform_metric_to_datadog_format では、前述の変換処理を行います。metrics, type, points は単純なのですが、tags は少し工夫が必要です。
def transform_metric_to_datadog_format(log_record: dict):
    """
    Transform metrics to DataDog format.
    See: https://github.com/metrics/spec/blob/v1.0/json-format.md
    :param log_record: metric log record
    :return: DataDog formatted log record
    """

    series = [{
        'metric': get_metric_name(log_record),
        'type' : get_metric_type(log_record),
        'points' : get_metric_points(log_record),
        'tags' : get_metric_tags(log_record),
    }]

    result = {
        'series' : series
    }
    return result
get_metric_tags は、以下のように実装してみました。どの metric namespace でも持っている namespace, compartmentId, name, resourceGroup は、Datadog - Tag に変換し、dimensions, metadata については Key の一覧から Tag に変換するようにしています。これによって、OCI Monitoring 対応の全てのサービスに対して、統一的に対応ができるようになります。
def get_metric_tags(log_record: dict):
    """
    Assembles tags from selected metric attributes.
    See https://docs.datadoghq.com/getting_started/tagging/
    :param log_record: the log record to scan
    :return: string of comma-separated, key:value pairs matching DataDog tag format
    """

    result = []

    for tag in get_metric_tag_set(log_record):
        value = get_dictionary_value(dictionary=log_record, target_key=tag)
        logging.getLogger().debug("value: {}".format(value))
        if value is None:
            continue

        if isinstance(value, str) and ':' in value:
            logging.getLogger().warning('tag contains a \':\' / ignoring {}'.format(value))
            value = value.replace(':', '_')

        tag = '{}:{}'.format(tag, value)
        result.append(tag)

    return result

def get_metric_tag_set(log_record: dict):
    """
    :return: the set metric payload keys from input metrics(oci).
    """

    target_keys = ["dimensions", "metadata"]
    metric_tag_set = ["namespace", "compartmentId", "name", "resourceGroup"]

    for key in target_keys:
        if key in log_record:
            metric_tag_set.extend(list(log_record.get(key).keys()))

    logging.getLogger().debug("tag ket set / {}".format(metric_tag_set))

    return metric_tag_set
Connector Hub の設定
OCI CLI で Source: Monitoring, Target: Functions の Connector Hub を作ります。もちろん、OCI Console で同じように作って頂いても OK です。
以下のパラメータファイルの、<your-compartment-id>, <function-id> をご自身の環境に合わせて置換してください。source.monitoringSources[*].namespaceDetails.namespaces[*] は、私の環境で使っているサービスの metric namespace をすべて連携させるような設定となっていますので、ここも必要に応じて修正してください。
{
  "compartmentId": "<your-compartment-id>",
  "description": "Metrics Data Forwarder",
  "displayName": "monitoring-to-datadog",
  "maxWaitSeconds": 0,
  "source": {
    "kind": "monitoring",
    "monitoringSources": [
      {
        "compartmentId": "<your-compartment-id>",
        "namespaceDetails": {
          "kind": "selected",
          "namespaces": [
            {
              "metrics": {
                "kind": "all"
              },
              "namespace": "oci_analytics"
            },
            {
              "metrics": {
                "kind": "all"
              },
              "namespace": "oci_apigateway"
            },
            {
              "metrics": {
                "kind": "all"
              },
              "namespace": "oci_autonomous_database"
            },
            {
              "metrics": {
                "kind": "all"
              },
              "namespace": "oci_blockstore"
            },
            {
              "metrics": {
                "kind": "all"
              },
              "namespace": "oci_compute"
            },
            {
              "metrics": {
                "kind": "all"
              },
              "namespace": "oci_compute_infrastructure_health"
            },
            {
              "metrics": {
                "kind": "all"
              },
              "namespace": "oci_compute_instance_health"
            },
            {
              "metrics": {
                "kind": "all"
              },
              "namespace": "oci_computeagent"
            },
            {
              "metrics": {
                "kind": "all"
              },
              "namespace": "oci_datalabeling"
            },
            {
              "metrics": {
                "kind": "all"
              },
              "namespace": "oci_datascience"
            },
            {
              "metrics": {
                "kind": "all"
              },
              "namespace": "oci_devops_build"
            },
            {
              "metrics": {
                "kind": "all"
              },
              "namespace": "oci_devops_deployment"
            },
            {
              "metrics": {
                "kind": "all"
              },
              "namespace": "oci_faas"
            },
            {
              "metrics": {
                "kind": "all"
              },
              "namespace": "oci_internet_gateway"
            },
            {
              "metrics": {
                "kind": "all"
              },
              "namespace": "oci_logging"
            },
            {
              "metrics": {
                "kind": "all"
              },
              "namespace": "oci_mysql_database"
            },
            {
              "metrics": {
                "kind": "all"
              },
              "namespace": "oci_nosql"
            },
            {
              "metrics": {
                "kind": "all"
              },
              "namespace": "oci_objectstorage"
            },
            {
              "metrics": {
                "kind": "all"
              },
              "namespace": "oci_opensearch"
            },
            {
              "metrics": {
                "kind": "all"
              },
              "namespace": "oci_secrets"
            },
            {
              "metrics": {
                "kind": "all"
              },
              "namespace": "oci_streaming"
            },
            {
              "metrics": {
                "kind": "all"
              },
              "namespace": "oci_vcn"
            }
          ]
        }
      }
    ]
  },
  "target": {
    "functionId": "<function-id>",
    "kind": "functions"
  },
  "waitForState": [
    "SUCCEEDED"
  ],
  "waitIntervalSeconds": 0
}
Connector Hub を作成します。
oci sch service-connector create --from-json file://create-sch.json
Datadog での確認
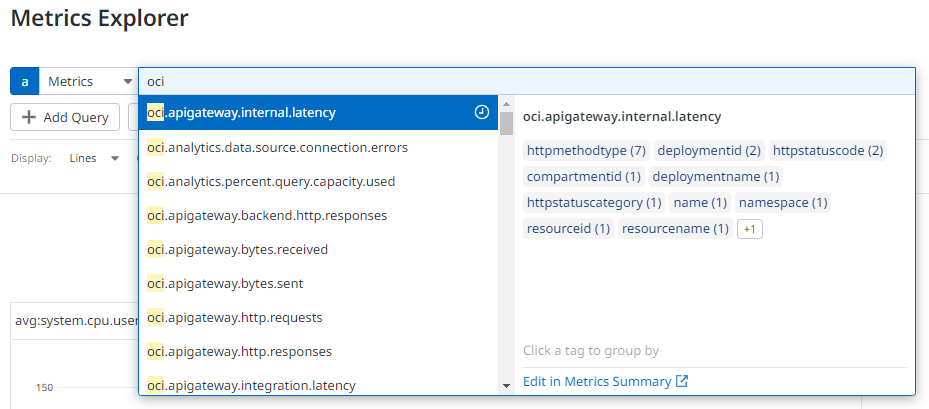
Metrics Explorer を確認し、OCI の Metrics 情報が連携されていれば成功です。
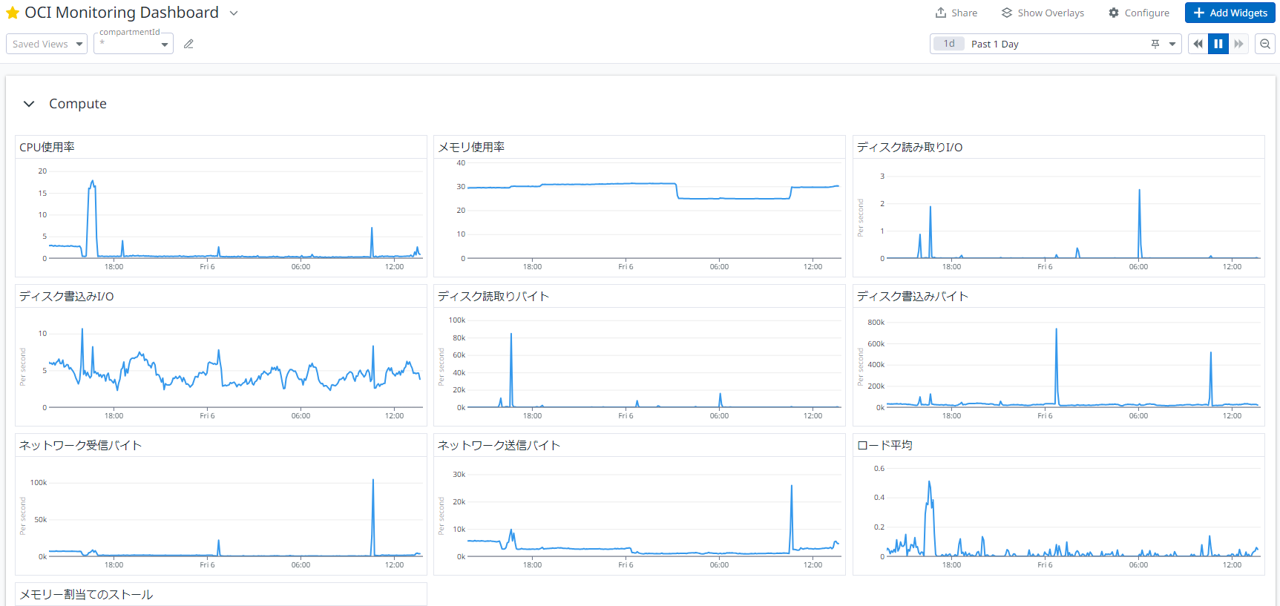
後は、監視設定をいれたりダッシュボードを作成したりお好きにどうぞ。
それでは、良い Observability ライフを!
おわりに
Functions の細かい使い方(Config の設定やローカルでのデバッグ実行、等)やコードの詳細は以下リポジトリをご覧ください。
参考情報