4
5

Delete article

Deleted articles cannot be recovered.

Draft of this article would be also deleted.

Are you sure you want to delete this article?

More than 3 years have passed since last update.

kabuステーション®API - PUSH APIのティックデータからローソク足データを作成する

Last updated at Posted at 2020-12-21

概要

 前回、ロガーの作成とティックデータの表示を行ったが、保存したティックデータから取引等で一般的なローソク足を作成する。なお、主なコードは前回コード部2項を流用する。

環境

  • Ubuntu 20.04.1 LTS
  • Python 3.8.5

追加パッケージ

  • mplfinance

コード

前回からの追加・変更部分

冒頭

import mplfinance as mpf

from datetime import datetime, timedelta, timezone

JST = timezone(timedelta(hours=+9), 'JST')

末尾

# 1分足の生成
candle_df = tick_df['price'].resample('1Min').ohlc()

start = datetime(2020, 11, 26, 9, tzinfo=JST)
end = datetime(2020, 11, 26, 10, tzinfo=JST)

# mpf.plot用タイムゾーン処理
candle_df_slice = candle_df[start:end].tz_localize(None)

# 画像ファイルの書き出し
mpf.plot(candle_df_slice,
    type='candle', figratio=(12,4), style='yahoo', savefig='candle.png')

# CSVデータの書き出し
candle_df[start:end].to_csv('1Min-ohlc.csv')

保存されたグラフ

201126-8306-candle.png
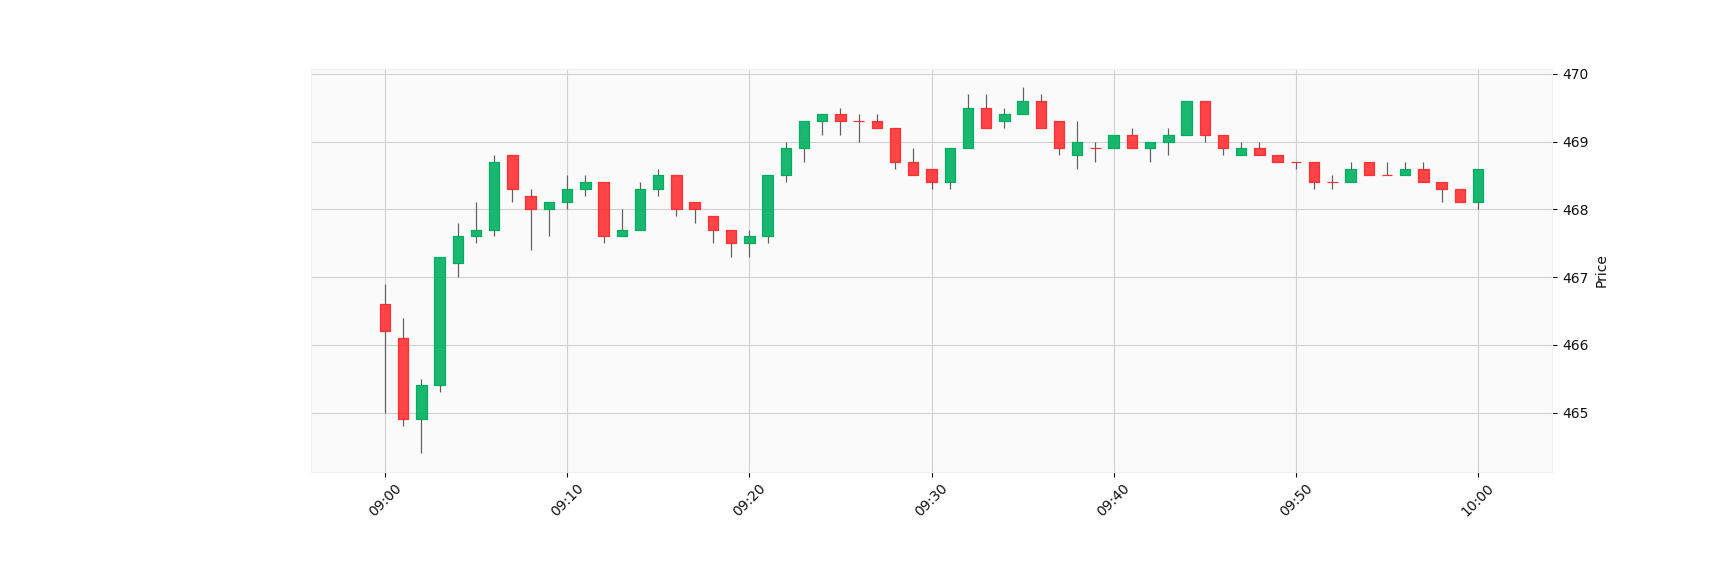
201126-8306-candle.png

参考リンク

関連記事

4
5
0

Register as a new user and use Qiita more conveniently

  1. You get articles that match your needs
  2. You can efficiently read back useful information
  3. You can use dark theme
What you can do with signing up
4
5

Delete article

Deleted articles cannot be recovered.

Draft of this article would be also deleted.

Are you sure you want to delete this article?