概要
自作ライブラリの python-kabusapi を利用し、PUSH配信される株価情報を取得・保存する。また、保存したのち、データを読み込みグラフデータを保存する。
環境
- Ubuntu 20.04.1 LTS
- Python 3.8.5
追加パッケージ
- pandas
- matplotlib
- pyyaml ( 認証情報保存用 )
- tqdm ( 進捗確認用 )
コード
0. 準備
YAMLファイルを準備する。
auth.yaml
host: localhost
port: 18080
pass: hogehoge
1. ロガー
PUSH配信されたデータが./pkl/201126/8306/[unixtime] のような形で保存される。
logger.py
import kabusapi

import yaml
import os
import pickle
from datetime import datetime, timedelta, timezone

with open('auth.yaml', 'r') as yml:
    auth = yaml.safe_load(yml)
    url = auth['host']
    port = auth['port']
    password = auth['pass']

api = kabusapi.Context(url, port, password)

pkl_path = 'pkl'

JST = timezone(timedelta(hours=+9), 'JST')
now = datetime.now(JST)
date = "{}{:02}{:02}".format(
    str(now.year)[2:4], now.month, now.day,
)

@api.websocket
def recieve(msg):
    symbol = msg['Symbol']
    path = pkl_path + '/' + date + '/' + symbol
    ts = str(datetime.now().timestamp())

    if not os.path.exists(path):
        os.makedirs(path)
    with open(path + '/' + ts, 'wb') as f:
        pickle.dump(msg, f)

    print(symbol, msg['SymbolName'],
            msg['CurrentPrice'], msg['TradingVolumeTime'])

def symbols_register(api, symbols):
    symbol_list = []
    for symbol in symbols:  # 東証に登録
        symbol_list += [ {'Symbol': symbol, "Exchange": 1, }, ]
    data = { "Symbols":  symbol_list  }
    return api.register(**data)

def main():
    # TOPIX Core 30 @ 201102
    symbols = [
        3382, 4063, 4452, 4502, 4503,
        4568, 6098, 6367, 6501, 6594,
        6758, 6861, 6954, 6981, 7203,
        7267, 7741, 7974, 8001, 8031,
        8058, 8306, 8316, 8411, 8766,
        9022, 9432, 9433, 9437, 9984,
    ]

    api.unregister.all()
    response = symbols_register(api, symbols)
    print(response)

    try:
        api.websocket.run()
    except KeyboardInterrupt:
        exit()

if __name__ == '__main__':
    main()
2. 読み込み・表示
tqdmは進捗確認のため(ハングアップか読込中かを見て判断するため)。
import pandas as pd
import matplotlib.pyplot as plt
from tqdm import tqdm

from datetime import datetime
import pickle
import os

os.chdir('./pkl/201126/8306')

filelist = sorted([float(s) for s in os.listdir()])

tick_list = []
for pkl in tqdm(filelist):
    with open(str(pkl), 'rb') as f:
        tick_list += [ pickle.load(f) ]

bid_list = []
bid_time_list = []

for tick in tqdm(tick_list):
    if not tick['BidTime']:
        continue

    bid = tick['BidPrice']
    bid_time = datetime.fromisoformat(tick['BidTime'])

    bid_list += [bid]
    bid_time_list += [bid_time]

# pandas DataFrame に Series ずつ append すると激遅なのでリストから変換する(重要)
tick_df = pd.DataFrame({
    'datetime': bid_time_list,
    'price': bid_list,}).set_index('datetime')

tick_df.plot()
os.chdir(os.environ['HOME']) #ホームディレクトリにグラフを保存
plt.savefig('201126-8306.png')
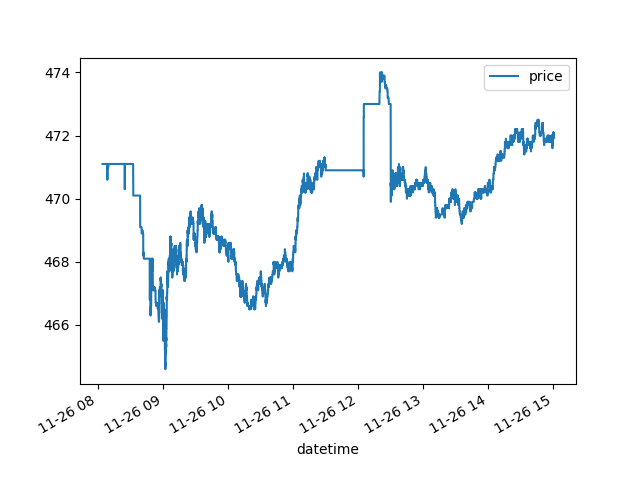
保存されたグラフ
201126-8306.png
他
pkl ごと保存するとそれなりに膨大な量のデータになるが、のちのち機械学習等への利用を考えると致し方あるまい。
(上記グラフ分のpklで250MB弱)