製造業で得られるデータは、ほとんどにラベル付けがされていません。
従って、ラベル付けが必要のない異常検知は、製造業からのニーズが
非常に高いと思われます。
そんな中、先日行われた人工知能学会で、興味深い論文が発表されました。↓
・深層生成モデルによる非正則化異常度を用いた工業製品の異常検知
https://confit.atlas.jp/guide/event-img/jsai2018/2A1-03/public/pdf?type=in
内容は、ねじ山のような複雑な工業製品の画像をターゲットにして、
高性能な異常検知器を提案しています。
さっそく、kerasで実装してみます。
従来のVAEを使った手法に対し、どれくらい優位性があるのか楽しみです。
理論的な内容
お急ぎの方は、結果の画像だけ見ていただければ分かると思います。
基本となる技術は、VAE(Variational Autoencoder)です。
VAEについて、詳しく知りたい方は、素晴らしい記事がありますので、
こちら↓を参考にして下さい。
・Variational Autoencoder徹底解説
https://qiita.com/kenmatsu4/items/b029d697e9995d93aa24
通常のVAEは以下の損失関数を使っています。
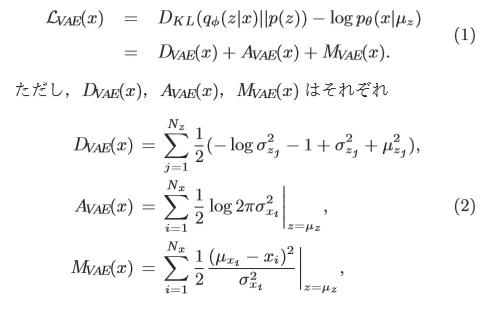
論文より引用
(A_VAE+M_VAEは、「binary crossentropy」を使っているのも多くあります。)
異常検知をする際は、この損失関数L_VAEを使って判別します。
これが高いと「異常」、低いと「正常」と見なします。
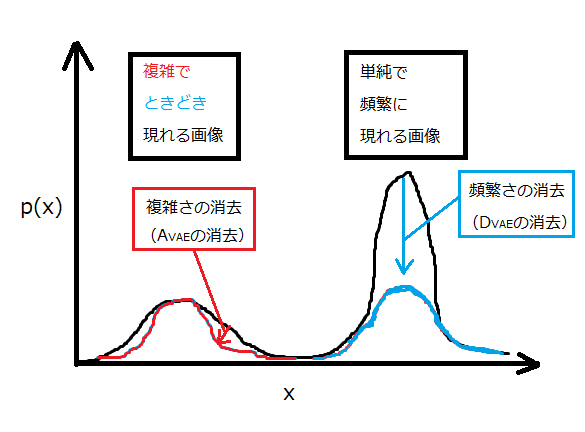
ところが、工業製品などの複雑な画像の一部を切り取って
異常検知をさせようと思うと、以下のように頻繁に出る画像と
たまにしか出ない画像で、損失関数(確率)の分布が異なってきます。
つまり、画像の頻繁さにより異常とみなす閾値が変わってくるということです。
そこで、論文では、頻繁さの影響を受けづらい関数に着目し、
これを使って異常検知することを提案しています。
さらに、これは、画像の複雑さにも堅牢な関数となっています。
前述したように、従来のVAEの損失関数は以下で示されます。
L_{VAE} = D_{VAE} + A_{VAE} + M_{VAE}
そして、L_VAEからD_VAEとA_VAEを消去することにより
「頻繁さ」と「複雑さ」を消去することができます。
L_{VAE} = M_{VAE}
残ったM_VAEで評価すると、図中の青い線と赤い線は、同じ土俵で比較することが
できます。つまり、同じ閾値で異常判定ができるということです。
コードの解説
コードは以下をベースにしています。
https://github.com/keras-team/keras/blob/master/examples/variational_autoencoder_deconv.py
以下、本稿のコードの一部を解説します。(全コードは一番下に示してあります。)
画像の切り出し
基の画像から、一部を切り取って学習データを作っています。
本稿では、28×28サイズから8×8サイズを切り取り、10万枚を
学習データとして用意しました。
# 8×8のサイズに切り出す
def cut_img(x, number, height=8, width=8):
    print("cutting images ...")
    x_out = []
    x_shape = x.shape

    for i in range(number):
        shape_0 = np.random.randint(0,x_shape[0])
        shape_1 = np.random.randint(0,x_shape[1]-height)
        shape_2 = np.random.randint(0,x_shape[2]-width)
        temp = x[shape_0, shape_1:shape_1+height, shape_2:shape_2+width, 0]
        x_out.append(temp.reshape((height, width, x_shape[3])))

    print("Complete.")
    x_out = np.array(x_out)

    return x_out
for文を使っていますが、Colaboratoryだと2秒もかからずに処理が終わります。
ヒートマップの作成
異常箇所を可視化するヒートマップは、元の28×28サイズの画像に
8×8サイズの小窓を2ピクセルずつ上下左右に走らせて、累積させていきます。
必然的に、隅っこより中央部の方が異常度が高くなるかと思いきや、ちゃんと隅っこでも
異常度が高くなるので、安心してください。
関数には、正常画像と異常画像を渡して、同じ基準で可視化させています。
nameの名前で、従来手法と提案手法を切り替えて評価しています。
# ヒートマップの計算
def evaluate_img(model, x_normal, x_anomaly, name, height=8, width=8, move=2):
    img_normal = np.zeros((x_normal.shape))
    img_anomaly = np.zeros((x_normal.shape))

    for i in range(int((x_normal.shape[1]-height)/move)):
        for j in range(int((x_normal.shape[2]-width)/move)):
            x_sub_normal = x_normal[0, i*move:i*move+height, j*move:j*move+width, 0]
            x_sub_anomaly = x_anomaly[0, i*move:i*move+height, j*move:j*move+width, 0]
            x_sub_normal = x_sub_normal.reshape(1, height, width, 1)
            x_sub_anomaly = x_sub_anomaly.reshape(1, height, width, 1)

            #従来手法
            if name == "old_":
                #正常のスコア
                normal_score = model.evaluate(x_sub_normal, batch_size=1, verbose=0)
                img_normal[0, i*move:i*move+height, j*move:j*move+width, 0] +=  normal_score

                #異常のスコア
                anomaly_score = model.evaluate(x_sub_anomaly, batch_size=1, verbose=0)
                img_anomaly[0, i*move:i*move+height, j*move:j*move+width, 0] +=  anomaly_score

            #提案手法
            else:
                #正常のスコア
                mu, sigma = vae.predict(x_sub_normal, batch_size=1, verbose=0)
                loss = 0
                for k in range(height):
                    for l in range(width):
                        loss += 0.5 * (x_sub_normal[0,k,l,0] - mu[0,k,l,0])**2 / sigma[0,k,l,0]
                img_normal[0, i*move:i*move+height, j*move:j*move+width, 0] +=  loss

                #正常のスコア
                mu, sigma = vae.predict(x_sub_anomaly, batch_size=1, verbose=0)
                loss = 0
                for k in range(height):
                    for l in range(width):
                        loss += 0.5 * (x_sub_anomaly[0,k,l,0] - mu[0,k,l,0])**2 / sigma[0,k,l,0]
                img_anomaly[0, i*move:i*move+height, j*move:j*move+width, 0] +=  loss

    save_img(x_normal, x_anomaly, img_normal, img_anomaly, name)
MNISTを使った結果
MNISTは皆さんご存知のとおり、手書きの数字を描画したものです。
学習データとテストデータは以下のように準備しました。
・学習データ:「1」
・テストデータ(正常):「1」
・テストデータ(異常):「9」
以下、学習後のVAEにテストデータを評価させます。
「9」の曲線部が、異常と認識されるのか注目です。
サンプル1
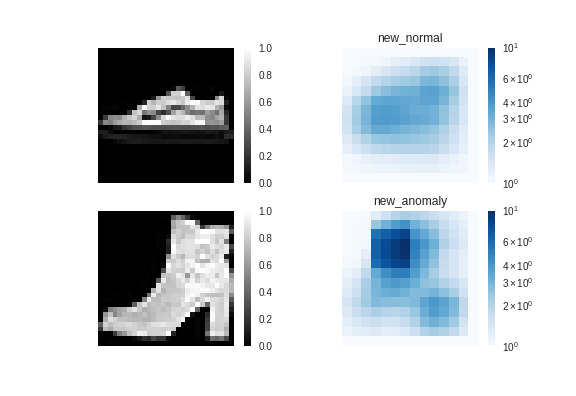
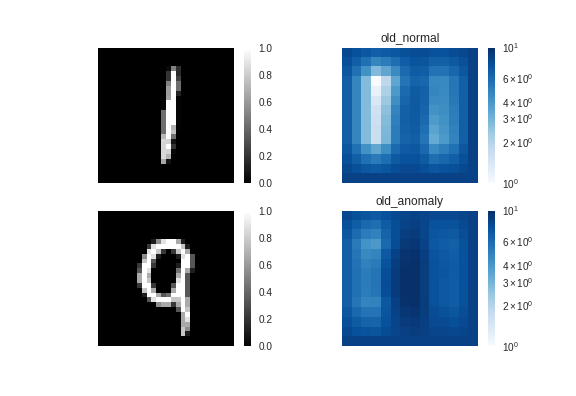
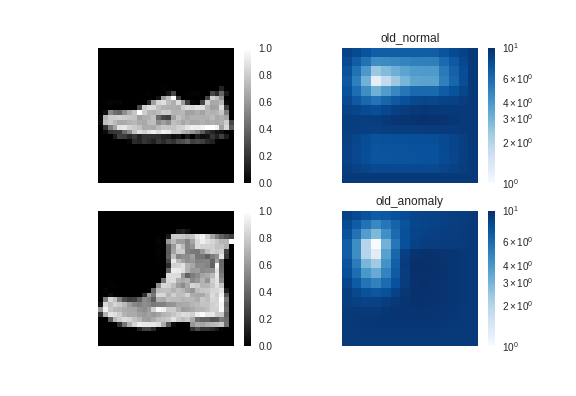
図の見方は、左がテストに使った画像、右がその異常度を示したヒートマップです。
ヒートマップで色が濃い部分が、異常と認識されています。異常度は1~10に正規化されており
対数で色付けしています。
従来手法では、何となく「9」のヒートマップ(図の右下)が濃いように
見えますが、「1」(図の右上)との差は僅かです。
つまり、異常検知はできていないようです。
提案手法↓
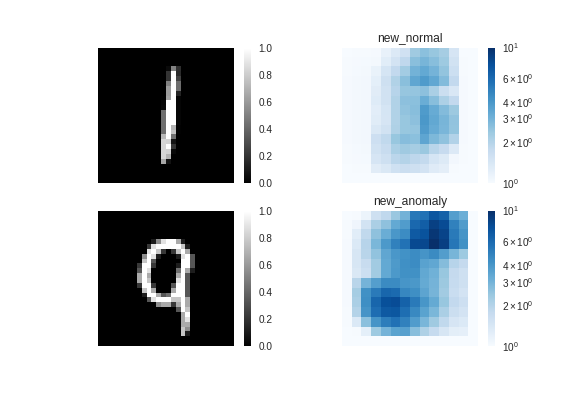
一方、提案手法では「9」の曲線部の異常度が高くなっており、
ちゃんと異常検知できています。
サンプル2
従来手法↓

サンプル2でも、従来手法ではうまく検知できていないようです。
提案手法↓
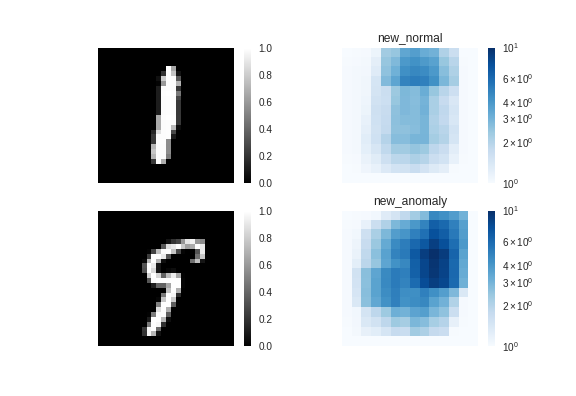
提案手法では、9の途切れた部分を「異常」と認識しています。
確かに、「1」という文字には途切れた部分がないため、途切れた部分を
「異常」と認識するのは納得です。
Fashion-MNISTを使った結果
Fashion-MNISTは、靴や洋服の画像をグレースケールで描画したものです。
kerasでは、簡単に読み込むことができます。↓
https://keras.io/ja/datasets/#fashion-mnist
画像サイズがMNISTと同一で、切り替えが1秒でできてしまいます。
これは便利!
学習データとテストデータは以下のように準備しました。
・学習データ:ス二ーカー
・テストデータ(正常):ス二ーカー
・テストデータ(異常):ブーツ
ブーツの「かかと」部分が、異常と認識されるのか注目です。
サンプル1
従来手法↓
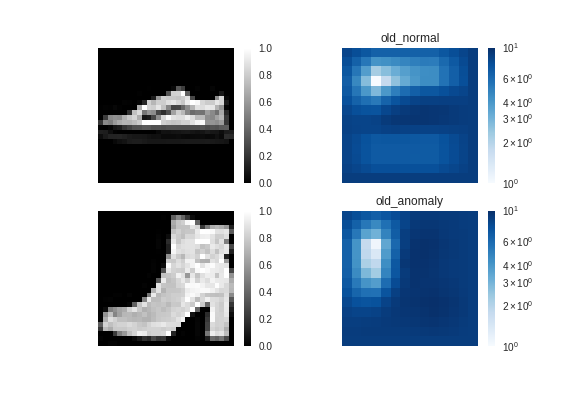
ス二ーカー(正常)とブーツ(異常)で大きな差はなく、
異常検知に失敗しているようです。
提案手法↓
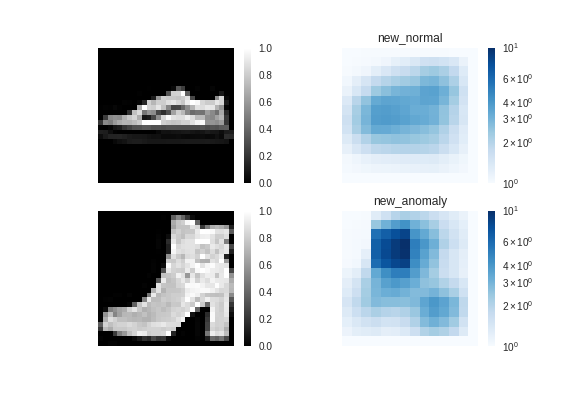
ブーツはちゃんと「異常」と認識されているようです。
予想に反して、ブーツの「かかと」ではなく、口の垂直部分が
「異常」と認識されているようです。言われてみると、スニーカーには
垂直になった部分はありませんもんねー。これは凄い!
サンプル2
提案手法↓
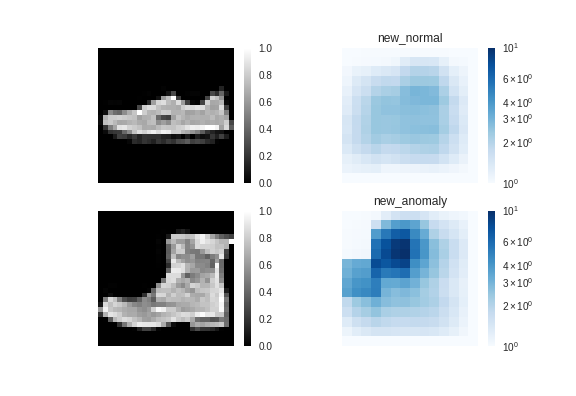
提案手法では、ちゃんと「異常」と認識されています。
まとめ
以前に、Autoencoderで異常検知を試みたことがありますが、あまり使えない
というのが正直な感想でした。やはり、ディープラーニングの実力はそんな
ものじゃなかったですね。
本技術を使えば、画像だけでなく、色々なデータで異常検知できそうです。
後編では、ROC曲線を使って、従来手法と提案手法を比較します。
2018/1/8追記
本手法より精度が良い論文の記事を書きました。
https://qiita.com/shinmura0/items/cfb51f66b2d172f2403b
コード全文
相変わらず、ぐちゃぐちゃですみません。
12/18 コード修正 (@gungiven さんご指摘ありがとうございます。)
from __future__ import absolute_import
from __future__ import division
from __future__ import print_function

from keras.layers import Lambda, Input, Dense, Reshape
from keras.models import Model
from keras.datasets import mnist
from keras.datasets import fashion_mnist
from keras.losses import mse
from keras.utils import plot_model
from keras import backend as K
from keras.layers import BatchNormalization, Activation, Flatten
from keras.layers.convolutional import Conv2DTranspose, Conv2D

import numpy as np
import matplotlib.pyplot as plt
import matplotlib.colors as colors
import os

# ヒートマップの描画
def save_img(x_normal, x_anomaly, img_normal, img_anomaly, name):
    path = 'images/'
    if not os.path.exists(path):
          os.mkdir(path)

    # ※注意 評価したヒートマップを1~10に正規化
    img_max = np.max([img_normal, img_anomaly])
    img_min = np.min([img_normal, img_anomaly])
    img_normal = (img_normal-img_min)/(img_max-img_min) * 9 + 1
    img_anomaly = (img_anomaly-img_min)/(img_max-img_min) * 9 + 1

    plt.figure()
    plt.subplot(2, 2, 1)
    plt.imshow(x_normal[0,:,:,0], cmap='gray')
    plt.axis('off')
    plt.colorbar()

    plt.subplot(2, 2, 2)
    plt.imshow(img_normal[0,:,:,0], cmap='Blues',norm=colors.LogNorm())
    plt.axis('off')
    plt.colorbar()
    plt.clim(1, 10)

    plt.title(name + "normal")

    plt.subplot(2, 2, 3)
    plt.imshow(x_anomaly[0,:,:,0], cmap='gray')
    plt.axis('off')
    plt.colorbar()

    plt.subplot(2, 2, 4)
    plt.imshow(img_anomaly[0,:,:,0], cmap='Blues',norm=colors.LogNorm())
    plt.axis('off')
    plt.colorbar()
    plt.clim(1, 10)

    plt.title(name + "anomaly")

    plt.savefig(path + name +".png")
    plt.show()
    plt.close()

# ヒートマップの計算
def evaluate_img(model, x_normal, x_anomaly, name, height=8, width=8, move=2):
    img_normal = np.zeros((x_normal.shape))
    img_anomaly = np.zeros((x_normal.shape))

    for i in range(int((x_normal.shape[1]-height)/move)+1):
        for j in range(int((x_normal.shape[2]-width)/move)+1):
            x_sub_normal = x_normal[0, i*move:i*move+height, j*move:j*move+width, 0]
            x_sub_anomaly = x_anomaly[0, i*move:i*move+height, j*move:j*move+width, 0]
            x_sub_normal = x_sub_normal.reshape(1, height, width, 1)
            x_sub_anomaly = x_sub_anomaly.reshape(1, height, width, 1)

            #従来手法
            if name == "old_":
                #正常のスコア
                normal_score = model.evaluate(x_sub_normal, batch_size=1, verbose=0)
                img_normal[0, i*move:i*move+height, j*move:j*move+width, 0] +=  normal_score

                #異常のスコア
                anomaly_score = model.evaluate(x_sub_anomaly, batch_size=1, verbose=0)
                img_anomaly[0, i*move:i*move+height, j*move:j*move+width, 0] +=  anomaly_score

            #提案手法
            else:
                #正常のスコア
                mu, sigma = model.predict(x_sub_normal, batch_size=1, verbose=0)
                loss = 0
                for k in range(height):
                    for l in range(width):
                        loss += 0.5 * (x_sub_normal[0,k,l,0] - mu[0,k,l,0])**2 / sigma[0,k,l,0]
                img_normal[0, i*move:i*move+height, j*move:j*move+width, 0] +=  loss

                #異常のスコア
                mu, sigma = model.predict(x_sub_anomaly, batch_size=1, verbose=0)
                loss = 0
                for k in range(height):
                    for l in range(width):
                        loss += 0.5 * (x_sub_anomaly[0,k,l,0] - mu[0,k,l,0])**2 / sigma[0,k,l,0]
                img_anomaly[0, i*move:i*move+height, j*move:j*move+width, 0] +=  loss

    save_img(x_normal, x_anomaly, img_normal, img_anomaly, name)


# 8×8のサイズに切り出す
def cut_img(x, number, height=8, width=8):
    print("cutting images ...")
    x_out = []
    x_shape = x.shape

    for i in range(number):
        shape_0 = np.random.randint(0,x_shape[0])
        shape_1 = np.random.randint(0,x_shape[1]-height)
        shape_2 = np.random.randint(0,x_shape[2]-width)
        temp = x[shape_0, shape_1:shape_1+height, shape_2:shape_2+width, 0]
        x_out.append(temp.reshape((height, width, x_shape[3])))

    print("Complete.")
    x_out = np.array(x_out)

    return x_out

# reparameterization trick
# instead of sampling from Q(z|X), sample eps = N(0,I)
# z = z_mean + sqrt(var)*eps
def sampling(args):
    z_mean, z_log_var = args
    batch = K.shape(z_mean)[0]
    dim = K.int_shape(z_mean)[1]
    # by default, random_normal has mean=0 and std=1.0
    epsilon = K.random_normal(shape=(batch, dim))
    return z_mean + K.exp(0.5 * z_log_var) * epsilon

# dataset
(x_train, y_train), (x_test, y_test) = mnist.load_data()
# (x_train, y_train), (x_test, y_test) = fashion_mnist.load_data()

x_train = x_train.reshape(x_train.shape[0], 28, 28, 1)
x_test = x_test.reshape(x_test.shape[0], 28, 28, 1)

x_train = x_train.astype('float32') / 255
x_test = x_test.astype('float32') / 255

# 1と9のデータ抽出
x_train_1 = []
x_test_1 = []
x_test_9 = []

x_train_shape = x_train.shape

for i in range(len(x_train)):
  if y_train[i] == 1:#スニーカーは7
    temp = x_train[i,:,:,:]
    x_train_1.append(temp.reshape((x_train_shape[1],x_train_shape[2],x_train_shape[3])))

x_train_1 = np.array(x_train_1)
x_train_1 = cut_img(x_train_1, 100000)
print("train data:",len(x_train_1))

for i in range(len(x_test)):
  if y_test[i] == 1:#スニーカーは7
    temp = x_test[i,:,:,:]
    x_test_1.append(temp.reshape((x_train_shape[1],x_train_shape[2],x_train_shape[3])))

  if y_test[i] == 9:
    temp = x_test[i,:,:,:]
    x_test_9.append(temp.reshape((x_train_shape[1],x_train_shape[2],x_train_shape[3])))

x_test_1 = np.array(x_test_1)
x_test_9 = np.array(x_test_9)

# network parameters
input_shape=(8, 8, 1)
batch_size = 128
latent_dim = 2
epochs = 10
Nc = 16

# build encoder model
inputs = Input(shape=input_shape, name='encoder_input')
x = Conv2D(Nc, kernel_size=2, strides=2)(inputs)
x = BatchNormalization()(x)
x = Activation('relu')(x)
x = Conv2D(2*Nc, kernel_size=2, strides=2)(x)
x = BatchNormalization()(x)
x = Activation('relu')(x)
x = Flatten()(x)

z_mean = Dense(latent_dim, name='z_mean')(x)
z_log_var = Dense(latent_dim, name='z_log_var')(x)
z = Lambda(sampling, output_shape=(latent_dim,), name='z')([z_mean, z_log_var])

encoder = Model(inputs, [z_mean, z_log_var, z], name='encoder')
# encoder.summary()

# build decoder model
latent_inputs = Input(shape=(latent_dim,), name='z_sampling')
x = Dense(2*2)(latent_inputs)
x = BatchNormalization()(x)
x = Activation('relu')(x)
x = Reshape((2,2,1))(x)
x = Conv2DTranspose(2*Nc, kernel_size=2, strides=2, padding='same')(x)
x = BatchNormalization()(x)
x = Activation('relu')(x)
x = Conv2DTranspose(Nc, kernel_size=2, strides=2, padding='same')(x)
x = BatchNormalization()(x)
x = Activation('relu')(x)

x1 = Conv2DTranspose(1, kernel_size=4, padding='same')(x)
x1 = BatchNormalization()(x1)
out1 = Activation('sigmoid')(x1)#out.shape=(n,8,8,1)

x2 = Conv2DTranspose(1, kernel_size=4, padding='same')(x)
x2 = BatchNormalization()(x2)
out2 = Activation('sigmoid')(x2)#out.shape=(n,8,8,1)

decoder = Model(latent_inputs, [out1, out2], name='decoder')
# decoder.summary()

# build VAE model
outputs_mu, outputs_sigma_2 = decoder(encoder(inputs)[2])
vae = Model(inputs, [outputs_mu, outputs_sigma_2], name='vae_mlp')

# VAE loss
m_vae_loss = (K.flatten(inputs) - K.flatten(outputs_mu))**2 / K.flatten(outputs_sigma_2)
m_vae_loss = 0.5 * K.sum(m_vae_loss)

a_vae_loss = K.log(2 * 3.14 * K.flatten(outputs_sigma_2))
a_vae_loss = 0.5 * K.sum(a_vae_loss)

kl_loss = 1 + z_log_var - K.square(z_mean) - K.exp(z_log_var)
kl_loss = K.sum(kl_loss, axis=-1)
kl_loss *= -0.5

vae_loss = K.mean(kl_loss + m_vae_loss + a_vae_loss)
vae.add_loss(vae_loss)
vae.compile(optimizer='adam')

# train the autoencoder
vae.fit(x_train_1,
        epochs=epochs,
        batch_size=batch_size)
        #validation_data=(x_test, None))
vae.save_weights('vae_mlp_mnist.h5')

# 正常/異常のテストデータ
idx1 = np.random.randint(len(x_test_1))
idx2 = np.random.randint(len(x_test_9))

test_normal = x_test_1[idx1,:,:,:]
test_anomaly = x_test_9[idx2,:,:,:]
test_normal = test_normal.reshape(1, test_normal.shape[0], test_normal.shape[1], test_normal.shape[2])
test_anomaly = test_anomaly.reshape(test_normal.shape)

# 従来手法の可視化
evaluate_img(vae, test_normal, test_anomaly, "old_")

# 提案手法の可視化
evaluate_img(vae, test_normal, test_anomaly, "new_")
