EDAとは
探索的データ分析(Explanatory Data Analysis)とは、データサイエンティストがデータに対する理解を深めるために用いる手法です。主にデータの可視化を通して各種統計量や欠損値、外れ値などを見つけます。
今回はEDAに関するツールで便利なものがあったのでまとめます。
pandas-profiling
今回はkaggleのtitanicのデータを使います。
インストールに関してはこちらを参照
import pandas as pd
import pandas_profiling as pp
train_df = pd.read_csv('train.csv')
pp.ProfileReport(train_df)
出力結果は長くなるのでこちらの記事を参照してください。
pandas-profilingの問題点として、結果が出力されるまでに時間がかかる点が挙げられます。今回のデータでは自分の環境では28.3sかかりました。より大きなデータとなったときに計算がなかなか終わらない可能性があります。
この問題はMinimal modeを使うことで部分的に解決できます。
pp.ProfileReport(train_df,minimal=True)
これにより、実行時間は4分の1ほどでデータの変数(Variables)の部分まで取り出すことができます。
AutoViz
インストールはこちら
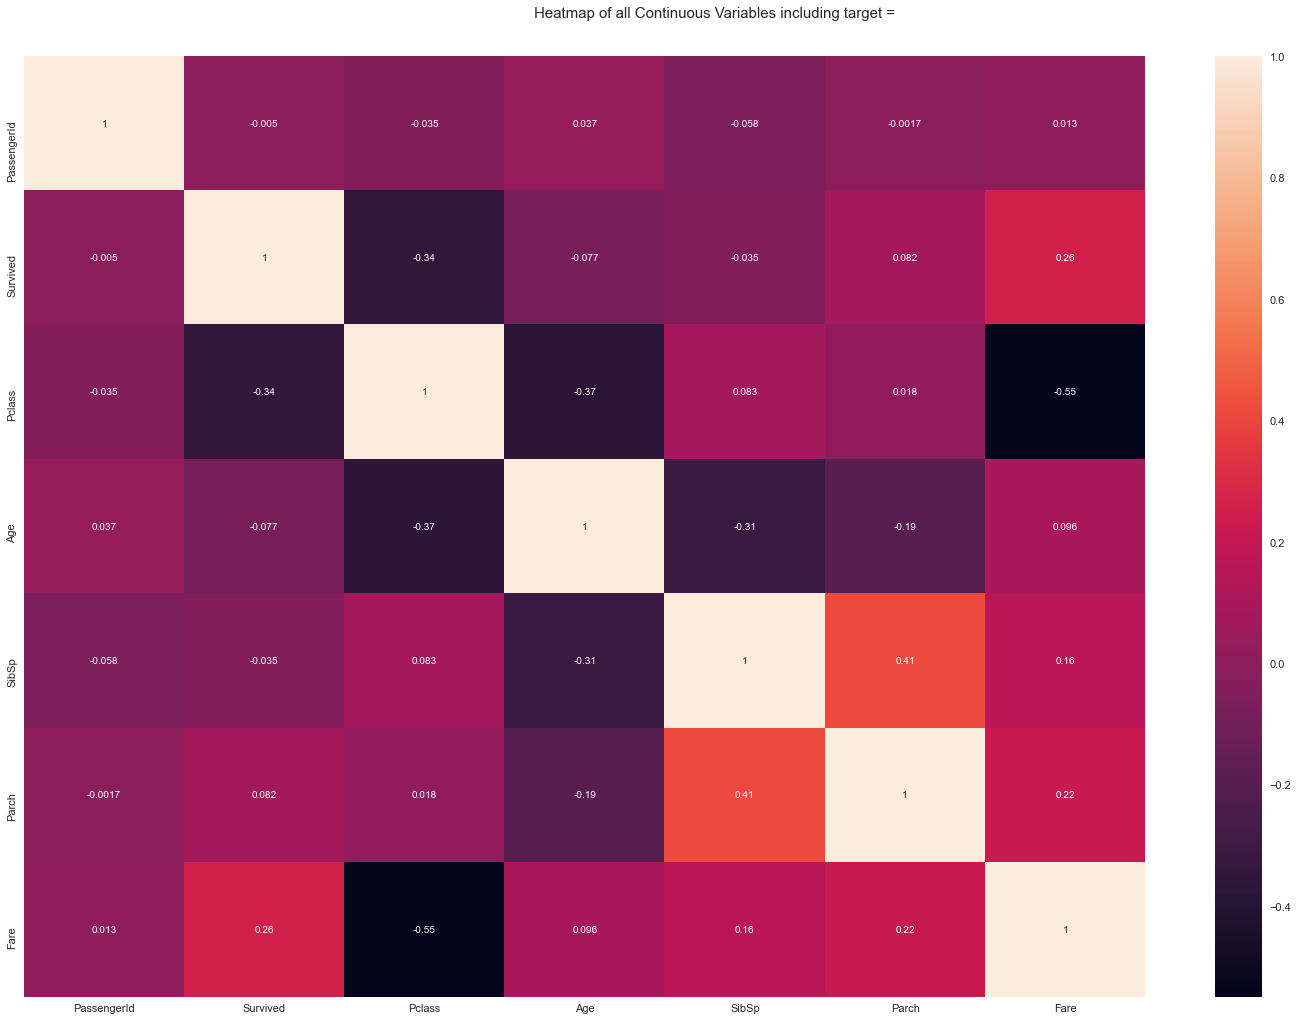
pandas-profilingと似ていますが、各変数の対応関係も自動で可視化してくれるので便利です。(*DataFrame型だと読み込めないので注意)
from autoviz.AutoViz_Class import AutoViz_Class
AV = AutoViz_Class()
autoviz = AV.AutoViz('train.csv')
sweetviz
import sweetviz as sv
report = sv.analyze(train_df)
report.show_notebook()#notebook上で表示

ほとんどpandas-profilingのVariablesと同じです。
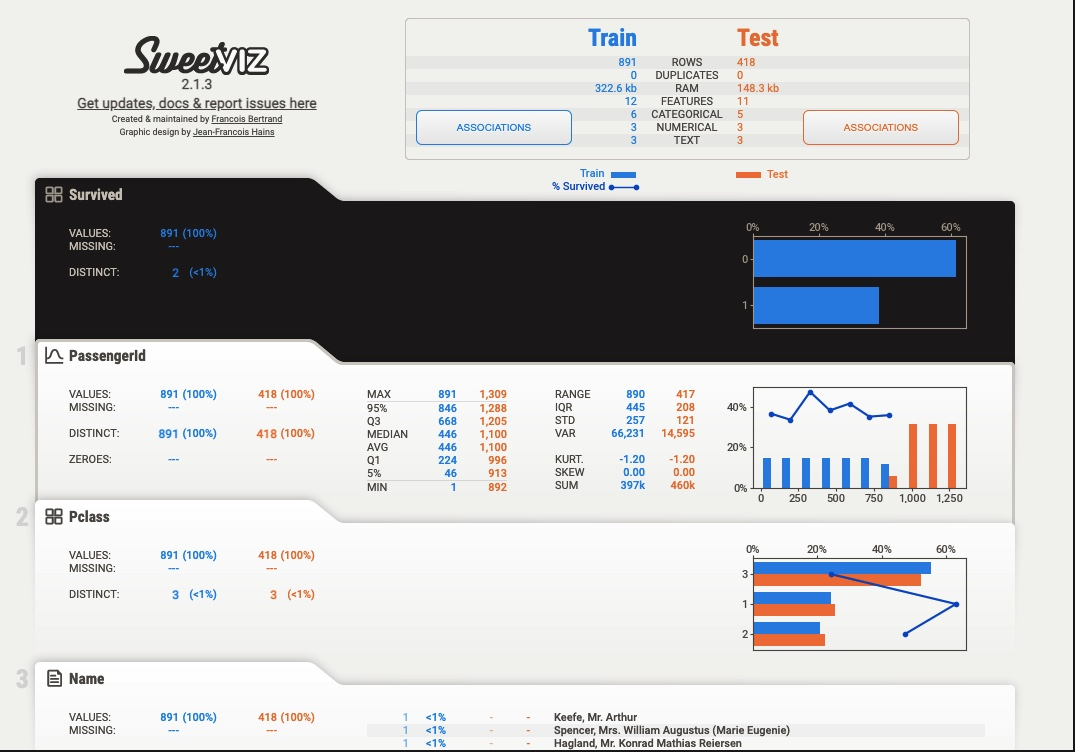
sweetvizの良い点は、学習データとテストデータを目的変数を設定して比較できることです。
compare_report = sv.compare([train_df, "Train"], [test_df, "Test"], "Survived")#trainデータとtestデータを比較 目的変数はSurvived
compare_report.show_notebook()
参考サイト
pandas-profiling
Autoviz
sweetviz
【Pythonメモ】pandas-profilingが探索的データ解析にめちゃめちゃ便利だった件
【EDA】Sweetvizの紹介 (+pandas-profilingとの比較)
【Autoviz】機械学習EDAの便利ツールをPythonで試してみる


