はじめに
やりたいことはタイトルの通り。
5年ほどBME280で室内温湿度を監視してきた。Raspberry Pi(3B+; 4B)をサーバー兼ロガーで使ってきたが、停電その他の理由(おおかた主のミス)でSDカードのOSが死ぬこと数回。SDカード寿命を考えてHDDにデータを書いたりオーバーレイ設定にしてみたり工夫はしたけれど、手軽さが失われた時点でRaspberry Piにこだわらなくても良いのでは?という気がしてきた。
ESP8266/ESP32やRaspberryPiPicoWのようにWiFi接続が可能なマイクロコントローラであれば、電源断に対する耐性も高く手放し運用が可能。
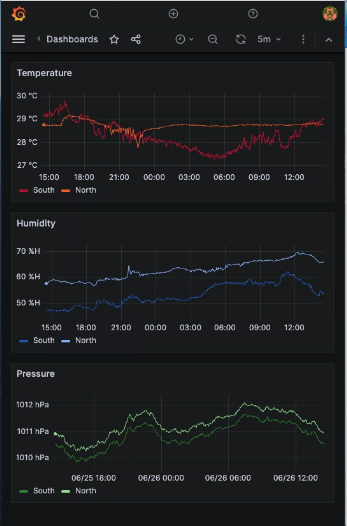
データ蓄積用のサーバーは普段使っているSynologyを使うことで安定稼働を目指す。これまで自作スクリプトで描いていたグラフは、同じSynologyにGrafanaを立ち上げて可視化してみることとした。
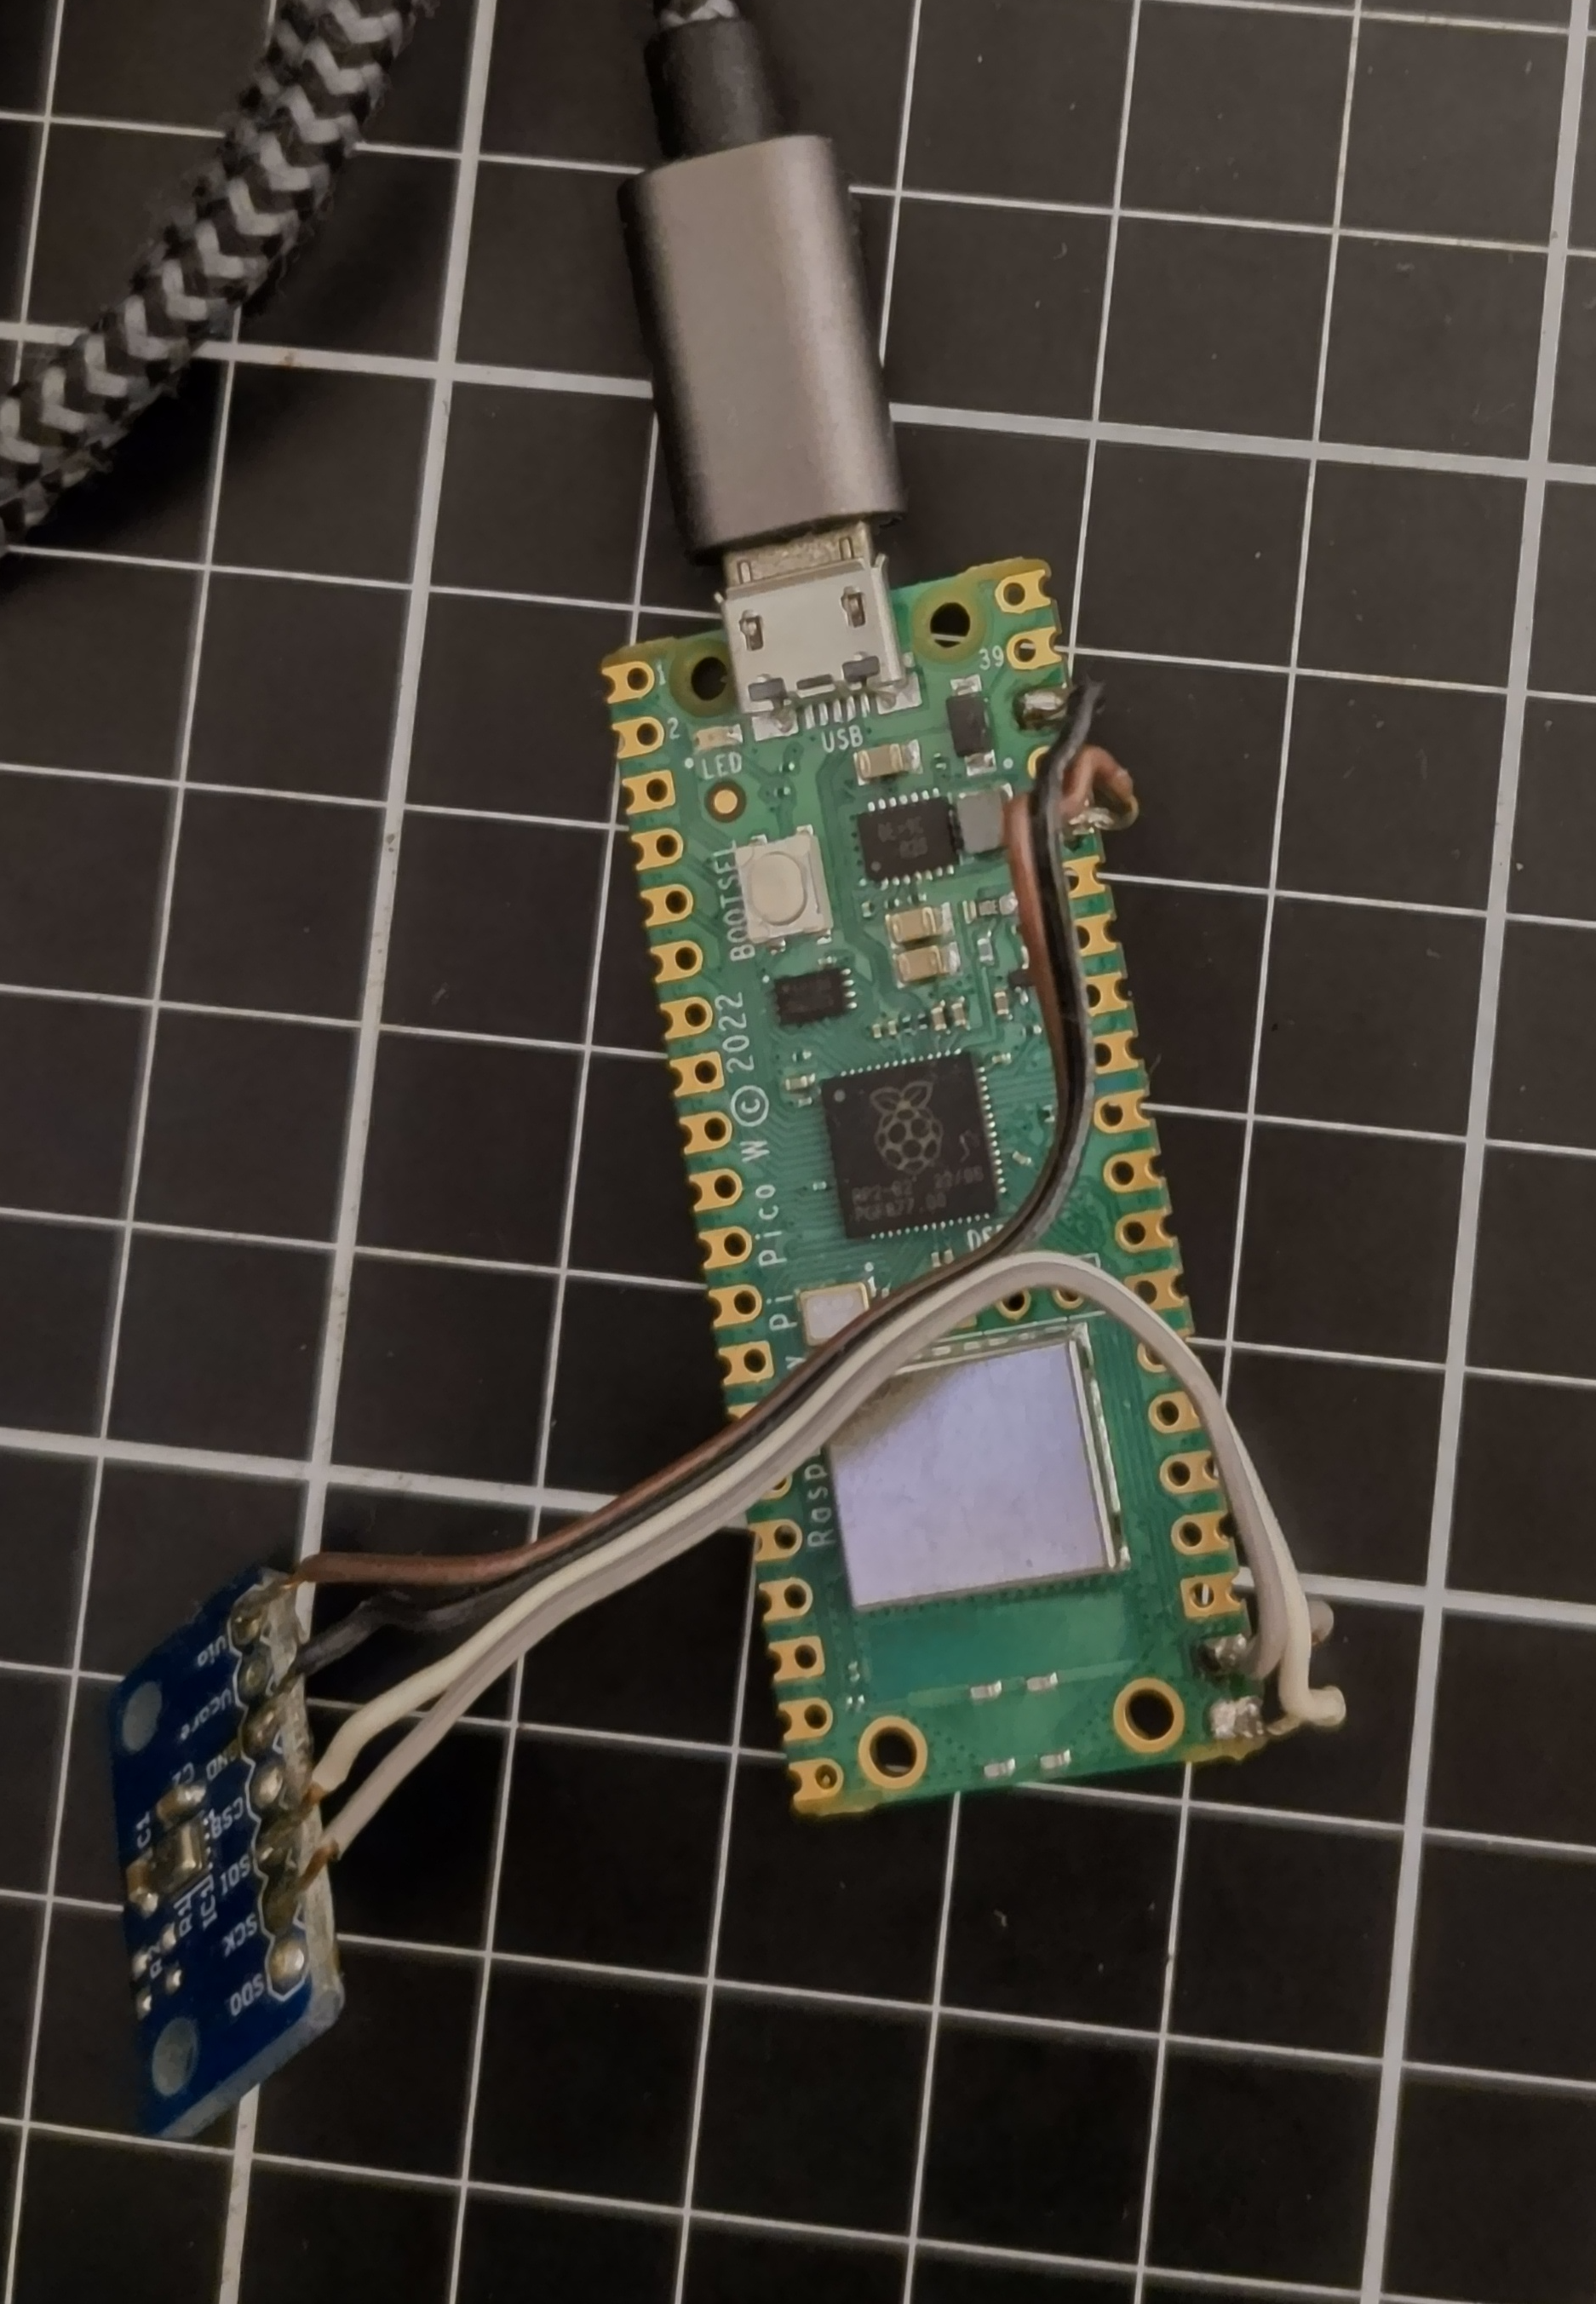
構成
- Raspberry Pi Pico W
- BME280ブレイクアウトボード(Switch Science)
- Synology DS220+
(初稿ではSynologyでのDockerの使い方、influxDBの立て方は別記事に譲る)
コード
約1分ごとにデータを取得してサーバに送る。データは1度に15個取得して最大値と最小値を除外、平均値を算出する。
BME280_influxdb.py
from machine import I2C, Pin
import bme280
import utime
import network
import urequests
import ubinascii

i2c=I2C(0, sda=Pin(16), scl=Pin(17), freq=400000)
bme=bme280.BME280(i2c=i2c)

bsize=15

ssid = 'your ssid'
password = 'your password'

def connect():
    #Connect to WLAN
    wlan = network.WLAN(network.STA_IF)
    wlan.active(True)
    wlan.connect(ssid, password)
    while wlan.isconnected() == False:
        print('Waiting for connection')
        utime.sleep(1)
    ip = wlan.ifconfig()[0]
    print(f'Connected on {ip}')
    return ip

def ledblink():
    machine.Pin('LED', machine.Pin.OUT).toggle()
    utime.sleep(0.1)
    machine.Pin('LED', machine.Pin.OUT).toggle()

def readval():
    t=[]
    p=[]
    h=[]
    for i in range(bsize):
        raw = bme.read_compensated_data()

        t.append(raw[0]/100)
        p.append(raw[1]/25600)
        h.append(raw[2]/1024)

        d = ledblink()
        utime.sleep(0.9)

    del t[t.index(max(t))]
    del t[t.index(min(t))]
    del p[p.index(max(p))]
    del p[p.index(min(p))]
    del h[h.index(max(h))]
    del h[h.index(min(h))]

    tav=sum(t)/len(t)
    pav=sum(p)/len(p)
    hav=sum(h)/len(h)

    return tav,pav,hav

def postadata(temperature, humidity, pressure):
    mac = ubinascii.hexlify(network.WLAN().config('mac')).decode()
    headers = {'Accept': 'text/plain',
           'Connection': 'close',
           'Content-type': 'application/octet-stream'}

    location="south"
    unitid=mac
    influx_endpoint = 'http://xxx.xxx.x.xx:yyyy/write?db=sensor'
    fields = (u'sensor,'
              u'location={location}'.format(location=location),
              u',unitid={unitid}'.format(unitid=unitid),
              u' ',
              u'temperature={temp}'.format(temp=temperature),
              u',humidity={humidity}'.format(humidity=humidity),
              u',pressure={pressure}'.format(pressure=pressure))
        # building influxdb point protocol measurement.
        # See https://docs.influxdata.com/influxdb/v1.2/write_protocols/line_protocol_tutorial/
    point = ''.join(fields)
    response = urequests.post(influx_endpoint,
                                  data=point,
                                  headers=headers)
    response.close()
    print('Submitted :{}'.format(point))
    print(response)

#MAIN
def main():
    ip = connect()

    while True:
        t,p,h = readval()
        postadata(t,h,p)
        print(t,p,h)

        utime.sleep(45)

if __name__ == '__main__':
    main()
結果
現在は同じ動作をするESP-WROOM-02の装置と2台で2週間ほど稼働しており、順調にデータが蓄積されている。