

ADB-S(Autonomous Database Serverless) は Exadata を PDB として利用する PaaS で Exadata IORM によって Disk I/O が制御されています。
本記事では ADB-S で Exadata IORM が動作したかを確認してみますやで。
彡(^)(^)
1. Exadata IORM(I/O Resource Manager) とは
Exadata IORM(I/O Resource Manager) は Exadata Storage Server で動作する機能で、Exadata上で動作する Oracle Database の Disk I/O を制御します。
複数データベースを動作させるケースで、特定のデータベースの Disk I/O を抑制あるいは優先するといった制御が可能です。
5.1.1 Exadata Database MachineのI/Oリソース管理(IORM)について
https://docs.oracle.com/cd/G48200_01/sagug/i-o-resource-management-exadata-database-machine.html
2. Exadata IORM の監視について(マニュアル)
Exadata IORM の監視については下記マニュアルに記載があります。
6.3.8 I/Oリソース管理(IORM)の監視
https://docs.oracle.com/cd/G48200_01/sagug/monitoring-iorm.html6.3.7.3 SQLモニターを使用したスマートI/Oの監視
https://docs.oracle.com/cd/G48200_01/sagug/monitoring-smart-io-using-sql-monitor.html
本記事では下記の方法で動的ビューを追跡して Exadata IORM動作を追跡します。
※AWRレポートやSQLモニターも取得してみましたが今回のケースでは追跡できず……。
6.3.8.2 データベース統計を使用したI/Oリソース管理(IORM)の監視
https://docs.oracle.com/cd/G48200_01/sagug/monitoring-iorm-using-db-stats.html
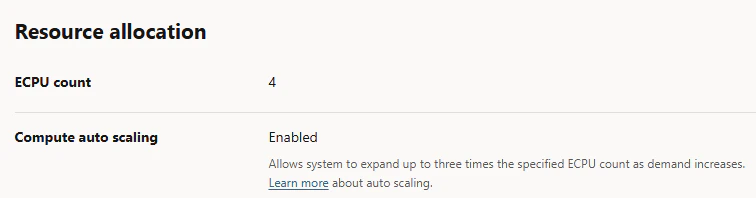
3. ADB-S のリソース
ATP-S, ECPU=4, Autoscaling有効化で計測しました。
4. テスト用データのセットアップ
テスト用のデータは以下の SQL でセットアップしました。
SET ECHO ON;
SET TIME ON;
SET TIMING ON;
SET FEEDBACK ON SQL_ID;

-- Drop Table
DROP TABLE TEST_TABLE PURGE;

-- Create Table
CREATE TABLE TEST_TABLE (
   C1 NUMBER
  ,C2 VARCHAR2(100)
  ,C3 DATE
  ,C4 TIMESTAMP
  ,C5 VARCHAR2(100)
  ,C6 DATE
  ,C7 TIMESTAMP
);

-- Dummy Data
SET TIME ON;
SET TIMING ON;
INSERT INTO TEST_TABLE
SELECT LEVEL
     , 'TEST' || TO_CHAR(LEVEL)
     , TRUNC(SYSDATE, 'DD') + (LEVEL/24/60/60)
     , SYSTIMESTAMP
     , 'TEST' || TO_CHAR(LEVEL)
     , TRUNC(SYSDATE, 'DD') + (LEVEL/24/60/60)
     , SYSTIMESTAMP
  FROM DUAL
CONNECT BY LEVEL <= 10000000;

-- Commit
COMMIT;
5. テスト用SQL
下記の UPDATE文 を実行しました。
SET LINESIZE 300;
SET PAGESIZE 1000;
SET FEEDBACK ON SQL_ID;
SET TRIMSPOOL ON;
COLUMN NAME FORMAT A50;
COLUMN VALUE FORMAT 999,999,999,999,999;
SET LONG 1000000;
SET LONGC 1000000;
SPOOL update_1para.log

SELECT INST_ID, NAME, VALUE
  FROM GV$SYSSTAT
 WHERE NAME IN (
           'Session total flash IO requests'
         , 'Session IORM flash wait time'
         , 'PDB total disk IO requests'
         , 'PDB IORM disk wait time'
       )
 ORDER BY NAME;

UPDATE TEST_TABLE
  SET C1 = C1 + C1
    , C2 = C2 || C2
    , C3 = SYSDATE
    , C4 = SYSTIMESTAMP
    , C5 = C5 || C5;

COMMIT;

SELECT INST_ID, NAME, VALUE
  FROM GV$SYSSTAT
 WHERE NAME IN (
           'Session total flash IO requests'
         , 'Session IORM flash wait time'
         , 'PDB total disk IO requests'
         , 'PDB IORM disk wait time'
       )
 ORDER BY NAME;

SELECT DBMS_SQLTUNE.REPORT_SQL_MONITOR(sql_id => 'anhgv97vruj1d', TYPE => 'TEXT') FROM DUAL;
SELECT * FROM TABLE(DBMS_XPLAN.DISPLAY_CURSOR('anhgv97vruj1d', NULL, 'ADVANCED ALLSTATS LAST'));

SPOOL OFF;
実行結果は以下の通りです。
07:22:25 SQL> SELECT INST_ID, NAME, VALUE
07:22:25   2  	FROM GV$SYSSTAT
07:22:25   3   WHERE NAME IN (
07:22:25   4  		 'Session total flash IO requests'
07:22:25   5  	       , 'Session IORM flash wait time'
07:22:25   6  	       , 'PDB total disk IO requests'
07:22:25   7  	       , 'PDB IORM disk wait time'
07:22:25   8  	     )
07:22:25   9   ORDER BY NAME;

   INST_ID NAME                                                              VALUE
---------- -------------------------------------------------- --------------------
         2 PDB IORM disk wait time                                         240,032
         2 PDB total disk IO requests                                      356,842
         2 Session IORM flash wait time                                  4,304,435
         2 Session total flash IO requests                               3,508,622

4 rows selected.

SQL_ID: 45q45czan566n
Elapsed: 00:00:00.57
07:22:26 SQL>
07:22:26 SQL> UPDATE TEST_TABLE
07:22:26   2  	SET C1 = C1 + C1
07:22:26   3  	  , C2 = C2 || C2
07:22:26   4  	  , C3 = SYSDATE
07:22:26   5  	  , C4 = SYSTIMESTAMP
07:22:26   6  	  , C5 = C5 || C5;

10000000 rows updated.

SQL_ID: anhgv97vruj1d
Elapsed: 00:11:11.18
07:33:37 SQL>
07:33:37 SQL> COMMIT;

Commit complete.

SQL_ID: 8ggw94h7mvxd7
Elapsed: 00:00:00.12
07:33:37 SQL>
07:33:37 SQL> SELECT INST_ID, NAME, VALUE
07:33:37   2  	FROM GV$SYSSTAT
07:33:37   3   WHERE NAME IN (
07:33:37   4  		 'Session total flash IO requests'
07:33:37   5  	       , 'Session IORM flash wait time'
07:33:37   6  	       , 'PDB total disk IO requests'
07:33:37   7  	       , 'PDB IORM disk wait time'
07:33:37   8  	     )
07:33:37   9   ORDER BY NAME;

   INST_ID NAME                                                              VALUE
---------- -------------------------------------------------- --------------------
         2 PDB IORM disk wait time                                         266,333
         2 PDB total disk IO requests                                      367,614
         2 Session IORM flash wait time                                  4,304,439
         2 Session total flash IO requests                               3,928,061

4 rows selected.

SQL_ID: 45q45czan566n
Elapsed: 00:00:00.52
07:33:38 SQL>
07:33:38 SQL> SELECT DBMS_SQLTUNE.REPORT_SQL_MONITOR(sql_id => 'anhgv97vruj1d', TYPE => 'TEXT') FROM DUAL;

DBMS_SQLTUNE.REPORT_SQL_MONITOR(SQL_ID=>'ANHGV97VRUJ1D',TYPE=>'TEXT')
------------------------------------------------------------------------------------------------------------------------------------------------------------------------------------------------------------------------------------------------------------------------------------------------------------
SQL Monitoring Report

SQL Text
------------------------------
UPDATE TEST_TABLE SET C1 = C1 + C1 , C2 = C2 || C2 , C3 = SYSDATE , C4 = SYSTIMESTAMP , C5 = C5 || C5

Global Information
------------------------------
 Status              :  DONE
 Instance ID         :  2
 Session             :  ADMIN (57704:40043)
 SQL ID              :  anhgv97vruj1d
 SQL Execution ID    :  33554435
 Execution Started   :  05/28/2026 07:22:25
 First Refresh Time  :  05/28/2026 07:22:29
 Last Refresh Time   :  05/28/2026 07:33:36
 Duration            :  671s
 Module/Action       :  SQL*Plus/-
 Service             :  G3AA9E164378CB1_AYUATPPDB1_tpurgent.adb.oraclecloud.com
 Program             :  sqlplus@ayu-prvcomp2 (TNS V1-V3)

Global Stats
=================================================================================
| Elapsed |   Cpu   |    IO    | Concurrency |  Other   | Buffer | Read | Read  |
| Time(s) | Time(s) | Waits(s) |  Waits(s)   | Waits(s) |  Gets  | Reqs | Bytes |
=================================================================================
|     671 |     451 |      203 |        0.29 |       17 |    61M | 430K |   4GB |
=================================================================================

SQL Plan Monitoring Details (Plan Hash Value=385506193)
==========================================================================================================================================================================================
| Id |          Operation           |    Name    |  Rows   | Cost  |   Time    | Start  | Execs |   Rows   | Read  | Read  | Activity |                 Activity Detail                  |
|    |                              |            | (Estim) |       | Active(s) | Active |       | (Actual) | Reqs  | Bytes |   (%)    |                   (# samples)                    |
==========================================================================================================================================================================================
|  0 | UPDATE STATEMENT             |            |         |       |       661 |     +4 |     3 |        0 |       |       |     3.35 | Cpu (2)                                          |
|    |                              |            |         |       |           |        |       |          |       |       |          | enq: CR - block range reuse ckpt (10)            |
|    |                              |            |         |       |           |        |       |          |       |       |          | reliable message (10)                            |
|  1 |   UPDATE                     | TEST_TABLE |         |       |       664 |     +1 |     3 |        0 |  394K |   3GB |    91.93 | resmgr:internal state change (1)                 |
|    |                              |            |         |       |           |        |       |          |       |       |          | Cpu (403)                                        |
|    |                              |            |         |       |           |        |       |          |       |       |          | ASM IO for non-blocking poll (3)                 |
|    |                              |            |         |       |           |        |       |          |       |       |          | cell list of blocks physical read (190)          |
|    |                              |            |         |       |           |        |       |          |       |       |          | cell multiblock physical read (3)                |
|    |                              |            |         |       |           |        |       |          |       |       |          | cell single block physical read: flash cache (4) |
|  2 |    TABLE ACCESS STORAGE FULL | TEST_TABLE |     10M | 28796 |       669 |     +4 |     3 |      24M | 36174 | 372MB |     4.72 | Cpu (21)                                         |
|    |                              |            |         |       |           |        |       |          |       |       |          | cell multiblock physical read (1)                |
|    |                              |            |         |       |           |        |       |          |       |       |          | cell single block physical read: flash cache (9) |
==========================================================================================================================================================================================


1 row selected.

SQL_ID: 0j8aw812pubfd
Elapsed: 00:00:00.32
07:33:38 SQL> SELECT * FROM TABLE(DBMS_XPLAN.DISPLAY_CURSOR('anhgv97vruj1d', NULL, 'ADVANCED ALLSTATS LAST'));

PLAN_TABLE_OUTPUT
------------------------------------------------------------------------------------------------------------------------------------------------------------------------------------------------------------------------------------------------------------------------------------------------------------
SQL_ID  anhgv97vruj1d, child number 0
-------------------------------------
UPDATE TEST_TABLE   SET C1 = C1 + C1     , C2 = C2 || C2     , C3 =
SYSDATE     , C4 = SYSTIMESTAMP     , C5 = C5 || C5

Plan hash value: 385506193

------------------------------------------------------------------------------------------
| Id  | Operation                  | Name       | E-Rows |E-Bytes| Cost (%CPU)| E-Time   |
------------------------------------------------------------------------------------------
|   0 | UPDATE STATEMENT           |            |        |       | 28796 (100)|          |
|   1 |  UPDATE                    | TEST_TABLE |        |       |            |          |
|   2 |   TABLE ACCESS STORAGE FULL| TEST_TABLE |     10M|  1346M| 28796   (1)| 00:00:02 |
------------------------------------------------------------------------------------------

Query Block Name / Object Alias (identified by operation id):
-------------------------------------------------------------

   1 - UPD$1
   2 - UPD$1 / TEST_TABLE@UPD$1

Outline Data
-------------

  /*+
      BEGIN_OUTLINE_DATA
      IGNORE_OPTIM_EMBEDDED_HINTS
      OPTIMIZER_FEATURES_ENABLE('19.1.0')
      DB_VERSION('19.1.0')
      OPT_PARAM('_fix_control' '20648883:0 26552730:1 27175987:0 30142527:1 30539126:1
              30235878:1 29972495:0 30006705:1 30483151:1 30483217:1 30483184:1 28144569:1
              30028663:1 30652595:1 29930457:1 30822446:1 30008456:1 30235691:1 30646077:1
              30231086:1 27261477:1 31069997:1 31077481:1 30942641:1 30751171:1 29636078:1
              30249927:1 31091402:1 29687220:1 30537403:1 31580352:1 30198239:7 31266779:1
              31487332:1 31821701:1 30232638:1 29487407:1 31580374:1 32014520:1 32037237:1
              31974424:1 31945701:1 30311403:1 31545400:1 31143146:1 32107621:1 32205825:1
              30972817:1 32838405:1 28173995:1 29867728:1 30786641:1 28776431:1 31579233:1
              32108311:1 32471594:1 33069936:1 31060590:1 32806672:1 33659818:3 32909932:1
              31966442:1 10123661:1 33354270:1 30483200:1 34092979:1 33381775:1 33926164:1
              34340011:1 32508585:1 31954734:1 34054474:1 32616683:1 34721367:1 33649782:1
              34807859:1 34749901:1 35330725:1 32498602:1 34131435:1 35495824:1 33412913:1
              35880688:1 32436948:1 35778800:1 36003028:1 33792497:1 36554842:1 31720959:1
              36504137:1 35614342:1 36283175:1 36004220:1 35111847:1 36868551:1 36635255:1
              36675198:1 37400112:1 37626161:1 37636261:1 37815535:1 37818321:1 37841451:1
              38088006:1 37668482:1')
      ALL_ROWS
      OUTLINE_LEAF(@"UPD$1")
      FULL(@"UPD$1" "TEST_TABLE"@"UPD$1")
      END_OUTLINE_DATA
  */

Column Projection Information (identified by operation id):
-----------------------------------------------------------

   2 - (upd=2,3,4,5,6; rowset=256) "TEST_TABLE".ROWID[ROWID,10], "C1"[NUMBER,22],
       "C2"[VARCHAR2,100], "C3"[DATE,7], "C4"[TIMESTAMP,11], "C5"[VARCHAR2,100]

Note
-----
   - dynamic statistics used: dynamic sampling (level=2)
   - PDML disabled because object is not decorated with parallel clause
   - Warning: basic plan statistics not available. These are only collected when:
       * hint 'gather_plan_statistics' is used for the statement or
       * parameter 'statistics_level' is set to 'ALL', at session or system level

Query Block Registry:
---------------------

  <q o="2" f="y"><n><![CDATA[UPD$1]]></n><f><h><t><![CDATA[TEST_TABLE]]></t><s><![CD
        ATA[UPD$1]]></s></h></f></q>


72 rows selected.

SQL_ID: bng8p488nd50c
Elapsed: 00:00:00.06
07:33:38 SQL>
6. テスト結果(ログ)の分析
UPDATE文前後で採取した SYSSTAT統計 を確認します。
- UPDATE文実行前
   INST_ID NAME                                                              VALUE
---------- -------------------------------------------------- --------------------
         2 PDB IORM disk wait time                                         240,032
         2 PDB total disk IO requests                                      356,842
         2 Session IORM flash wait time                                  4,304,435
         2 Session total flash IO requests                               3,508,622
- UPDATE文実行後
   INST_ID NAME                                                              VALUE
---------- -------------------------------------------------- --------------------
         2 PDB IORM disk wait time                                         266,333 ★増えている
         2 PDB total disk IO requests                                      367,614
         2 Session IORM flash wait time                                  4,304,439 ★微増
         2 Session total flash IO requests                               3,928,061
IORM によるディスク読み込み待ちが発生したことを示す「PDB IORM disk wait time」統計が増えていることが確認できます。
「Session IORM flash wait time」統計も微増していました。
SQL監視レポート より Disk I/O待ち(cell list of blocks physical read)の発生も確認できます。
SQL Plan Monitoring Details (Plan Hash Value=385506193)
=================================================================================================================
| Id |          Operation           |    Name    || Activity |                 Activity Detail                  |
|    |                              |            ||   (%)    |                   (# samples)                    |
=================================================================================================================
|  0 | UPDATE STATEMENT             |            ||     3.35 | Cpu (2)                                          |
|    |                              |            ||          | enq: CR - block range reuse ckpt (10)            |
|    |                              |            ||          | reliable message (10)                            |
|  1 |   UPDATE                     | TEST_TABLE ||    91.93 | resmgr:internal state change (1)                 |
|    |                              |            ||          | Cpu (403)                                        |
|    |                              |            ||          | ASM IO for non-blocking poll (3)                 |
|    |                              |            ||          | cell list of blocks physical read (190)          | ★Disk I/O(Read)待ち
|    |                              |            ||          | cell multiblock physical read (3)                |
|    |                              |            ||          | cell single block physical read: flash cache (4) |
|  2 |    TABLE ACCESS STORAGE FULL | TEST_TABLE ||     4.72 | Cpu (21)                                         |
|    |                              |            ||          | cell multiblock physical read (1)                |
|    |                              |            ||          | cell single block physical read: flash cache (9) |
=================================================================================================================
7. まとめ
動的ビュー(GV$SYSSTAT)の統計値から Exadata IORM が動作したことを確認しました。
AWRレポートやリアルタイムSQL監視レポートからも確認できると便利なんですが、本ケースではそちらでは確認できませんでした。
ADB-S で Disk I/O待ちが長くなっているケースでは、IORM による制御を確認してみても良いかもしれません。
彡(^)(^)