はじめに
-
Prometheusの特に__Alertmanager__を試したくて今回構築しました
-
VPSやメール配信サービスも含めて申込からはじめるというほぼゼロスタートです
- 申込方法や外部サービスの設定は割愛します
環境
Prometheusなどのバージョン
- prometheus-1.7.1.linux-amd64
- node_exporter-0.14.0.linux-amd64
- alertmanager-0.7.1.linux-amd64
サーバ
-
DTI ServersMan@VPS
- CentOS 7 (64bit)
- HDD:50GB
- メモリ:1GB
理由:
- 安くてrootが使えるため。
メール送信
-
SendGrid
- プラン:シンプル
- SMTP
理由:
SSHクライアント
理由:
- iOSで使えるため。
- 最初はLite(無料)でしたがセッションが2個までだったので途中で有料にしました。
作業クライアント
- iPhone7
- Bluetoothキーボード
- ディスプレイとコネクタ
- AirPlay
- Apple純正コネクタ
理由:
- 特に理由はありません。
- ノートPCなど使いやすい環境で大丈夫だと思います。
手順
Prometheus
ダウンロードする
- 適当なディレクトリに移動します
- 置きポンで動くのがいいところです
- 圧縮ファイルをダウンロードします
- 他のバージョンはこちら
$ wget https://github.com/prometheus/prometheus/releases/download/v1.7.1/prometheus-1.7.1.linux-amd64.tar.gz
- 直接ダウンロードできない環境ではインターネットにつながる環境でダウンロードしたファイルをサーバ上に配置します
解凍する
- ダウンロードしたファイルを解凍します
$ tar xvfz prometheus-1.7.1.linux-amd64.tar.gz
- ディレクトリが出来ます
$ ls
prometheus-1.7.1.linux-amd64
prometheus-1.7.1.linux-amd64.tar.gz
設定する
- 出来たディレクトリに移動します
$ cd prometheus-1.7.1.linux-amd64
- 元々ある設定ファイルをバックアップします(念のため)
$ cp prometheus.yml prometheus.yml.bkyyyymmdd
$ ls
prometheus.yml
prometheus.yml.bkyyyymmdd
※ほかのディレクトリやファイルもありますが省略しています
- 元々書いてある内容をすべて消して下記を書きます。
global:
  scrape_interval:    5s

scrape_configs:
  - job_name: 'prometheus'
    static_configs:
    - targets: ['localhost:9090']
とりあえず起動する
- 実行します
- INFOログが数行出てきます
- 最後にリッスンしているポート番号が出てきます
$ ./prometheus -config.file=prometheus.yml
INFO[0000] Starting prometheus (version=1.7.1, branch=master, revision=3afb3fffa3a29c3de865e1172fb740442e9d0133   source="main.go:88"
・・・
INFO[0001] Listening on :9090   source="web.go:259"
確認する
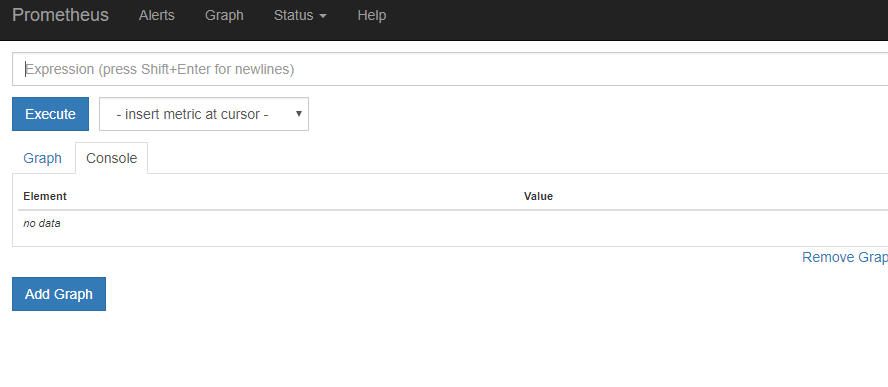
- 先ほどのポートにアクセスします
- 次のような画面が開きます
※インターネットからアクセスできる場合は、localhostの部分をGlocal IPまたはドメイン名に読み替えてください
http://localhost:9090/graph
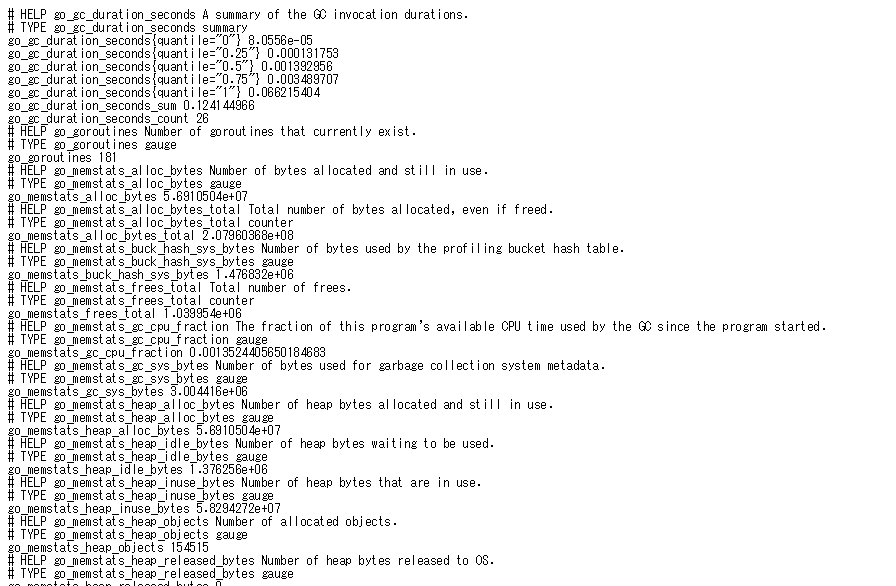
- prometheus本体が収集(?)しているメトリクスは次のURLで確認できます
http://localhost:9090/metrics
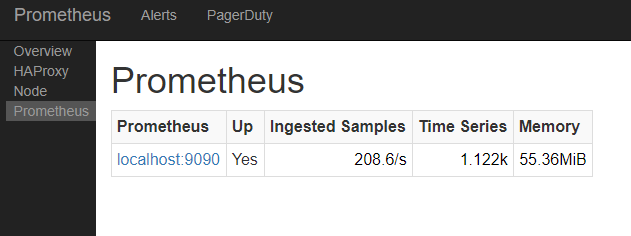
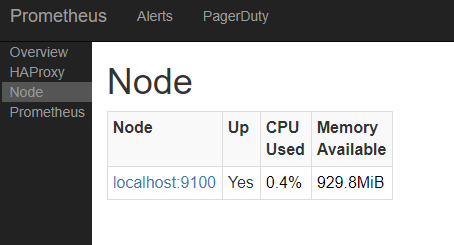
- prometheusやexporterのUPや、メモリ使用率は次のURLで確認できます
- まだ開発途中のようですが十分使えます。
http://localhost:9090/consoles/prometheus.html
停止する
- 起動したセッションで、
Ctrl + cを押します - stoppedのようなINFOログがでます
・・・
INFO[1129] Local storage stopped.   source="storage.go:484"
$
node_exporter
ダウンロードする
- 適当なディレクトリに移動します
- exporterも置きポンです
- 圧縮ファイルをダウンロードします
$ wget https://github.com/prometheus/node_exporter/releases/download/v0.14.0/node_exporter-0.14.0.linux-amd64.tar.gz
解凍する
- ダウンロードしたファイルを解凍します
$ tar xvfz node_exporter-0.14.0.linux-amd64.tar.gz
- ディレクトリが出来ます
$ ls
node_exporter-0.14.0.linux-amd64
node_exporter-0.14.0.linux-amd64.tar.gz
設定する
- prometheusディレクトリに移動します
$ cd ../prometheus-1.7.1.linux-amd64
- 下記をprometheus.ymlのscrape_configs:に追記します
  - job_name: 'node'
    static_configs:
    - targets: ['localhost:9100']
- prometheus.ymlはこうなります
global:
  scrape_interval:    5s

scrape_configs:
  - job_name: 'prometheus'
    static_configs:
    - targets: ['localhost:9090']

  - job_name: 'node'
    static_configs:
    - targets: ['localhost:9100']
とりあえず起動する
- 実行します
- INFOログが数十行出てきます
- 最後にリッスンしているポート番号が出てきます
$ ./node_exporter
INFO[0000] Starting node_exporter (version=0.14.1, branch=master, revision=840ba5dcc71a084a3bc64cb606003c1f94435a6   source="node_exporter.go:140"
・・・
INFO[0000] Listening on :9100   source="node_exporter.go:186
確認する
- 先ほどのポートにアクセスします
- 次のような画面が開きます
http://localhost:9100/metrics
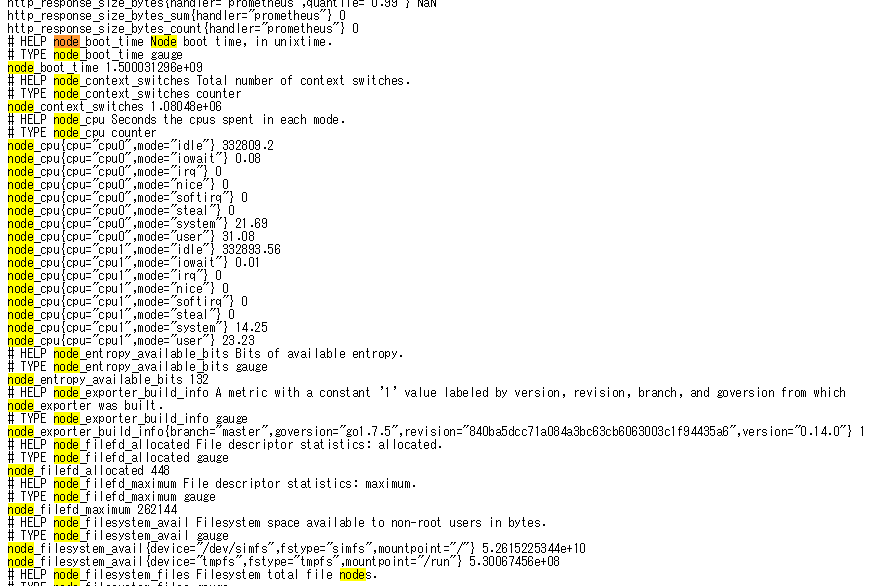
※ prometheusとの違いは、"node_"から始まるメトリクスがあることのようです
- prometheusのconsole画面の左側にnodeとあるのでクリックします
- node_exporterがUPしてるのが分かります
http://localhost:9090/consoles/prometheus.html
停止する
- 起動したセッションで、
Ctrl + cを押します
※ 私の環境ではstoppedのような停止が分かるログは特に出ずにコンソール画面に戻りました。
^C
$
Alertmanager
ダウンロードする
- 適当なディレクトリに移動します
- これもほぼ置きポンです
- 圧縮ファイルをダウンロードします
$ wget https://github.com/prometheus/alertmanager/releases/download/v0.7.1/alertmanager-0.7.1.linux-amd64.tar.gz
- 直接ダウンロードできない環境ではインターネットにつながる環境でダウンロードしたファイルをサーバ上に配置します
解凍する
- ダウンロードしたファイルを解凍します
$ tar xvfz alertmanager-0.7.1.linux-amd64.tar.gz
- ディレクトリが出来ます
$ ls
alertmanager-0.7.1.linux-amd64
alertmanager-0.7.1.linux-amd64.tar.gz
設定する(Alertmanagerの.ymlファイル)
「xx秒の間に来たアラートは同じとみなす」や「1回通知したら次の通知はxx時間後」などはここで設定します。
(個人的にAlertmanagerの一番良い機能だと思っています)
使うメールサーバのアドレスやfromやtoなどもここで設定します。
- 出来たディレクトリに移動します
$ cd alertmanager-0.7.1.linux-amd64
- 元々ある設定ファイルをバックアップします(念のため)
$ cp simple.yml simple.yml.bkyyyymmdd
$ ls
simple.yml
simple.yml.bkyyyymmdd
- 次の内容で修正していきます
- 全て消してこれだけ書いても大丈夫だとは思いますが、まだ私はやっていません
- SendGridを利用しています
global:
  smtp_smarthost: 'smtp.sendgrid.net:587'
  smtp_from: 'aaaaaaa@jibunnodomain.net'
  smtp_auth_name: 'apikey'
  smtp_auth_password: 'xxxxxxxxxxxxxxxxxxxxxxxxxxxxxxxxxxxxxxxxxxx'

templates:
- '/etc/alertmanager/template/*.tmpl'

route:
  group_by: ['alertname', 'cluster', 'service']
  group_wait: 30s
  group_interval: 15m
  repeat_interval: 10m

  receiver: team-Z-mails

inhibit_rules:
- source_match:
    severity: 'critical'
  target_match:
    severity: 'warning'
  equal: ['alertname', 'cluster', 'service']

receivers:
- name: 'team-X-mails'
  email_configs:
  - to: 'xxxxxxx@jibundomain.net'

- name: 'team-Y-mails'
  email_configs:
  - to: 'yyyyyyy@jibundomain.net'

- name: 'team-Z-mails'
  email_configs:
  - to: 'zzzzzzz@taninnodomain.ne.jp'
はまったポイント(SendGrid)
- smtp_authの、'apikey'は 固定文字列(アルファベットで apikey ) です。
- smtp_auth_passwordは、APIキーを作成したときに自動で設定されるとても長い英字の文字列です
- smtp_fromの、@以降は取得したドメインにしましょう。@以前はなんでもいいようです。
設定する(prometheusの.rulesファイル)
アラートを発報するルールはここで設定します。
- prometheusディレクトリに移動します
$ cd ../prometheus-1.7.1.linux-amd64
- 空の.rulesファイルをつくります。
$ touch alerts.rules
$ ls
alerts.rules
- 次の内容で修正していきます
ALERT InstanceDown
  IF up == 0
  FOR 5m
  LABELS { severity = "critical" }
  ANNOTATIONS {
    summary = "Instance {{ $labels.instance }} down",
    description = "{{ $labels.instance }} of job {{ $labels.job }}"
  }
設定する(ルールファイル名を指定する)
- prometheusディレクトリに移動します
$ cd ../prometheus-1.7.1.linux-amd64
- 下記をprometheus.ymlに追記します
rule_files:
  - 'alerts.rules'
- prometheus.ymlはこうなります
global:
  scrape_interval:    5s

rule_files:
  - 'alerts.rules'

scrape_configs:
  - job_name: 'prometheus'
    static_configs:
    - targets: ['localhost:9090']

  - job_name: 'node'
    static_configs:
    - targets: ['localhost:9100']
とりあえず起動する
- 実行します
- INFOログが数行出てきます
- 最後にリッスンしているポート番号が出てきます
$ ./alertmanager -config.file=simple.yml -mesh.peer-id=00:00:00:00:00:00
INFO[0000] Starting alertmanager (version=0.7.1, branch=master, revision=ab4138299b94c8dc554ea96e2ab28d04b048059   source="main.go:109"
・・・
INFO[0000] Listening on :9093   source="main.go:308"
はまったポイント(Alertmanagerが起動しない)
- とりあえず実行したら下記のようなエラーが出て起動できない
$ ./alertmanager -config.file=simple.yml

panic: no valid network interfaces

gorouting 1 [running]:
main.mustHardwareAddr(0xc7f3e0,  0xc4200fal60)
        /go/src/github.com/prometheus/alertmanager/cmd/alertmanager/main.go:477 +0x14f
main.main()
        /go/src/github.com/prometheus/alertmanager/cmd/alertmanager/main.go:97 +0x2748

$
- こちらのページを読んで、仮想サーバはMACAddressを敢えて設定しない事があるからAlertmanagerがMACAddressを一意値として利用しているが取得できていないと解釈(合ってるかはわかりません)
-
-mesh.hardware-addrオプションを付ければよさそうだが、付けてもそのようなオプションはないと - もう少し調べると
-mesh.hardware-addrではなく-mesh.peer-idとのgithubページ を見つける - オプションの引数(String)を何を設定していいかわからないので、とりあえずMACAddressっぽい文字列「00:00:00:00:00:00」を入れる
- 起動成功!
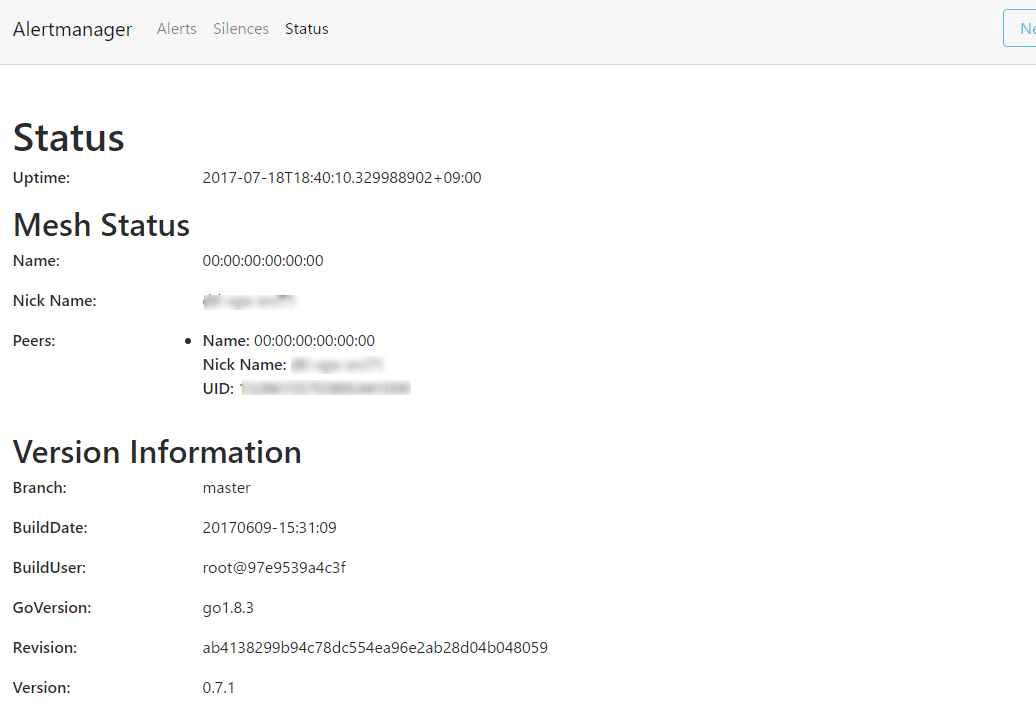
確認する
- 先ほどのポートにアクセスします
- 次のような画面が開きます
http://localhost:9093/#/status
停止する
- 起動したセッションで、
Ctrl + cを押します - exiting grecefullyとmaintenance doneのようなINFOログがでます
・・・
INFO[0173] received SIGTERM, exiting gracefully...   source="main.go:335"
・・・
INFO[0173] maintenance done   component=nflog duration=238.638μs source="nflog.go:286"
$
メール通知できるか確認する
- node_exporter → prometheus → alertmanagerの順で起動します
- prometheusの起動オプションに
-alertmanager.url=http://localhost:9093を追加します
- prometheusの起動オプションに
$ ./node_exporter
$ ./prometheus -config.file=prometheus.yml -alertmanager.url=http://localhost:9093
$ ./alertmanager -config.file=simple.yml -mesh.peer-id=00:00:00:00:00:00
-
prometheusのメニューから次を確認していきます
-
Status>Targetsを確認します
http://localhost:9090/targets
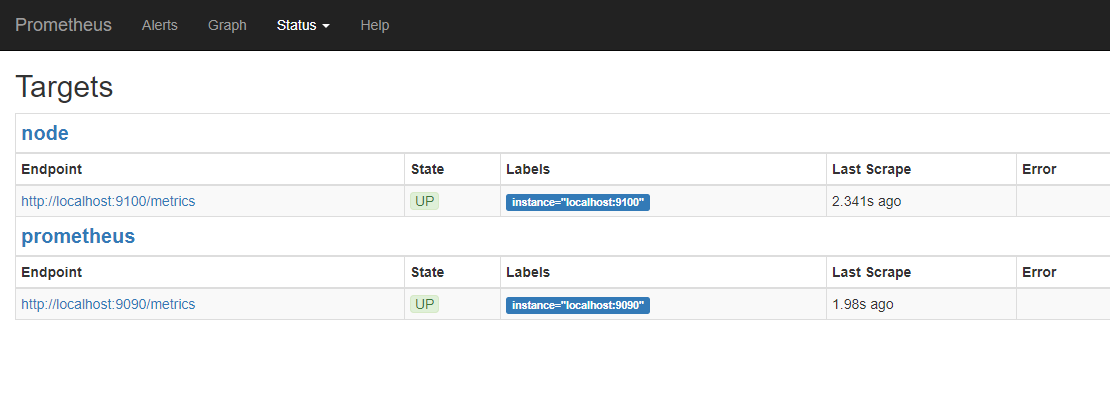
※ UPしてます
- Status>Rulesを確認します
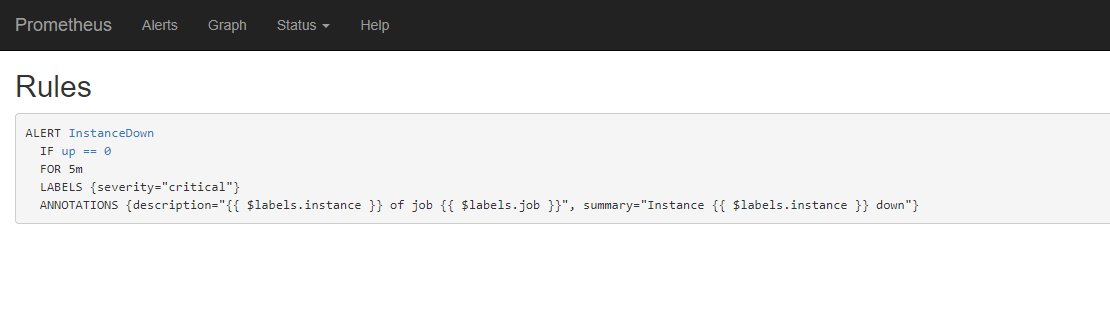
※ 設定したruleが書かれています
- Alertsを確認します
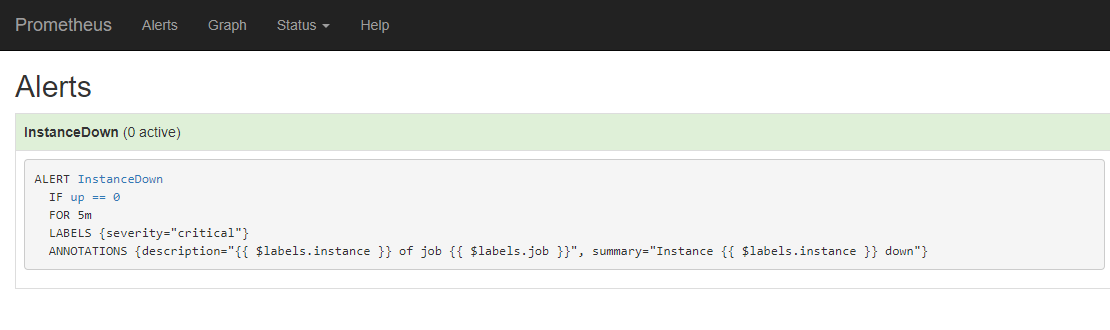
※ 緑色で InstanceDown は 0 active です
- node_exporterだけ停止します
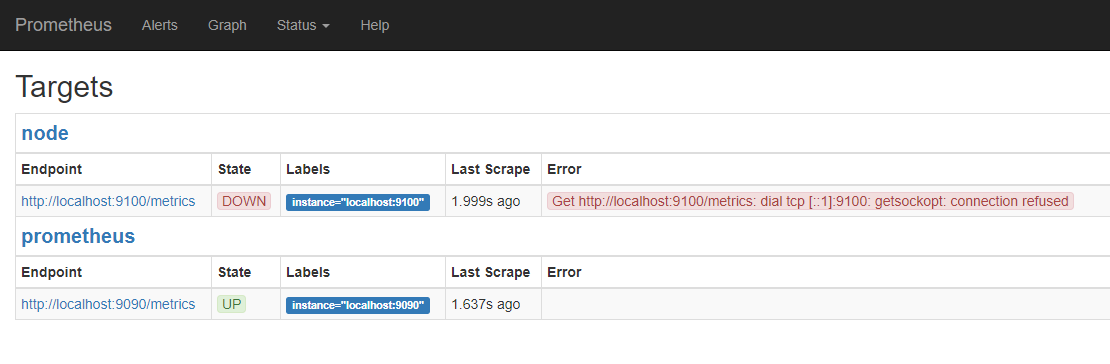
※ DOWNしました!
- 再度、Alertsを確認します
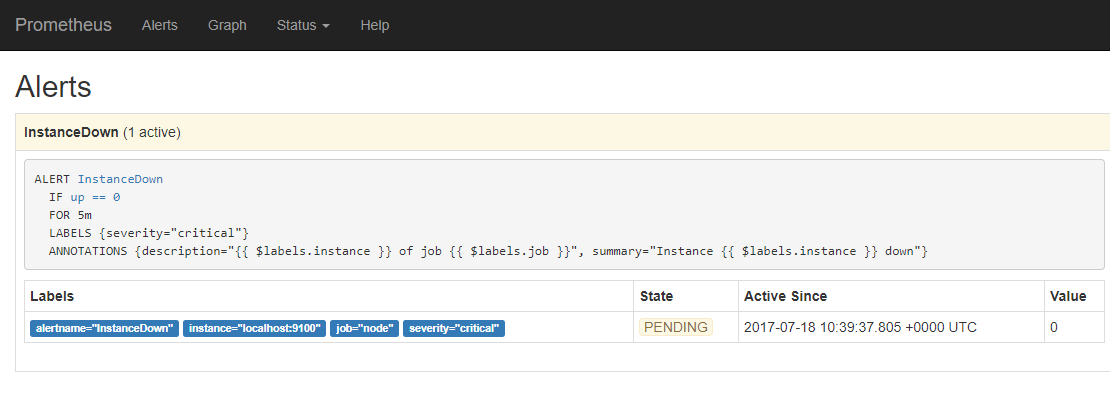
※ Statusは PENDING です
※ DOWNしたことは検知していますが、通知はgroup_intervalで設定したとおり5分待っている状態です。えらい!
- 5分後にAlertsを確認します
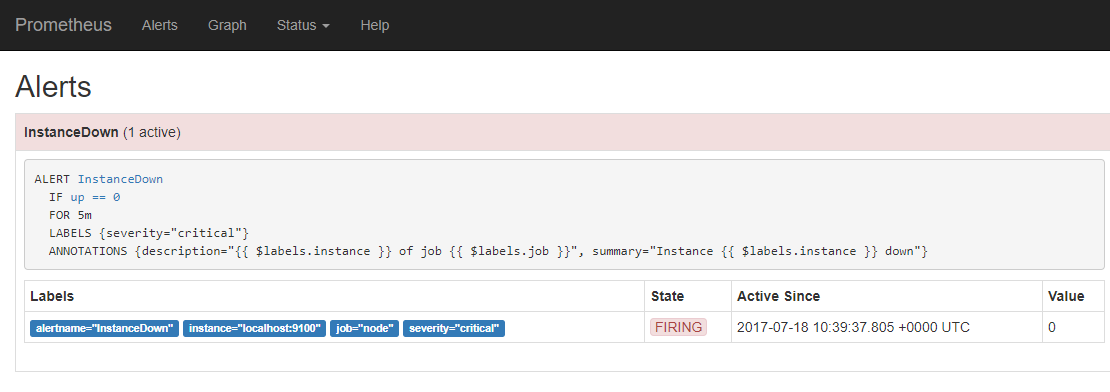
※ Statusが FIRING に変わりました!
- 通知メールの受信を確認します
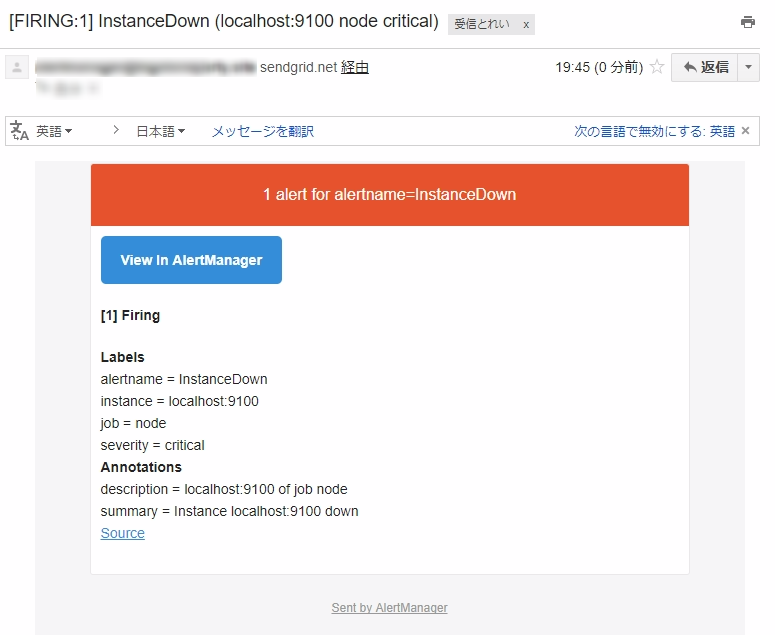
※ メールを受信しました!!!
- しばらくして再度通知メールの受信を確認します
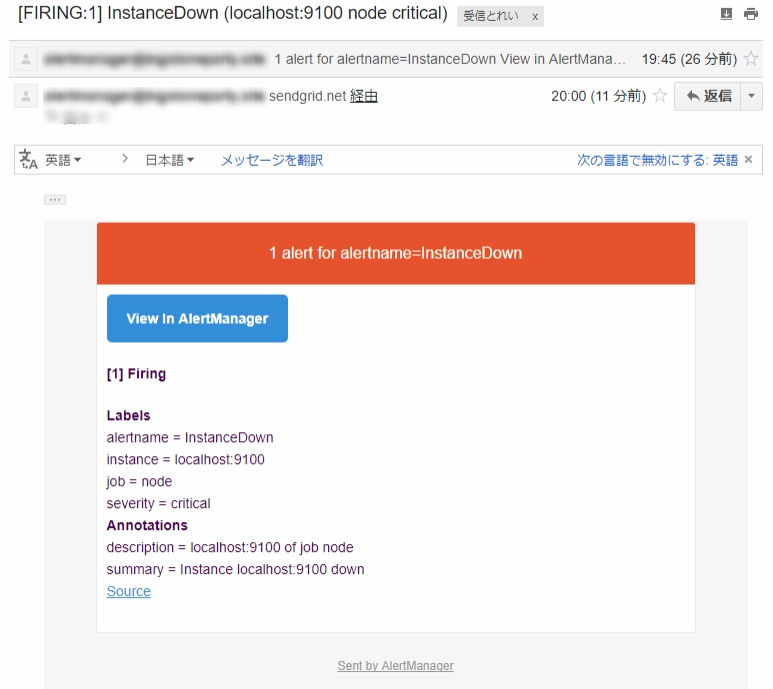
※ 2通目のメールを受信しました!!!
※ repeat_intervalに設定したとおり、10分後(group_interval=5分を加えて15分後?)に受信しました!!!
おわりに
-
ほぼ置きポンでここまでいきつけるのがとても好印象です
-
Prometheus周りで大きくハマることも少なかったです
-
特にAlertmanagerがよく考えられてて、システム運用を長年やってきた者としてもっと使っていきたいと思いました
-
テキストログの監視ができるようになればな、と思いました
- 動画で「metrics, not logs.」と説明されてたので、自分で対応するしかないと思ってます。情報あればほしいところです。
-
正直、私はあまりこういう構築系はやってきませんでした
- Linuxコマンド(wgetやvimの使い方)をGoogleで調べながら進めています
- そんな自分でも3~4日くらいでできました!
参考情報
- Prometheus.io - Getting Started
- Monitoring a Machine with Prometheus: A Brief Introduction
- Keynote: Prometheus: From Berlin to Bonanza - Brian Brazil, CEO, Robust Perception
- 次世代監視の大本命! Prometheus を実運用してみた
- 長生村本郷Engineers'Blog - Alertmanager 構築手順
- 1.0が出てたのでPrometheusに入門してみた
ほんとうに参考になりました。感謝いたします。