
1. pgbenchの概要
1.1 pgbenchとは
PostgreSQLに同梱されているベンチマークツールです。設定を変えてみて、対象の環境での性能比較や、環境を変えてみて、同一条件で性能評価を実施するためのツールです。
実施できることの代表的なことを表にまとめてみました。
| 概要 | 説明 |
|---|---|
| TPS 計測 | 1秒あたりのトランザクション数を計測。設定変更の効果を数値で示せる。 |
| 同時接続シミュレーション | 複数クライアントが同時アクセスする負荷を再現できる。 |
| カスタムスクリプト | 独自の SQL シナリオファイルを使って、実業務に近い負荷を再現できる。 |
| 詳細な統計出力 | レイテンシ・標準偏差・進捗ログなど豊富なメトリクスを出力できる。 |
1.2 試しに実行してみる
# テスト用「pgbench_test」データベースを作成する
$ sudo -u postgres createdb pgbench_test

# テーブル作成とデータを投入する
$ sudo -u postgres pgbench -i -s 1 pgbench_test
dropping old tables...
NOTICE:  table "pgbench_accounts" does not exist, skipping
NOTICE:  table "pgbench_branches" does not exist, skipping
NOTICE:  table "pgbench_history" does not exist, skipping
NOTICE:  table "pgbench_tellers" does not exist, skipping
creating tables...
generating data (client-side)...
100000 of 100000 tuples (100%) done (elapsed 0.11 s, remaining 0.00 s)
vacuuming...
creating primary keys...
done in 0.23 s (drop tables 0.00 s, create tables 0.01 s, client-side generate 0.13 s, vacuum 0.05 s, primary keys 0.05 s).

# 作成済みのテーブルを表示
$ sudo -u postgres psql -d pgbench_test -c "\dt"
              List of relations
 Schema |       Name       | Type  |  Owner
----------------------------------------------
 public | pgbench_accounts | table | postgres
 public | pgbench_branches | table | postgres
 public | pgbench_history  | table | postgres
 public | pgbench_tellers  | table | postgres
(4 rows)
これで、テーブル作成・データ投入ができたので、実際に入っているデータを確認してみましょう。
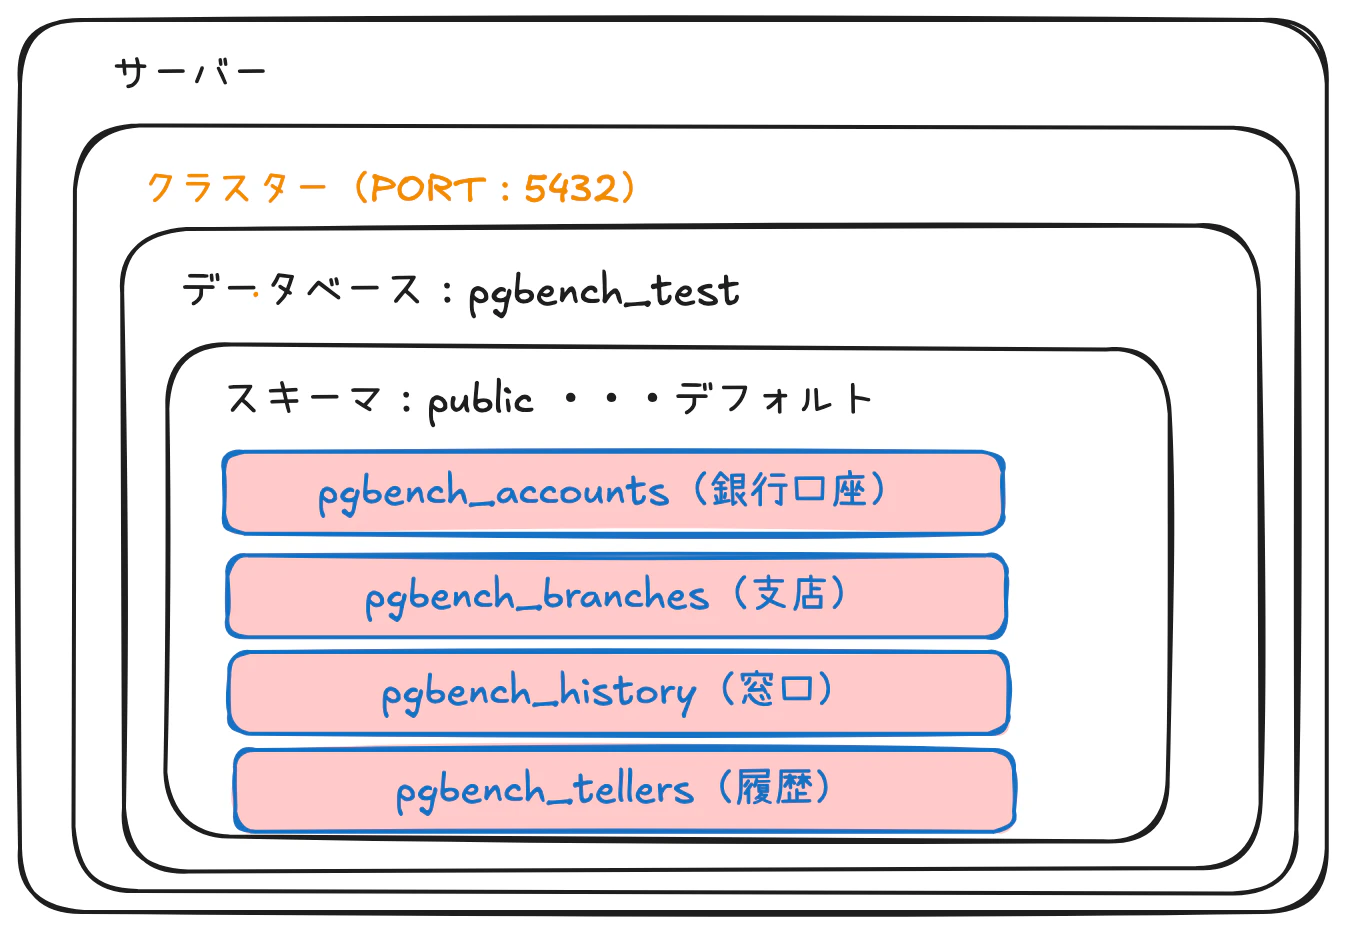
| テーブル物理名称 | 説明 |
|---|---|
| pgbench_accounts | 銀行口座 |
| pgbench_branches | 支店テーブル |
| pgbench_history | 履歴テーブル |
| pgbench_tellers | 窓口テーブル |
試しに銀行口座の中身を10件だけ確認してみます。
$sudo -u postgres psql pgbench_test
psql (16.12)
Type "help" for help.

pgbench_test=#SELECT * FROM public.pgbench_accounts limit 10;
 aid | bid | abalance |                                        filler
 ---------------------------------------------------------------------
   1 |   1 |        0 |
   2 |   1 |        0 |
   3 |   1 |        0 |
   4 |   1 |        0 |
   5 |   1 |        0 |
   6 |   1 |        0 |
   7 |   1 |        0 |
   8 |   1 |        0 |
   9 |   1 |        0 |
  10 |   1 |        0 |
(10 rows)
「pgbench_test」のデータベースに、「public」スキーマがあって、「pgbench_accounts」にデータが入っていることが確認できます。
1.3 テーブルの情報
各テーブルの項目を一覧かしてみました。ちなみにfilterは、「試験用に各行のデータ量を増やして」実際の運用で使われるデータ量に近づけているみたいです。
💰 pgbench_accounts(銀行口座)
| カラム名 | データ型 | NOT NULL | 説明 |
|---|---|---|---|
| aid | integer | ✓ | 口座ID(主キー) |
| bid | integer | 支店ID | |
| abalance | integer | 口座残高 | |
| filler | character(84) | パディング用ダミー列 |
🏦 pgbench_branches(支店テーブル)
| カラム名 | データ型 | NOT NULL | 説明 |
|---|---|---|---|
| bid | integer | ✓ | 支店ID(主キー) |
| bbalance | integer | 支店残高 | |
| filler | character(88) | パディング用ダミー列 |
👨💼 pgbench_tellers(窓口テーブル)
| カラム名 | データ型 | NOT NULL | 説明 |
|---|---|---|---|
| tid | integer | ✓ | 窓口ID(主キー) |
| bid | integer | 支店ID | |
| tbalance | integer | 窓口残高 | |
| filler | character(84) | パディン用ダミー列 |
📚 pgbench_history(トランザクション履歴テーブル)
| カラム名 | データ型 | NOT NULL | 説明 |
|---|---|---|---|
| tid | integer | 窓口ID | |
| bid | integer | 支店ID | |
| aid | integer | 口座ID | |
| delta | integer | 残高変動額 | |
| mtime | timestamp | トランザクション日時 | |
| filler | character(22) | パディング用ダミー列 |
2. ベンチマーク
それでは処理速度とかを計測してみましょう。
2.1 実行してみる
ベンチマークを実行してみます。
# オプションとかは後で解説
# 同時クライアント数が10、スレッド数が2、実行時間が60秒の試験を「pgbench_test」データーベースに対して実行
$ sudo -u postgres pgbench -c 10 -j 2 -T 60 pgbench_test
pgbench (16.12)
starting vacuum...end.
transaction type: <builtin: TPC-B (sort of)>
scaling factor: 1
query mode: simple
number of clients: 10
number of threads: 2
maximum number of tries: 1
duration: 60 s
number of transactions actually processed: 45617
number of failed transactions: 0 (0.000%)
latency average = 13.139 ms
initial connection time = 77.175 ms
tps = 761.074115 (without initial connection time)
2.2 結果の内容:実行条件
まずは、実行した結果が表示されます。
| 項目 | 値 | 説明 |
|---|---|---|
| pgbench バージョン | 16.12 | PostgreSQL 本体と同バージョン |
| transaction type | builtin: TPC-B (sort of) | デフォルトの銀行窓口業務シナリオ |
| scaling factor | 1 | データ量の倍率(accounts が 10万行) |
| query mode | simple | 単純クエリプロトコル(拡張なし) |
| maximum number of tries | 1 | デッドロック時のリトライなし |
2.3 負荷設定
| 項目 | 値 | 説明 |
|---|---|---|
| number of clients | 10 | 同時接続クライアント数(-c 10) |
| number of threads | 2 | ワーカースレッド数(-j 2) |
| duration | 60 s | 実行時間(-T 60) |
2.4 計測結果
| 指標 | 値 | 評価 |
|---|---|---|
| transactions processed | 45,617 | 60秒間に処理できたトランザクション総数 |
| failed transactions | 0 (0.000%) | デッドロック・直列化エラーなし。正常 |
| latency average | 13.139 ms | クライアント視点の平均応答時間 |
| initial connection time | 77.175 ms | 接続確立にかかった時間(計測対象外) |
| tps | 761.07 | 1秒あたりのトランザクション数(メイン指標) |
2.5 まとめ
Amazon Linux 2023 & PostgreSQL 16の初期インストールで、インスタンスタイプが、「t3.micro」で実行した結果です。
ここから、postgresql.confを変更したりして、色々結果を見ていっていきたいです。具体的にはshared_bufferやwork_mem、その他のチューニング項目を変更してみて、結果がかわるかと見て行きたいです。
次回以降は、そのあたりをまとめてみます。