様々な補間法と最小2乗法をPythonで理解する のうち、「Numpy.polyfit を使ったカーブフィッティング」を、実データっぽい模擬データを解析するように書き直したサンプルプログラムです。
実データっぽい模擬データ
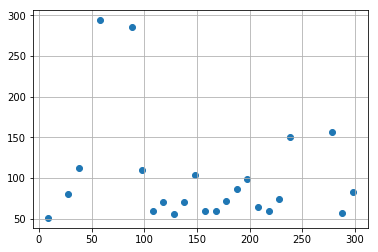
こういうデータを多項式近似したいとしましょう。
x_observed = [9, 28, 38, 58, 88, 98, 108, 118, 128, 138, 148, 158, 168, 178, 188, 198, 208, 218, 228, 238, 278, 288, 298]
y_observed = [51, 80, 112, 294, 286, 110, 59, 70, 56, 70, 104, 59, 59, 72, 87, 99, 64, 60, 74, 151, 157, 57, 83]
まずはデータの図示
こういうデータですね。
%matplotlib inline
import matplotlib.pyplot as plt

plt.scatter(x_observed, y_observed)
plt.grid()
フィッティンブカーブを描く x 座標を作る
実データの最小値から最大値までの間に等間隔に100ポイント作りました。
import numpy as np
x_latent = np.linspace(min(x_observed), max(x_observed), 100)
Numpy.polyfit を用いた最小二乗法
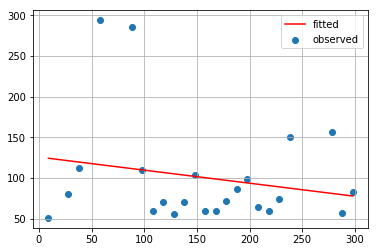
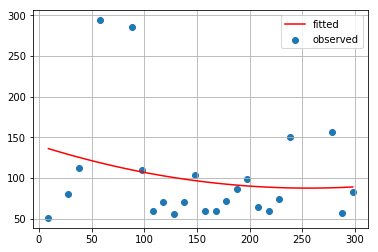
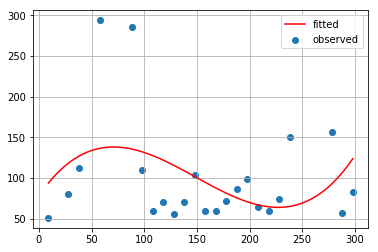
たとえば1次式から9次式までフィッティングしてみましょう。
cf1 = ["最小2乗法(1次式)", lambda x, y: np.polyfit(x, y, 1)]
cf2 = ["最小2乗法(2次式)", lambda x, y: np.polyfit(x, y, 2)]
cf3 = ["最小2乗法(3次式)", lambda x, y: np.polyfit(x, y, 3)]
cf4 = ["最小2乗法(4次式)", lambda x, y: np.polyfit(x, y, 4)]
cf5 = ["最小2乗法(5次式)", lambda x, y: np.polyfit(x, y, 5)]
cf6 = ["最小2乗法(6次式)", lambda x, y: np.polyfit(x, y, 6)]
cf7 = ["最小2乗法(7次式)", lambda x, y: np.polyfit(x, y, 7)]
cf8 = ["最小2乗法(8次式)", lambda x, y: np.polyfit(x, y, 8)]
cf9 = ["最小2乗法(9次式)", lambda x, y: np.polyfit(x, y, 9)]
Sympy を用いた数式の表示の準備
Sympy の使い方は 微分や微分方程式をPythonで理解する などを参考にしていただければと。
import sympy as sym
from sympy.plotting import plot
sym.init_printing(use_unicode=True)

x, y = sym.symbols("x y")
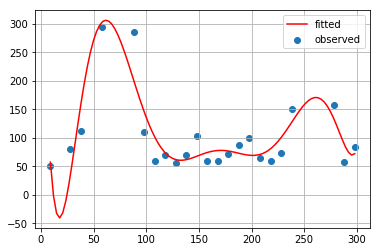
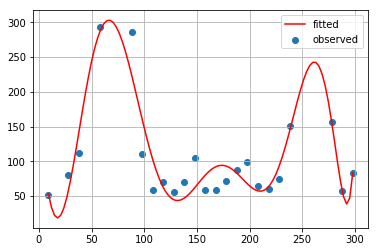
最小二乗法によるカーブフィッティング(1次式から9次式まで)
数式の表示とグラフの表示を一気に行います。
for method_name, method in [cf1, cf2, cf3, cf4, cf5, cf6, cf7, cf8, cf9]:
    print(method_name)
    # 係数の計算
    coefficients = method(x_observed, y_observed)

    # Sympy を用いた数式の表示
    expr = 0
    for index, coefficient in enumerate(coefficients):
        expr += coefficient * x ** (len(coefficients) - index - 1)
    display(sym.Eq(y, expr))

    # プロットと曲線の表示
    fitted_curve = np.poly1d(method(x_observed, y_observed))(x_latent)
    plt.scatter(x_observed, y_observed, label="observed")
    plt.plot(x_latent, fitted_curve, c="red", label="fitted")
    plt.grid()
    plt.legend()
    plt.show()
最小2乗法(1次式)
最小2乗法(2次式)
最小2乗法(3次式)
最小2乗法(4次式)
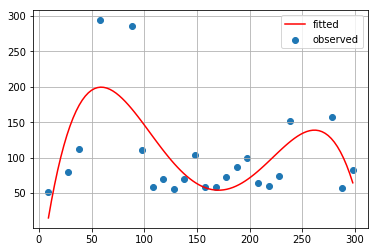
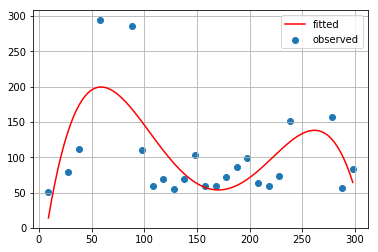
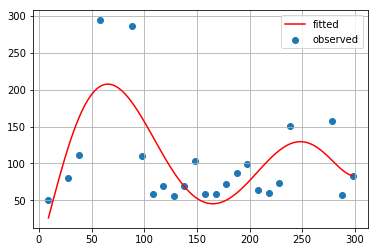
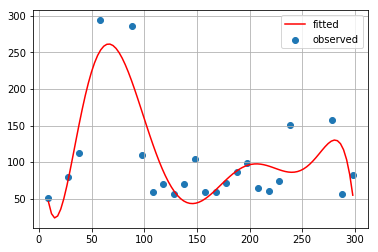
最小2乗法(5次式)
最小2乗法(6次式)
最小2乗法(7次式)
最小2乗法(8次式)
最小2乗法(9次式)
参考
Scipy.interpolate を使った様々な補間法もご参考にどうぞ。
