はじめに
もともと、IBM Qレプリケーション(QREP)についていろいろと触っている中、同IBM社のAPM(Application Performance Management)製品である、InstanaでQREPの情報を監視できるのかを確認したところ、QREP自体を直接サポートするセンサーは現時点では提供されていませんでした。そのため、まずは関連するIBM DB2やIBM MQの情報をモニタリングできるか試してみました。
Instanaエージェントのパッケージをダウンロード
InstanaのUIにログインできるという前提で進めます。
参考:エージェントのダウンロード
-
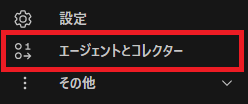
Instana UI のホーム画面上部の「エージェントまたはコレクターをインストール」をクリックします。(もしくは左のメニューバーから「エージェントとコレクター」をクリックします。

-
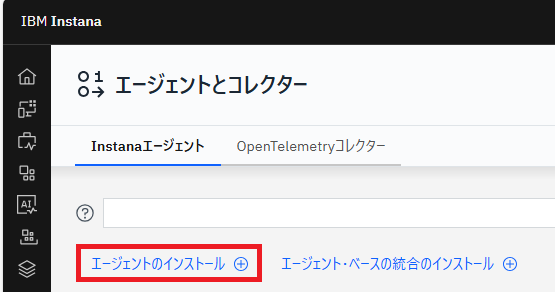
「エージェントのインストール」をクリックします。
-
Linux アーカイブ(tar.gz)をクリックします。

-
オプションは特に変更せずにダウンロードします。(下矢印マークをクリック)

Instanaエージェントのインストール
環境:Linux(RedHat)
rootユーザで実施
ダウンロードしたアーカイブ・ファイルをサーバーに転送します。
今回は/optに配置(パッケージ:instana-agent-linux-64bit.tar.gz)
ダウンロードしたアーカイブ・ファイルを解凍する。
# tar -xvzf instana-agent-linux-64bit.tar.gz
以下のディレクトリが存在していることを確認します。
drwxr-xr-x. 8 root root 176 10月 15 05:01 instana-agent
ディレクトリの中を確認します。
# ls -l instana-agent
合計 252
-rw-r--r--. 1 root root   9014 10月 15 05:01 LICENSE
-rw-r--r--. 1 root root    886 10月 15 05:01 README
-rw-r--r--. 1 root root 190461 10月 15 05:01 THIRD_PARTY.csv
-rw-r--r--. 1 root root  16303 10月 15 05:01 THIRD_PARTY_LICENSES
-rw-r--r--. 1 root root      8 10月 15 05:01 VERSION
drwxr-xr-x. 2 root root    160 10月 15 05:01 bin
drwxr-xr-x. 3 root root     17 10月 15 05:01 data
drwxr-xr-x. 4 root root   4096 10月 22 21:40 etc
drwxr-xr-x. 6 root root    109 10月 22 21:40 lib
drwxr-xr-x. 2 root root  20480 10月 15 05:01 licenses
drwxr-xr-x. 5 root root     38 10月 15 05:01 system
JDKの配置
稼働前提である、JDKが必要のため、エージェント導入ディレクトリ配下にJDKを配置するかリンクさせる必要があるため、インストールしたSemeruJDKをリンクします。
# ln -s /opt/IBM/jdk-21.0.8+9 /opt/IBM/instana-agent/jvm
# ls -l /opt/IBM/instana-agent/
合計 256
-rw-r--r--. 1 root root   9014 10月 15 05:01 LICENSE
-rw-r--r--. 1 root root    886 10月 15 05:01 README
-rw-r--r--. 1 root root 190461 10月 15 05:01 THIRD_PARTY.csv
-rw-r--r--. 1 root root  16303 10月 15 05:01 THIRD_PARTY_LICENSES
-rw-r--r--. 1 root root      8 10月 15 05:01 VERSION
-rw-r--r--. 1 root root      4 11月  7 09:08 agent.pid
drwxr-xr-x. 2 root root    160 10月 29 23:12 bin
drwxr-xr-x. 7 root root     78 11月  7 09:08 data
drwxr-xr-x. 4 root root   4096 10月 24 19:31 etc
lrwxrwxrwx. 1 root root     21 10月 24 19:22 jvm -> /opt/IBM/jdk-21.0.8+9
drwxr-xr-x. 6 root root    109 10月 22 21:40 lib
drwxr-xr-x. 2 root root  20480 10月 15 05:01 licenses
-rw-r--r--. 1 root root      0 10月 22 21:58 lock
drwxr-xr-x. 5 root root     38 10月 15 05:01 system
Instanaエージェント起動
# /opt/IBM/instana-agent/bin/start
Skipping the memory calculator: cannot retrieve the maximum amount of memory to be used by the agent from /sys/fs/cgroup/memory/memory.limit_in_bytes .
The memory calculator has not been used, and neither the 'JAVA_MAX_MEM' nor 'JAVA_OPTS' environment variables specify a maximum heap setting; setting the maximum heap to 160m.
「メモリ計算機をスキップしました:エージェントが使用する最大メモリ量を /sys/fs/cgroup/memory/memory.limit_in_bytes から取得できません。
メモリ計算機は使用されておらず、JAVA_MAX_MEM または JAVA_OPTS 環境変数にも最大ヒープサイズの指定がないため、最大ヒープサイズを160MBに設定します。」
/sys/fs/cgroup/memory/memory.limit_in_bytes は、Linuxのcgroupでメモリ制限を確認するためのファイルであり、そのファイルが存在しないため、デフォルト値の160MBが設定されるという警告のようです。
今回は無視します。
エージェントの状態を確認
エージェントが管理画面に追加されていることを確認してみます。
管理画面の左側のメニューから「エージェントとコレクター」をクリックし、表示された画面下部の「エージェントの詳細」に対象のエージェントが表示されていることを確認します。

「状況」が「報告中」のステータスとなっていれば、エージェントは正常に稼働しているようです。
性能情報を取得してみる
Qレプリケーションの性能取得ができればよかったのですが、どうにもサポートされていないようですので、代わりにIBM MQやIBM Db2のモニタリングで代用できないかを試してみます。
IBM Db2のモニタリング
1. IBM Db2センサーの設定
下記のyamlファイルを編集します。
/opt/IBM/instana-agent/etc/instana/configuration.yaml
・・・前略・・・
# DB2
#com.instana.plugin.db2:
#  # Local monitoring configuration
#  local: # multiple local configurations supported
#    - instance: 'db2inst1'
#      port: '50000'
#      user: 'db2inst1'
#      password: 'password'   ★←ここを実際のdb2inst1ユーザのパスワードに書き換え
#      accessTokenType: 'JWT' #If enabled, password field takes token value as password instead of plain text. So, please enable this only for token authentication.
#      poll_rate: 5 # seconds
#      # TLS configuration
#      sslTrustStorePassword: 'password'
#      sslTrustStoreLocation: '/path/to/clientTrustStore.jks'
#      custom_polling:
#        disabled_metrics:
#          metrics: #comma separated list of stats that should not be monitored
#        poll_rate_1:
#          poll_interval: 30 #seconds
#          metrics: TABLE_SPACE_STATS, TOP_QUERIES_STATS
#        poll_rate_2:
#          poll_interval: 200 #seconds
#          metrics: TOP_TOTAL_STMT_IDS_STATS, LOG_DISK_WAIT_STATS, AGENT_STATS, ELAPSED_TIME_STATS, WORKLOAD_STATS
#        poll_rate_3:
#          poll_interval: 900 #seconds
#          metrics: DB_CONFIG_STATS, VMON_LOCK_STATS, HADR_STATS, UNIT_OF_WORK_STATS
#        poll_rate_4:
#          poll_interval: 2000 #seconds
#          metrics: DBM_CONFIG_STATS
#      databases:
#        - 'database1'
#        - 'database2'
#        - 'database3'
#        - 'database4'
・・・中略・・・
#  # Remote monitoring configuration
#  remote: # multiple remote configurations supported
#    - host: 'remote.host-1.com'
#      port: '50000'
#      tabschema: 'SYSTOOLS'
#      user: 'db2inst1'
#      password: 'db2inst1'
#      accessTokenType: 'JWT' #If enabled, password field takes token value as password instead of plain text. So, please enable this only for token authentication.
#      sslTrustStorePassword: 'password'
#      sslTrustStoreLocation: '/path/to/clientTrustStore.jks'
#      availabilityZone: 'DB2 Remote Monitoring'
#      poll_rate: 5 # seconds
#      custom_polling:
#        disabled_metrics:
#          metrics: #comma separated list of stats that should not be monitored
#        poll_rate_1:
#          poll_interval: 30 #seconds
#          metrics: TABLE_SPACE_STATS, TOP_QUERIES_STATS
#        poll_rate_2:
#          poll_interval: 200 #seconds
#          metrics: TOP_TOTAL_STMT_IDS_STATS, LOG_DISK_WAIT_STATS, AGENT_STATS, ELAPSED_TIME_STATS, WORKLOAD_STATS
#        poll_rate_3:
#          poll_interval: 900 #seconds
#          metrics: DB_CONFIG_STATS, VMON_LOCK_STATS, HADR_STATS, UNIT_OF_WORK_STATS
#        poll_rate_4:
#          poll_interval: 2000 #seconds
#          metrics: DBM_CONFIG_STATS
#      databases:
#        - 'db'
#        - 'sample'
・・・省略・・・
上記の内容から以下の部分を有効にし、適宜設定値を書き換えて保存します。
# DB2
com.instana.plugin.db2:
  # Local monitoring configuration
  local: # multiple local configurations supported
    - instance: 'db2inst1'
      port: '50000'           ★←ここにDb2の待ち受けポート(db2 get dbm cfg | grep SVCENAMEで確認)
      user: 'db2inst1'
      password: 'password'   ★←ここを実際のdb2inst1ユーザのパスワードに書き換え
      poll_rate: 5 # seconds
      databases:
        - 'database1'     ★←ここを実際のDB名に書き換え
管理画面([エージェントとコレクター]-[対象のホスト名])の下の方にログ出力があるため、エラーが出ていないことを確認します。

| INFO  | 48-13cc83c7c527) | DB2                              | 294 - com.instana.sensor-db2 - 1.0.69 |  | Activating DB2 Sensor
| INFO  | 48-13cc83c7c527) | DB2                              | 294 - com.instana.sensor-db2 - 1.0.69 |  | Activated Sensor: db2inst1:50000/sample
| INFO  | 23-c0882450f663) | Process                          | 285 - com.instana.sensor-process - 1.1.55 |  | Activated Sensor for PID 7490
DB2センサーを有効化と、 DB2インスタンス db2inst1、ポート 50000、データベース sample に対してセンサーが有効化されたことのINFOログが確認できました。
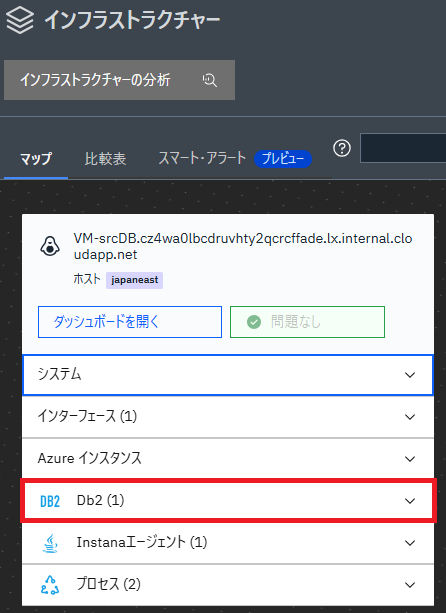
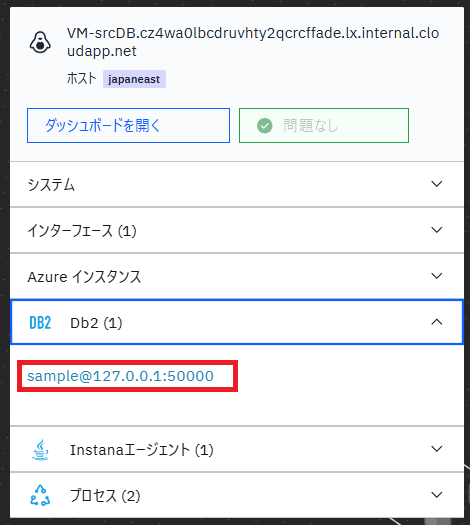
管理画面の左側メニュー「インフラストラクチャー」を確認すると、Db2が追加されていました。
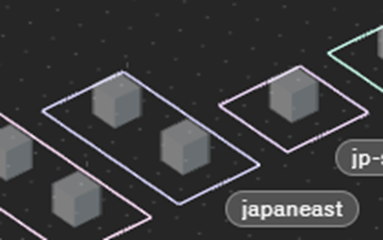
そして特に設定していませんが、アベイラビリティゾーンはjapaneastとなっていました。
今回Azureに作成した環境のため、Azureのインスタンス情報を読み取っているようです。

2. メトリックの表示
Db2の箇所を展開して、確認したい対象をクリックします。
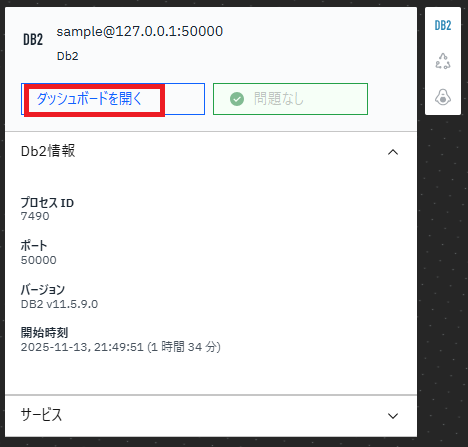
Db2の情報が表示されるため、上部の「ダッシュボードを開く」をクリックします。
接続数やコミット数、ロールバック数などのメトリックが確認できました。
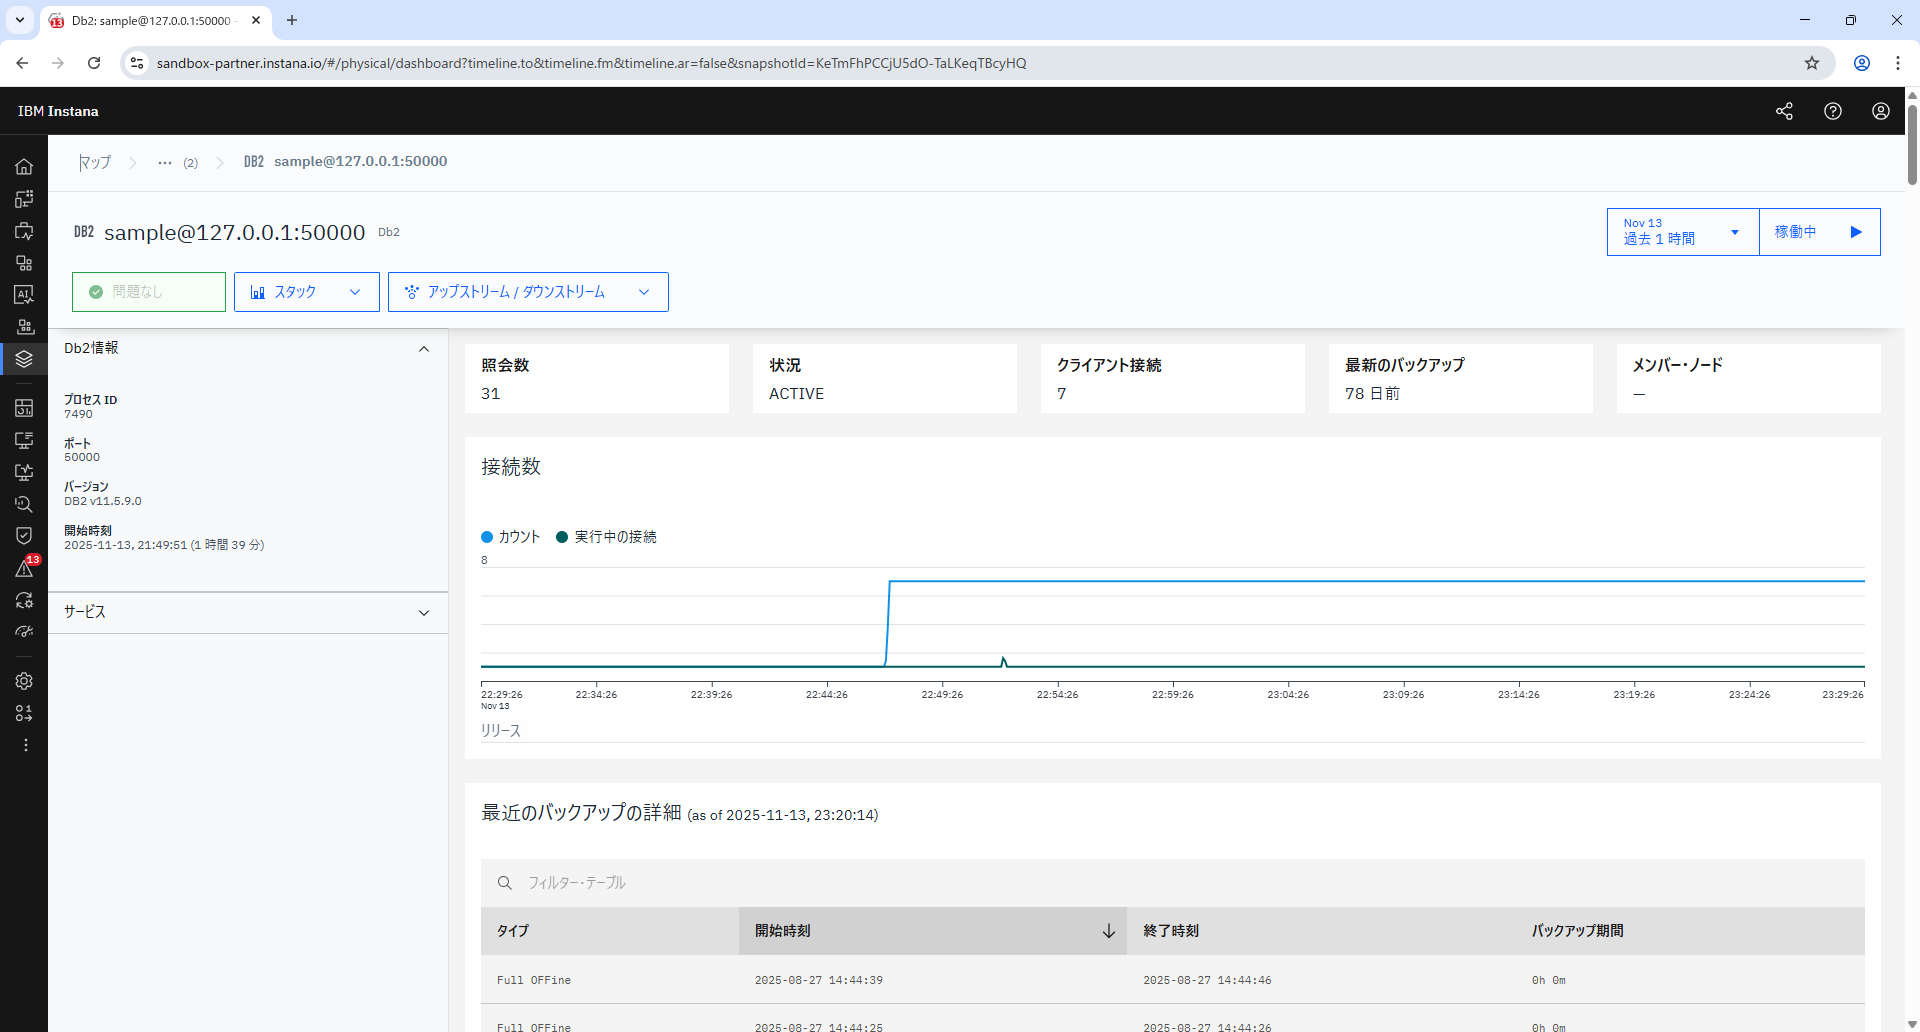
これでDb2の性能情報を確認することができました。もっと細かい設定などもあると思いますが、一旦ここまでとしておきます。
MQのモニタリング ※結果失敗
1. IBM MQセンサーの設定
次の接続モードがサポートされるようです。
・ローカルバインディングモード
・クライアントバインディングモード
ローカルバインディングモードは、MQクライアントを使用せずに、同一マシン上のMQライブラリを直接利用して接続するモードのようです。
一方クライアントバインディングモードは、MQクライアントを使用してTCP/IP経由でMQサーバに接続するモードのようです。
今回はローカルバインディングモードを使用します。
ローカルバインディングモードの場合、IBM MQキュー・マネージャー・インスタンスを自動的に検出してくれて、特にyamlの設定ファイルでの設定は不要とマニュアルには記載ありましたが、管理画面のログではエラーとなってしまいます。
| ERROR | utor-thread-4-12 | IbmMqDataProvider | 287 - com.instana.sensor-ibmmq - 1.1.47 | | Channel null is not defined (2540). Local binding failed. Try client binding connection. But the channel is null
行き詰ってしまいました。
Instana agentユーザー(root)をmqmグループに追加してもダメでした。
MQの方は残念ながら今回は一旦、ここで断念とさせていただきます。
さいごに
MQの方は思うように取得ができませんでしたが、Db2の方はちゃんと確認ができてよかったです。
時間が無かったので一旦断念しましたが、わかり次第更新しようと思います。