フィールド書式のカスタマイズ 記事でも軽く触れましたが、カスタムビジュアルでできることは、Capabilities.json に定義されています。
そこで今回から数回で Capabilities.json の中身を詳しく見ていきます。
Capabilities
GitHub 上にそれぞれの詳細がまとまっています。
Capabilities の中身
Capabilities はカスタムビジュアルのホスト情報を定義します。全てのプロパティは必須ではありません。カスタムビジュアルの capabilities は以下のような構成です。
{
    "dataRoles": [ ... ],
    "dataViewMappings": [ ... ],
    "objects":  { ... },
    "supportsHighlight": true|false,
	"advancedEditModeSupport": 0|1|2
    "sorting": { ... }
}
DataRoles : カスタムビジュアルのデータフィールド定義
データバインド用のフィールド定義には DataViewRole (データロール) の配列を持つ dataRoles を指定します。
プロパティ
- name - 内部的に使う名前 (一意となる値)
-
kind - フィールドの種類:
-
Grouping- メジャー用のグルーピングする列 -
Measure- 数値のデータ列 -
GroupingOrMeasure- grouping また measure
-
- displayName - UI に表示される表示名
- displayNameKey - ローカライズ時に指定する値
- description - 列の説明 (オプション)
- requiredTypes - 列の型。型に合わないデータは null トなる (オプション)
- preferredTypes - データの好ましい型 (オプション)
"requiredTypes" と"preferredTypes" がとれる値
- bool - ブーリアン (true か false)
- integer - 整数
- numeric - ニューメリック
- text - テキスト
- geography - ジオグラフィー
試してみる
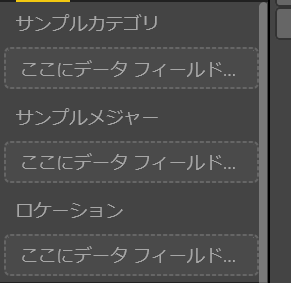
独自のカスタムビジュアルに以下の dataRoles を設定します。
"dataRoles": [
    {
        "displayName": "サンプルカテゴリ",
        "name": "myCategory",
        "kind": "Grouping",
        "requiredTypes": [
            {
                "text": true
            },
            {
                "numeric": true
            },
            {
                "integer": true
            }
        ],
        "preferredTypes": [
            {
                "text": true
            }
        ]
    },
    {
        "displayName": "サンプルメジャー",
        "name": "myMeasure",
        "kind": "Measure",
        "requiredTypes": [
            {
                "integer": true
            },
            {
                "numeric": true
            }
        ],
        "preferredTypes": [
            {
                "integer": true
            }
        ]
    },
    {
        "displayNameKey": "Visual_Location",
        "name": "Locations",
        "kind": "Measure",
        "displayName": "ロケーション",
        "requiredTypes": [
            {
                "geography": {
                    "address": true
                }
            },
            {
                "geography": {
                    "city": true
                }
            },
            {
                "geography": {
                    "continent": true
                }
            },
            {
                "geography": {
                    "country": true
                }
            },
            {
                "geography": {
                    "county": true
                }
            },
            {
                "geography": {
                    "place": true
                }
            },
            {
                "geography": {
                    "postalCode": true
                }
            },
            {
                "geography": {
                    "region": true
                }
            },
            {
                "geography": {
                    "stateOrProvince": true
                }
            }
        ]
    }
]
Power BI 側に表示した場合、上記の定義は以下のフィールドを作成します。
RequiredTypes と型が異なるフィールドをドラッグアンドドラップして、受け付けない点を確認します。
まとめ
データロールがレポートに対して一番初めの入り口となります。ここで型を絞ることで、内部的な処理がより楽になりますので、是非試してください。次回はデータロールからデータにマッピングを行う DataViewMappings を見ていきます。