前回 の記事は Data Roles について見ていきました。今回は DataViewMappings を見ていきます。
情報元: GitHub の DataViewMapping の説明
DataViewMappings : データロールとデータのマッピング定義
DataViewMapping はデータロールに対するデータのマッピングを設定することが出来ます。
多くのビジュアルは 1 だけマッピングを定義していますが、複数の dataViewMappings を定義することも可能です。
"dataViewMappings": [
    {
        "conditions": [ ... ],
        "categorical": { ... },
        "table": { ... },
        "single": { ... },
        "matrix": { ... }
    }
]
conditions
現時点では最小および最大値の設定が出来ます。これはデータロールに指定できるフィールド数を限定します。
メモ: もし DataViewRole で conditions が省略された場合は、任意の数のフィールドを配置できます。制限以上の数のフィールドを配置しようとしても配置できなくなります。
condition の例 1
既定では各ロールに任意の数のフィールドを配置できます。以下の例ではカテゴリは 1 フィールド、メジャーは 2 フィールドまで配置できるように制限します。
"conditions": [
    { "myCategory": { "max": 1 }, "y": { "max": 2 } },
]
condition の例 2
以下の例では 2 つのうち、どちらかの制約を満たす必要があります。
- カテゴリが 1 つでメジャーが 2 つ
- カテゴリが 2 つでメジャーが 1 つ
"conditions": [
    { "myCategory": { "min": 1, "max": 1 }, "myMeasure": { "min": 2, "max": 2 } },
    { "myCategory": { "min": 2, "max": 2 }, "myMeasure": { "min": 1, "max": 1 } }
]
single
single データマッピングは 1 つのメージャーだけ受け取り、合計を返します。フィールドが数値の場合は合計を、他の場合はユニークな値の数を返します。既定のコントロールでは「カード」のイメージです。

定義では、single に対応するデータロール名を指定します。データロールに 2 つ以上のフィールドが配置された場合、値を何も返しません。よって condition と組み合わせて使います。
メモ: single データマッピングは他のマッピング併用できません。
single の例
以下の例は myMeasure データロールに対して 1 つしかフィールドを配置できないよう制約を設定し、かつ single を指定してます。
"dataViewMappings": {
    "conditions": [
        { "myMeasure ": { "max": 1 } }
    ],
    "single": {
        "role": "myMeasure "
    }
}
結果として生成される dataView は、他のプロパティ定義はあるものの single プロパティだけが値を持つため、single 配下の value のみ取得します。
// single データを表示
this.area.selectAll("p")
    .data(options.dataViews)
    .enter()
    .append('p')
    .text((d) => { return d.single.value.toString(); });
categorical
categorical データマッピングはカテゴリとメジャーのデータロールに対してグルーピングを指定します。カテゴリでグルーピングするだけでなく、任意のデータロールでグルーピングを指定することも出来ます。
categorical ではデータロールに対して以下の構文を利用できます。
- for...in - データロールに設定されているフィールドすべての処理
- bind...to - 内容は for...in と同じだが、データロールに 1 しかフィールドを配置しない想定
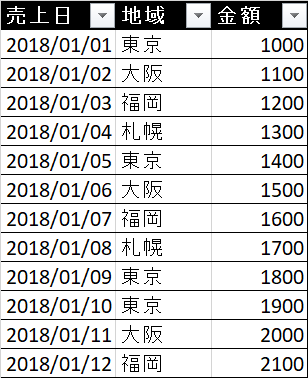
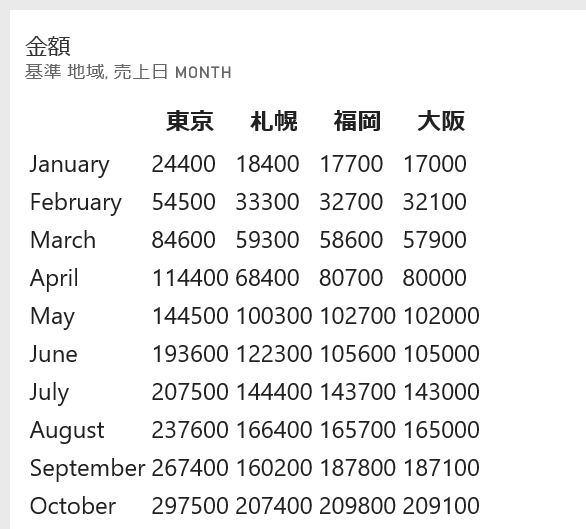
尚、こちらは具体的なデータがあると分かりやすいので、今回は毎月ごとの4地域の売りあげデータを使うことを想定してみます。以下の様に Excel で適当に作った 2018/1/1 から 2018/12/31 まで 4 地域での売り上げデータです。
categorical の例 1
以下の定義では、カテゴリーに配置した各フィールドごとに、値をグルーピングします。
{
    "dataRoles": [
        {
            "displayName": "サンプルカテゴリ",
            "name": "myCategory",
            "kind": "Grouping"
        },
        {
            "displayName": "サンプルメジャー",
            "name": "myMeasure",
            "kind": "Measure"
        }
    ],
    "dataViewMappings": [
        {
            "categorical": {
                "categories": {
                    "for": { "in": "myCategory" }
                },
                "values": {
                    "select": [
                        { "bind": { "to": "myMeasure" } }
                    ]
                }
            }
        }
    ]
}
動作確認
検証には以下の Visual を使います。
module powerbi.extensibility.visual {
    "use strict";

    export class Visual implements IVisual {

        private area: d3.Selection<HTMLElement>
        private table: d3.Selection<HTMLElement>
        private thead: d3.Selection<HTMLElement>
        private tbody: d3.Selection<HTMLElement>
        private host: IVisualHost;
        private settings: VisualSettings;

        constructor(options: VisualConstructorOptions) {
            // カスタムビジュアルを配置しているホストの情報を取得
            this.host = options.host;
            // カスタムビジュアルのエリアを取得
            this.area = d3.select(options.element);
            this.table = this.area.append("table");
            this.thead = this.table.append("thead").append("tr");
            this.tbody = this.table.append("tbody").append("tr");
        }

        public update(options: VisualUpdateOptions) {
            debugger;

            this.thead.selectAll("th").remove();
            this.tbody.selectAll("tr").remove();

            let combinedCategories = [];

            options.dataViews[0].categorical.categories.forEach((category) => {
                category.values.forEach((value, index) => {
                    combinedCategories[index] =
                        combinedCategories[index] == undefined ?
                            value : combinedCategories[index] + value + " ";
                })
            });

            this.thead
                .selectAll("th")
                .data(combinedCategories)
                .enter()
                .append("th")
                .text((value) => { return value.toString(); });

            options.dataViews[0].categorical.values.forEach((values) => {
                this.tbody
                    .selectAll("td")
                    .data(values.values)
                    .enter()
                    .append("td")
                    .text((value) => { return value.toString(); });
            });
        }

        private static parseSettings(dataView: DataView): VisualSettings {
            return VisualSettings.parse(dataView) as VisualSettings;
        }

        public enumerateObjectInstances(options: EnumerateVisualObjectInstancesOptions): VisualObjectInstance[] | VisualObjectInstanceEnumerationObject {
            return VisualSettings.enumerateObjectInstances(this.settings || VisualSettings.getDefault(), options);
        }
    }
}
カテゴリに 1 フィールドのみ配置
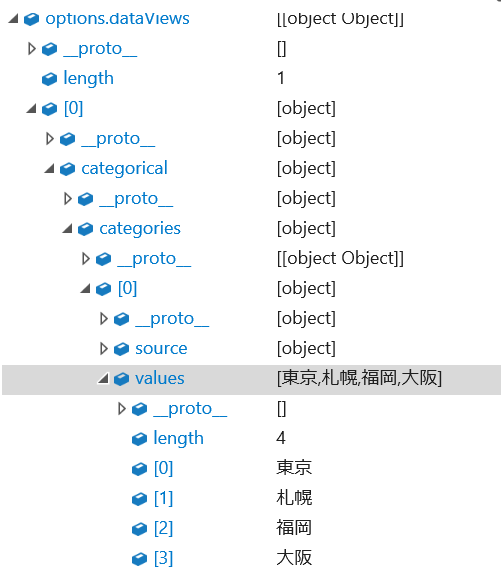
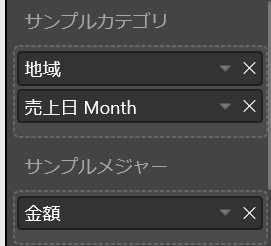
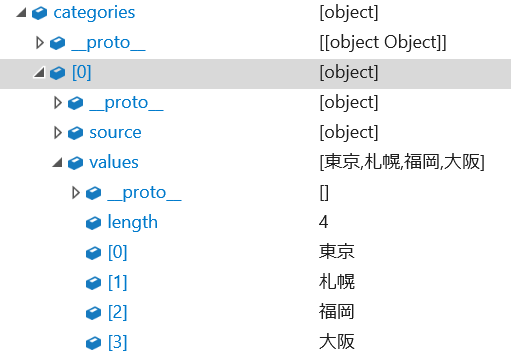
[カテゴリに地域を配置]

[dataView の categories の値]
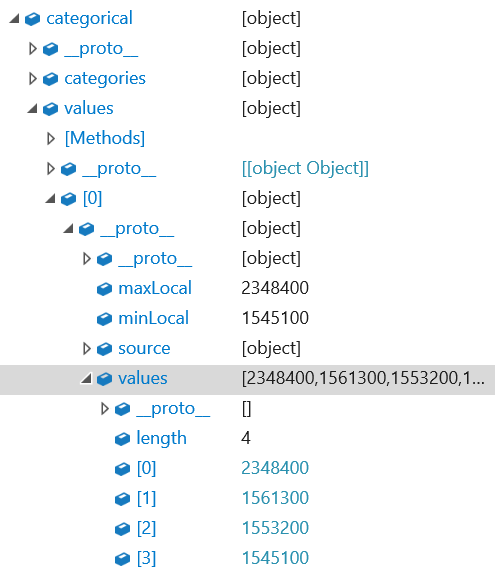
[dataView の values の値]
[レポートの結果]

カテゴリに複数フィールド配置
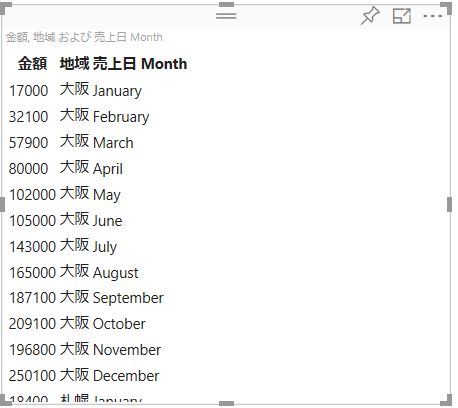
[カテゴリに地域と売上月を配置]
[dataView の categories の値]
地域数 (4)と売上月数 (12) でグルーピングされるため、48 データポイントが生成
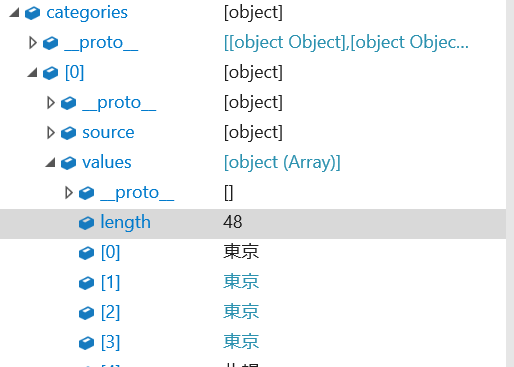
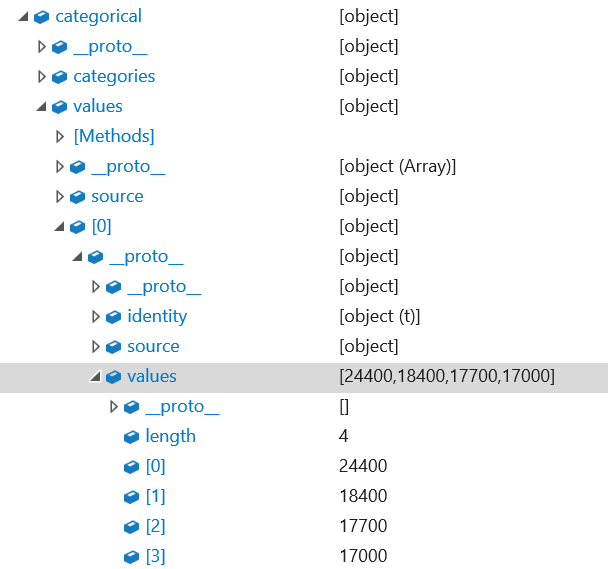
[dataView の values の値]
同じく値も 48 データポイント
[レポートの結果]

categorical の例 2
以下は、カテゴリだけではなく、明示的なデータロールでグルーピングを行う例です。この例では myCategory だけでなく、myGrouping でもグループ化を行います。
{
    "dataRoles": [
        {
            "displayName": "サンプルカテゴリ",
            "name": "myCategory",
            "kind": "Grouping"
        },
        {
            "displayName": "グルーピングフィールド",
            "name": "myGrouping",
            "kind": "Grouping"
        },
        {
            "displayName": "サンプルメジャー",
            "name": "myMeasure",
            "kind": "Measure"
        }
    ],
    "dataViewMappings": [
        {
            "categorical": {
                "categories": {
                    "for": {
                        "in": "myCategory"
                    }
                },
                "values": {
                    "group": {
                        "by": "myGrouping",
                        "select": [
                            {
                                "bind": {
                                    "to": "myMeasure"
                                }
                            }
                        ]
                    }
                }
            }
        }
    ]
}
動作確認
検証には以下の Visual を使います。
module powerbi.extensibility.visual {
    "use strict";

    export class Visual implements IVisual {

        private area: d3.Selection<HTMLElement>
        private table: d3.Selection<HTMLElement>
        private thead: d3.Selection<HTMLElement>
        private tbody: d3.Selection<HTMLElement>
        private host: IVisualHost;
        private settings: VisualSettings;

        constructor(options: VisualConstructorOptions) {
            // カスタムビジュアルを配置しているホストの情報を取得
            this.host = options.host;
            // カスタムビジュアルのエリアを取得
            this.area = d3.select(options.element);
            this.table = this.area.append("table");
            this.thead = this.table.append("thead").append("tr");
            this.tbody = this.table.append("tbody");
        }

        public update(options: VisualUpdateOptions) {
            debugger;

            this.thead.selectAll("th").remove();
            this.tbody.selectAll("tr").remove();

            this.thead
                .selectAll("th")
                .data(options.dataViews[0].categorical.categories[0].values)
                .enter()
                .append("th")
                .text((value) => { return value.toString(); });

            // Add first blank header
            this.thead.insert("th", ":first-child");

            options.dataViews[0].categorical.values.forEach((values) => {

                let tr = this.tbody.append("tr");

                tr.selectAll("td")
                .data(values.values)
                .enter()
                .append("td")
                .text((value) => {
                    return value.toString(); });

                tr.insert("td",":first-child").text(() => { return values.source.groupName.toString() });
            });
        }

        private static parseSettings(dataView: DataView): VisualSettings {
            return VisualSettings.parse(dataView) as VisualSettings;
        }

        public enumerateObjectInstances(options: EnumerateVisualObjectInstancesOptions): VisualObjectInstance[] | VisualObjectInstanceEnumerationObject {
            return VisualSettings.enumerateObjectInstances(this.settings || VisualSettings.getDefault(), options);
        }
    }
}
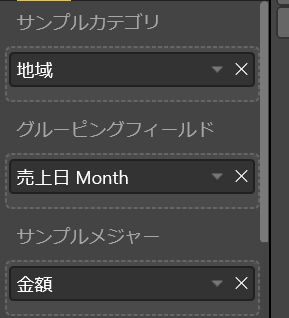
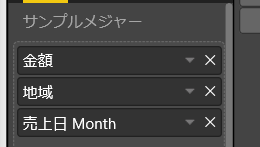
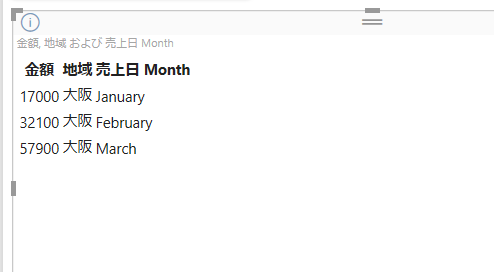
[カテゴリに地域、グルーピングに売上月配置]
[dataView の categories の値]
カテゴリには地域の 4 つのデータ
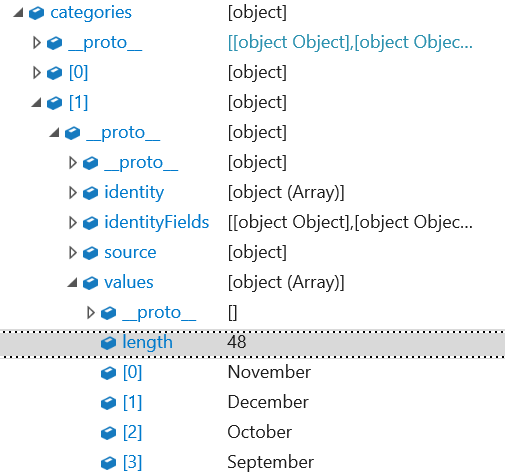
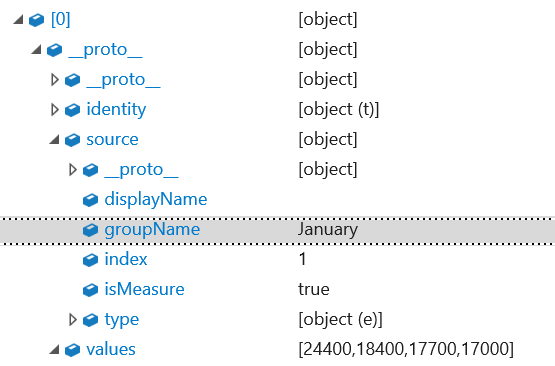
[dataView の values の値]
結果は売上月毎にグルーピングされ、その配下で地域でグルーピングされた値が生成
グルーピングされている売上月のラベルは source で取得可能
[レポートの結果]
table
データロールに配置されたフィールドについて、テーブル形式で返します。
table の例
{
    "dataRoles": [
        {
            "displayName": "サンプルメジャー",
            "name": "myMeasure",
            "kind": "GroupingOrMeasure"
        }
    ],
    "dataViewMappings": [
        {
            "table": {
                "rows": {
                    "for": {
                        "in": "myMeasure"
                    }
                }
            }
        }
    ]
}
動作確認
検証には以下の Visual を使います。
module powerbi.extensibility.visual {
    "use strict";

    export class Visual implements IVisual {

        private area: d3.Selection<HTMLElement>
        private table: d3.Selection<HTMLElement>
        private thead: d3.Selection<HTMLElement>
        private tbody: d3.Selection<HTMLElement>
        private host: IVisualHost;
        private settings: VisualSettings;

        constructor(options: VisualConstructorOptions) {
            // カスタムビジュアルを配置しているホストの情報を取得
            this.host = options.host;
            // カスタムビジュアルのエリアを取得
            this.area = d3.select(options.element);
            this.table = this.area.append("table");
            this.thead = this.table.append("thead").append("tr");
            this.tbody = this.table.append("tbody");
        }

        public update(options: VisualUpdateOptions) {
            debugger;

            this.thead.selectAll("th").remove();
            this.tbody.selectAll("tr").remove();

            // append the header row
            this.thead
                .selectAll("th")
                .data(options.dataViews[0].table.columns)
                .enter()
                .append("th")
                .text((column) => { return column.displayName; });

            options.dataViews[0].table.rows.forEach((row) => {

                this.tbody.append("tr")
                    .selectAll("td")
                    .data(row)
                    .enter()
                    .append("td")
                    .text((cell) => { return cell.toString(); });
            });

        }

        private static parseSettings(dataView: DataView): VisualSettings {
            return VisualSettings.parse(dataView) as VisualSettings;
        }

        public enumerateObjectInstances(options: EnumerateVisualObjectInstancesOptions): VisualObjectInstance[] | VisualObjectInstanceEnumerationObject {
            return VisualSettings.enumerateObjectInstances(this.settings || VisualSettings.getDefault(), options);
        }
    }
}
[データロールにフィールドを配置]
[レポートの結果]
dataReductionAlgorithm
dataReductionAlgorithm (データ削減アルゴリズム) を使うことで、受け取るデータ量を調整できます。DataReductionAlgorithm は categorical、table、matrix と併用でき、定義もそれぞれのプロパティ内で行います。
カスタムビジュアルは既定で top アルゴリズムが適用されており、上位 1000 件のデータだけ処理されるようになっており、以下定義と同等です。
"dataReductionAlgorithm": {
    "top": {
        "count": 1000
    }
}
データ削減アルゴリズムの種類
DataReductionAlgorithm には 4 種類のアルゴリズムがあります。
-
top: データセットの上位 x 件を取得 -
bottom: データセットの下位 x 兼を取得 -
sample: データセットより、初めと最後のレコード、および均等間隔の中間レコードをx 件のサンプルを取得 -
window: 指定した数ずつデータを取得 ※現時点ではtopと同じ結果しかサポートされませんが、今後本来のウィンドウ機能をサポートする予定。
dataReductionAlgorithm の例 1
以下の例では table に対して上位 3 件と取得します。dataReductionAlgorithm を指定する場所が重要で、この場合は rows 直下で指定しているため、取得できる行が 3 件となります。
{
    "dataRoles": [
        {
            "displayName": "サンプルメジャー",
            "name": "myMeasure",
            "kind": "GroupingOrMeasure"
        }
    ],
    "dataViewMappings": [
        {
            "table": {
                "rows": {
                    "dataReductionAlgorithm": {
                        "top": {
                            "count": 3
                        }
                    },
                    "for": {
                        "in": "myMeasure"
                    }
                }
            }
        }
    ]
}
動作確認
table の紹介で使ったビジュアルをそのまま使います。
[データロールにフィールドを配置]
[レポートの結果]
3 件だけデータが返ってくる
matrix
Matrix Data Mapping に詳細が出たためこちらの記事も追記します
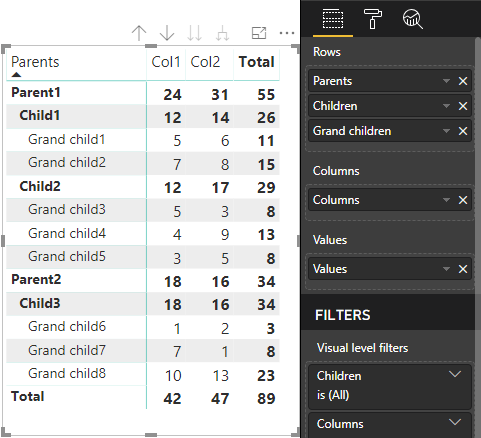
内容は table と似ていますが、行が階層として表現されます。
以下のようなデータがあった場合、
| Parents | Children | Grand children | Columns | Values |
|---|---|---|---|---|
| Parent1 | Child1 | Grand child1 | Col1 | 5 |
| Parent1 | Child1 | Grand child1 | Col2 | 6 |
| Parent1 | Child1 | Grand child2 | Col1 | 7 |
| Parent1 | Child1 | Grand child2 | Col2 | 8 |
| Parent1 | Child2 | Grand child3 | Col1 | 5 |
| Parent1 | Child2 | Grand child3 | Col2 | 3 |
| Parent1 | Child2 | Grand child4 | Col1 | 4 |
| Parent1 | Child2 | Grand child4 | Col2 | 9 |
| Parent1 | Child2 | Grand child5 | Col1 | 3 |
| Parent1 | Child2 | Grand child5 | Col2 | 5 |
| Parent2 | Child3 | Grand child6 | Col1 | 1 |
| Parent2 | Child3 | Grand child6 | Col2 | 2 |
| Parent2 | Child3 | Grand child7 | Col1 | 7 |
| Parent2 | Child3 | Grand child7 | Col2 | 1 |
| Parent2 | Child3 | Grand child8 | Col1 | 10 |
| Parent2 | Child3 | Grand child8 | Col2 | 13 |
capabilities.json で以下のような定義をすると
"matrix": {
    "rows": {
        "for": {
            "in": "Category"
        }
    },
    "columns": {
        "for": {
            "in": "Column"
        }
    },
    "values": {
        "select": [
            {
                "for": {
                    "in": "Measure"
                }
            }
        ]
    }
}
column に指定した列がヘッダーとして、集計した結果が返ってきます。
まとめ
グラフが必要とするデータをうまく整形するためにも DataViewMappings の知識は重要です。是非試してください。次回は objects を見ていきます。