※ 2019/07/15 ツールが 3.0 になりいくつか内容が変わったため記事を編集します。
前回 は pbiviz で作成されたプロジェクトの構造と、棒グラフの追加を行いました。今回は Power BI とカスタムビジュアルでやり取りされるデータについて詳細を見ていきます。
グラフ選択時のアクション追加
Power BI の特徴として、同じレポートにあるビジュアル同士が連携できるというものがあります。現在のカスタムビジュアルは他ビジュアルと連携しない状態のため、こちらを改修していきます。
1. ISelectionId と ISelectionManager をはじめにインポート。powerbi.extensibility.visual モジュール内、"use strict"; すぐ下に以下コードを追加。
import ISelectionId = powerbi.visuals.ISelectionId;
import ISelectionManager = powerbi.extensibility.ISelectionManager;
2. BarChartDataPoint に selectionId プロパティを追加。
interface BarChartDataPoint {
    value: number;
    category: string;
    selectionId: ISelectionId;
};
3. visualTransform 関数で selectionId を値の設定をしているループで作成。ここではカテゴリ毎にユニークな id を作成するため、withCategory を利用。
// カテゴリと値のセットを dataPoint に入れていく
for (let i = 0, len = Math.max(category.values.length, dataValue.values.length); i < len; i++) {
    barChartDataPoints.push({
        category: <string>category.values[i],
        value: <number>dataValue.values[i],
        selectionId: host.createSelectionIdBuilder()
            .withCategory(category, i)
            .createSelectionId()
    });
}
4. アイテム選択を管理する ISelectionManager と bars をクラスプロパティを追加。
private selectionManager: ISelectionManager;
private bars: d3.Selection<d3.BaseType, BarChartDataPoint, d3.BaseType, any>; // グラフのセレクション
5. コンストラクタ内で初期化。host 取得直下に以下コードを追加。
// セレクションマネージャーを取得
this.selectionManager = this.host.createSelectionManager();
6. update 関数内は変更点が多いので、以下コードと差し替え。大きな変更は bar をクラスレベルプロパティにしたことと、アイテムを選択した際の click イベントを追加。また内部的に使っている関数も追加。
public update(options: VisualUpdateOptions) {
    // Power BI より データを取得
    let viewModel: BarChartViewModel = Visual.visualTransform(options, this.host);
    // 現在のビジュアルの幅と高さを取得
    let width = options.viewport.width;
    let height = options.viewport.height;
    // 棒グラフ用にマージンを指定。bottom を 25 上げる
    let margin = { top: 0, bottom: 25, left: 0, right: 0 }
    // メインの svg をカスタムビジュアルと同じ大きさに指定
    this.svg
        .attr("width",width)
        .attr("height", height);

    // 棒グラフ用の高さとして、マージンの bottom を引いたものを用意
    height -= margin.bottom;
    // 値が負になることを考慮して高さマップ。
    let max = Math.max(viewModel.dataMax, -viewModel.dataMin);
    let yScale = d3.scaleLinear()
        .domain([0, max])
        .range([0, height * (max / (viewModel.dataMax - viewModel.dataMin))])
        .nice();

    // X軸スケール用の計算。カテゴリをドメインとし、全体の幅をグラフの数で分割
    // グラフとグラフの間は 0.1 の割合であける。
    let xScale = d3.scaleBand()
        .domain(viewModel.dataPoints.map(d => d.category))
        .rangeRound([0, width])
        .padding(0.1);

    // xAxis の場所をグラフ内各棒の下に設定
    let xAxis = d3.axisBottom(xScale);
    // xAxis の属性として transform を追加。
    this.xAxis
        .attr('transform', 'translate(0, ' + height + ')')
        .call(xAxis);
    // 棒グラフ内のすべてのグラフを取得し、データをバインド
    this.bars = this.barContainer
        .selectAll('.bar')
        .data(viewModel.dataPoints);
    // 各グラフ毎に rect (四角) を追加してクラスを定義
    // 高さや位置を指定
    this.bars.enter()
        .append('rect')
        .on('click', (d) => {
            // インタラクティブに操作できる場合 (レポート内)
            if (this.host.allowInteractions) {
                // CTRL キーを押下している場合は複数選択。
                const isCrtlPressed: boolean = (d3.event as MouseEvent).ctrlKey;
                // selectionManager でアイテムを追加。
                this.selectionManager
                    .select(d.selectionId, isCrtlPressed)
                    .then((ids: ISelectionId[]) => {
                        this.syncSelectionState(this.barContainer.selectAll('.bar'), ids);
                    });

                (<Event>d3.event).stopPropagation();
            }
        })
        .classed('bar', true)
        .attr("width",xScale.bandwidth())
        .attr("height", d => yScale(Math.abs(d.value)))
        .attr("y", d => {
            if (d.value > 0) {
                return yScale(max) - yScale(Math.abs(d.value));
            }
            else {
                return yScale(max);
            }
        })
        .attr("x", d => xScale(d.category))
        .attr("fill", d => {
            if (d.value > 0) {
                return 'green';
            }
            else {
                return 'red';
            }
        });

    // 更新された際の再描写
    this.bars
        .attr("width",xScale.bandwidth())
        .attr("height", d => yScale(Math.abs(d.value)))
        .attr("y", d => {
            if (d.value > 0) {
                return yScale(max) - yScale(Math.abs(d.value));
            }
            else {
                return yScale(max);
            }
        })
        .attr("x", d => xScale(d.category));

    this.syncSelectionState(
        this.barContainer.selectAll('.bar'),
        this.selectionManager.getSelectionIds() as ISelectionId[]
    );

    // 値がないグラフがあった場合は表示から削除
    this.bars.exit()
        .remove();

    // グラフ以外 (SVG 自体) をクリックした際に、選択をリセット
    this.svg.on('click', (d) => {
        if (this.host.allowInteractions) {
            this.selectionManager
                .clear()
                .then(() => {
                    this.syncSelectionState(this.barContainer.selectAll('.bar'), []);
                });
        }
    });
}

// 選択状況によって透過を設定
private syncSelectionState(
    selection: d3.Selection<d3.BaseType, BarChartDataPoint, d3.BaseType, any>,
    selectionIds: ISelectionId[]): void {
    if (!selection || !selectionIds) {
        return;
    }

    if (!selectionIds.length) {
        selection.style("fill-opacity", null);
        return;
    }

    const self: this = this;

    selection.each(function (barDataPoint: BarChartDataPoint) {
        const isSelected: boolean = self.isSelectionIdInArray(selectionIds, barDataPoint.selectionId);

        d3.select(this).style(
            "fill-opacity",
            isSelected ? 1 : 0.2
        );
    });
}

// アイテムが選択されているか確認
private isSelectionIdInArray(selectionIds: ISelectionId[], selectionId: ISelectionId): boolean {
    if (!selectionIds || !selectionId) {
        return false;
    }

    return selectionIds.some((currentSelectionId: ISelectionId) => {
        return currentSelectionId.includes(selectionId);
    });
}
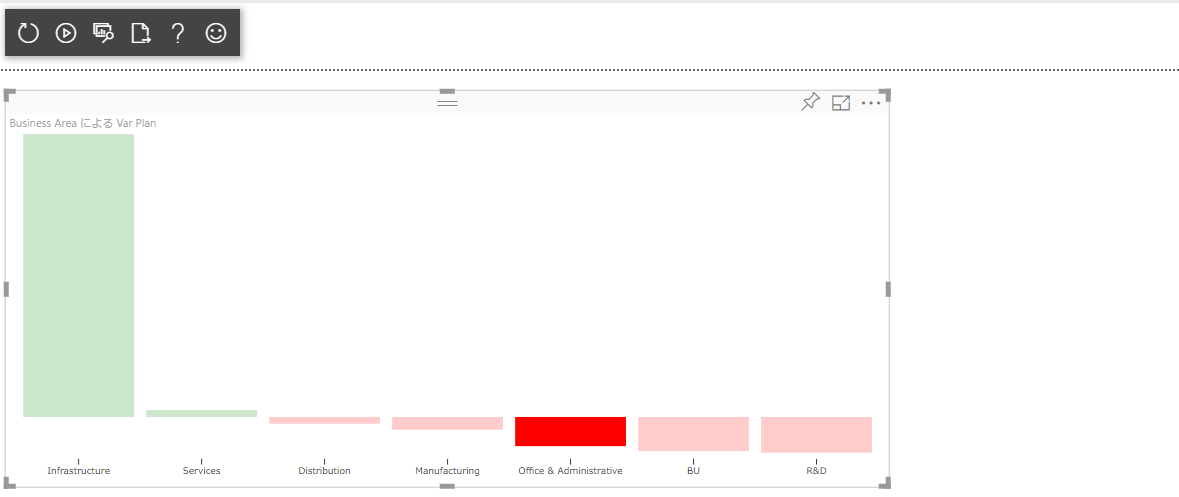
7. カスタムビジュアルを更新して動作を確認します。
ハイライトのサポート
他のビジュアルと連携した場合、既定では他のビジュアルで選択されたデータにフィルタされて表示されるますが、ハイライトを使うとすべてのデータを表示しながら、選択された場所だけをハイライトすることが出来ます。
1. まず既定の動作を確認するため、追加で既定の棒グラフを追加し、同じフィールドを設定。
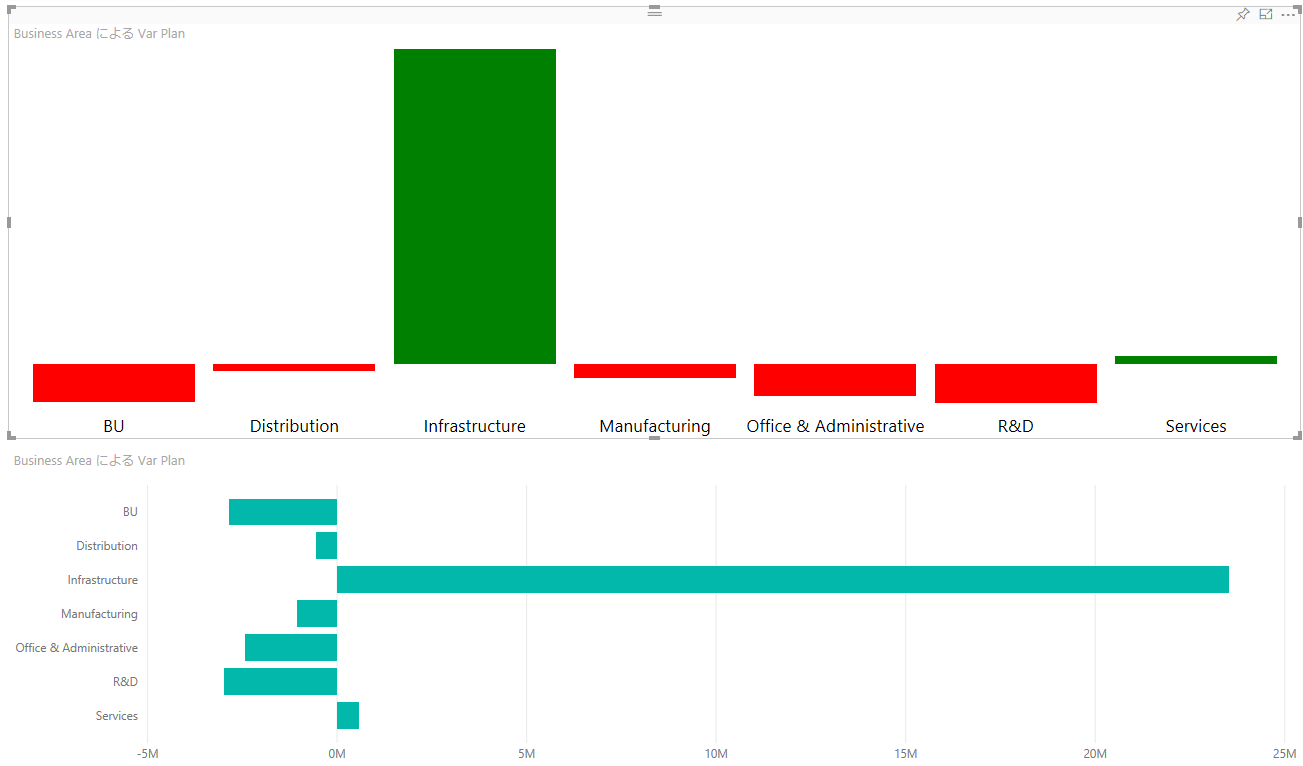
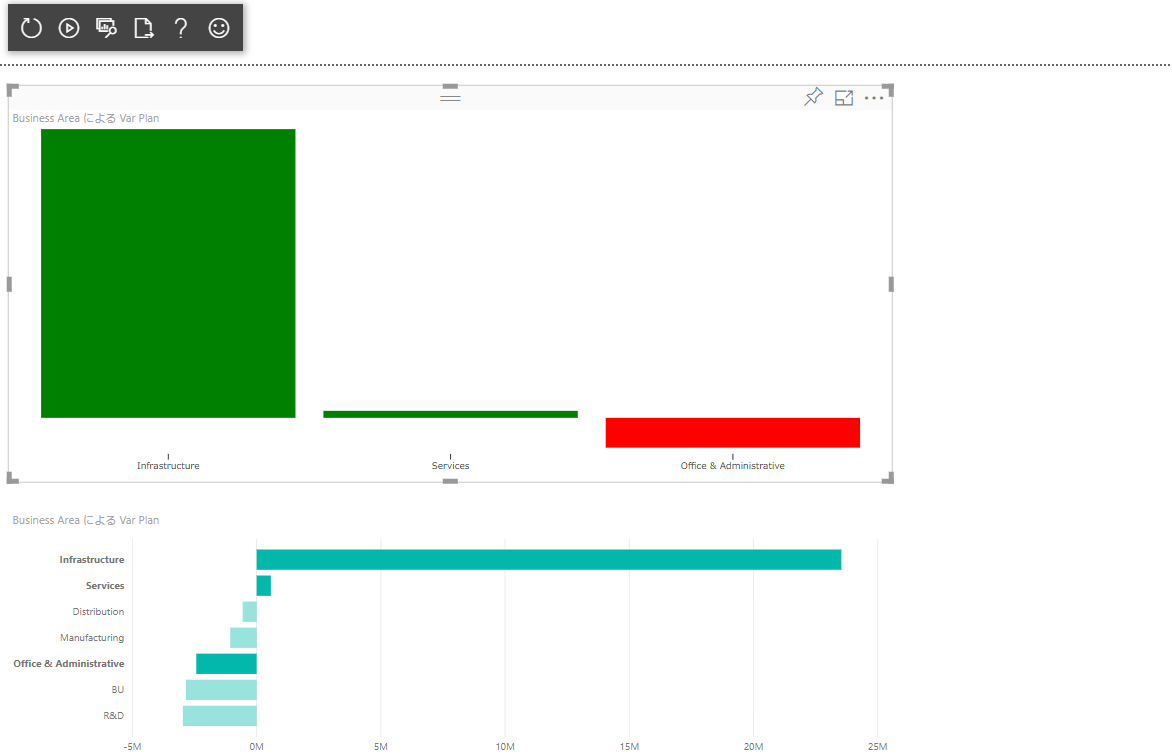
2. 既定のグラフで複数の項目を選択して動作を確認。選択せれていないデータは表示されない。
3. capabilities.json の初めに、以下を追加。
"supportsHighlight": true,
4. データセット全体でハイライトが有効になっているか、および各データポイントでハイライトが有効かを確認するためインターフェースを更新。
interface BarChartViewModel {
    dataPoints: BarChartDataPoint[];
    dataMax: number;
    dataMin: number;
    highlights: boolean;
};
interface BarChartDataPoint {
    value: number;
    category: string;
    selectionId: ISelectionId;
    highlighted: boolean;
};
5. visualTransform 関数でハイライトを設定
function visualTransform(options: VisualUpdateOptions, host: IVisualHost): BarChartViewModel {
    // Power BI からのデータを受け取る
    // データは dataViews プロパティに存在
    let dataViews = options.dataViews;
    // 空の viewModel を作成。
    let viewModel: BarChartViewModel = {
        dataPoints: [],
        dataMax: 0,
        dataMin: 0,
        highlights: false
    }
    // 期待した値があるか確認。なければ空データを返す
    if (!dataViews
        || !dataViews[0]
        || !dataViews[0].categorical
        || !dataViews[0].categorical.categories
        || !dataViews[0].categorical.categories[0].source
        || !dataViews[0].categorical.values)
        return viewModel;
    // 値があった場合はそれぞれ変数に一旦抜き出し
    let categorical = dataViews[0].categorical;
    let category = categorical.categories[0];
    let dataValue = categorical.values[0]
    let highlights = dataValue.highlights;
    // dataPoint のインスタンス化
    let barChartDataPoints: BarChartDataPoint[] = [];
    let dataMax: number;
    let dataMin: number;
    // カテゴリと値のセットを dataPoint に入れていく
    for (let i = 0, len = Math.max(category.values.length, dataValue.values.length); i < len; i++) {
        barChartDataPoints.push({
            category: <string>category.values[i],
            value: <number>dataValue.values[i],
            selectionId: host.createSelectionIdBuilder()
                .withCategory(category, i)
                .createSelectionId(),
            highlighted: highlights ? highlights[i] ? true : false : false
        });
    }
    // 値の最大を取得
    dataMax = <number>dataValue.maxLocal;
    // 値の最小値を取得
    dataMin = <number>dataValue.minLocal;
    // viewModel を返す
    return {
        dataPoints: barChartDataPoints,
        dataMax: dataMax,
        dataMin: dataMin,
        highlights: barChartDataPoints.filter(d => d.highlighted).length > 0
    }
}
6. 最後に update 関数内でハイライトの場合は透過を追加するように設定。this.bars.enter() のメソッドチェーン最後に以下処理を追加。
.attr("fill-opacity", d => viewModel.highlights ? d.highlighted ? 1.0 : 0.2 : 1.0);
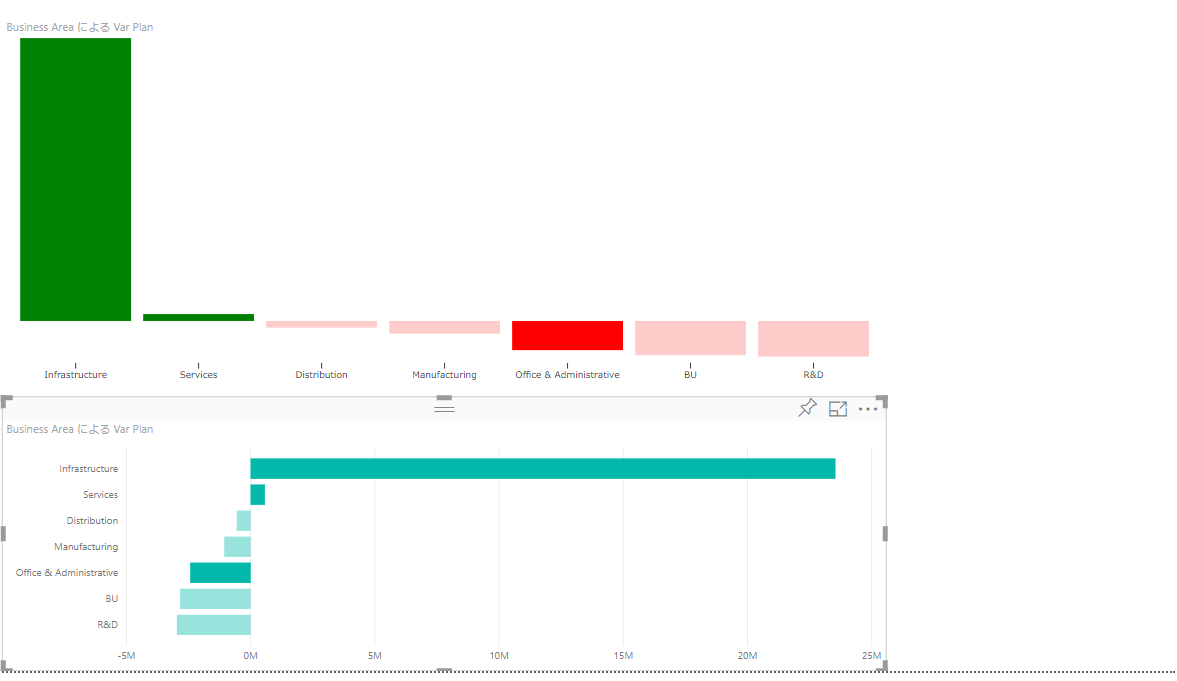
7. 保存してカスタムビジュアルを更新。動作を確認。
グラフを選択した際のインタラクションは様々なバリエーションがあるので、是非色々実装してください。次回はフィールドや書式などグラフの外のカスタマイズを見ていきます。