更新のお知らせ
好評につきまして Altair のハンズオン資料を大幅アップデートしました。ぜひこちらもご活用ください。
概要
本稿ではグラフ可視化ライブラリ Altair を用いて、interactive な図を作成する方法を紹介する。前稿では Kaggle のデータセットを用いたが、今回は乱数を用いてクロスセクションデータ(ある一点のデータ)と時系列データをそれぞれ生成し、それぞれに適した可視化を説明する。
ハンズオン
(2022年11月26日追記)
本稿のipython notebookを公開しました(WEB形式, ソースコード)。よろしければご活用ください。
Altair の長所
- データ可視化記述フォーマット VEGA に準拠したデザイン
- streamlit などでサーバーを立てなくても interactive な図を html や vega で出力できる。(interactive な図をメールや slack で送受信することができる)
- R でもパッケージが用意されている
Altair の注意点
- Altair の入力は Pandas の DataFrame で行うが、デフォルトでは入力可能な最大行数が 5000 行に設定されている。入力データが 5000 行以上になる場合、参考記事 のやり方で設定を変える必要がある。
図の保存方法について
本稿では altair_saver を用いて html で図を保存する。前稿のように png、svg、vega などで保存することも可能である。
クロスセクションデータの作成
今回は、架空の学校で行われた期末試験の得点をクロスセクションデータとして用いる。この学校には学生が 300 人在籍し、普通、特進、理数の 3 クラスが存在する。期末試験の科目は国語、数学、理科、社会、英語で各教科 100 点満点とする。
import numpy as np
import pandas as pd

np.random.seed(1)# 乱数の固定

n = 300 # 学生の人数
s = np.random.normal(55,10,n) # 学生の学力(score)
c = np.random.randint(0,3,n) # クラス
s = s * (1 + c * 0.015) # クラスの学力差をつける
g = np.random.randint(0,2,n) # 性別

# 得点データの生成
s1 = np.random.uniform(0.75,1.1,n) * s * (1 + g * 0.02)
s2 = np.random.uniform(0.9,1.1,n) * s * (1 - g * 0.05)
s3 = np.random.uniform(0.9,1.05,n) * s * (1 + g * 0.03)
s4 = np.random.uniform(0.9,1.2,n) * s * (1 - g * 0.02)
s5 = np.random.uniform(0.8,1.1,n) * s * (1 + g * 0.01)

sex = ['男','女'] # 性別
cl = ['普通','理数','特進'] # クラス
sub = ['国語','数学','理科','社会','英語'] # 教科

df = pd.DataFrame()
df['学生番号'] = list(map(lambda x: 'ID'+str(x).zfill(3), range(1,1+n)))
df['国語'] = list(map(lambda x: round(x), s1))
df['数学'] = list(map(lambda x: round(x), s2))
df['理科'] = list(map(lambda x: round(x), s3))
df['社会'] = list(map(lambda x: round(x), s4))
df['英語'] = list(map(lambda x: round(x), s5))
df['合計'] = df['国語'] + df['数学'] + df['社会'] + df['理科'] + df['英語']
df['クラス'] = list(map(lambda x: cl[x], c))
df['性別'] = list(map(lambda x: sex[x], g))
print(df.head(10))
    学生番号  国語  数学  理科  社会  英語   合計 クラス 性別
0  ID001  65  68  68  72  76  349  普通  男
1  ID002  48  52  49  56  47  252  普通  男
2  ID003  52  45  50  49  45  241  普通  女
3  ID004  48  39  46  45  39  217  普通  女
4  ID005  52  62  71  68  63  316  特進  女
5  ID006  27  31  32  32  33  155  特進  女
6  ID007  74  63  77  80  78  372  普通  女
7  ID008  53  48  48  52  50  251  特進  男
8  ID009  58  55  60  58  55  286  特進  女
9  ID010  58  53  48  63  48  270  理数  男
Altair では pandas の DataFrame でデータを入力する。上記の df は、5教科の得点が異なる列に並ぶ 横長のデータ形式をとっている。このような横長のデータ形式は雑然データ(messy data) と呼ばれる。Altair で各教科の得点を比較する図を作成したい場合、雑然データではなく 整然データ(tidy data) の入力を求められるケースがある。そこで、pandas の melt関数 を用いて、雑然データから整然データへの変換も事前に行う。
mdf = pd.melt(
    df.drop("合計", axis=1), id_vars=["学生番号", "性別", "クラス"], var_name="科目", value_name="得点"
)
print(mdf)  # melted dataframe
 学生番号 性別 クラス  科目  得点
0     ID001  男  普通  国語  65
1     ID002  男  普通  国語  48
2     ID003  女  普通  国語  52
3     ID004  女  普通  国語  48
4     ID005  女  特進  国語  52
...     ... ..  ..  ..  ..
1495  ID296  男  特進  英語  50
1496  ID297  男  理数  英語  65
1497  ID298  女  普通  英語  69
1498  ID299  男  特進  英語  44
1499  ID300  男  特進  英語  52
クロスセクションデータの可視化
散布図
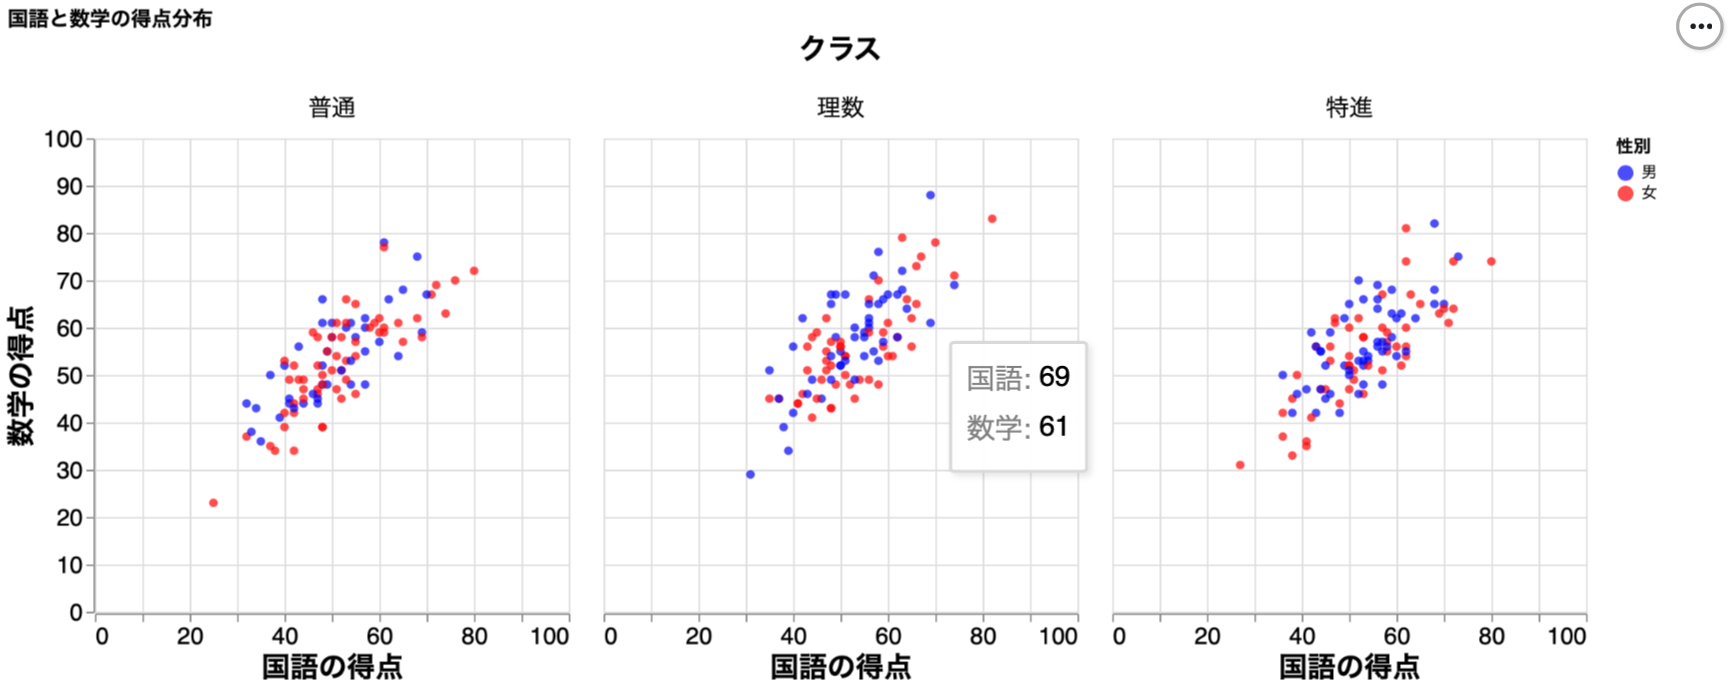
散布図の作成例は以下のとおり。
import altair as alt
from altair_saver import save

scatter = (
    alt.Chart(df)
    .mark_circle(size=30)
    .encode(
        x=alt.X(
            "国語",
            scale=alt.Scale(domain=[0, 100]),
            axis=alt.Axis(
                labelFontSize=15, ticks=True, titleFontSize=18, title="国語の得点"
            ),
        ),
        y=alt.Y(
            "数学",
            scale=alt.Scale(domain=[0, 100]),
            axis=alt.Axis(
                labelFontSize=15, ticks=True, titleFontSize=18, title="数学の得点"
            ),
        ),
        column=alt.Column(
            "クラス",
            header=alt.Header(labelFontSize=15, titleFontSize=18),
            sort=alt.Sort(cl),
            title="クラス",
        ),
        color=alt.Color(
            "性別",
            scale=alt.Scale(domain=sex, range=["blue", "red"]),
        ),
        tooltip=["国語", "数学"],
    )
    .properties(width=300, height=300, title="国語と数学の得点分布")
    .interactive()
)

save(scatter, "scatter.html", embed_options={"actions": True})
| クラス | 引数の意味 |
|---|---|
| Chart() | 可視化するデータの DataFrame |
| mark_circle() | 散布図全体に共通の情報(今回はプロットのサイズ) |
| encode() | DataFrame の各行で行う操作。tooltip で interactive に情報を表示できる |
| X() | 横軸に表示する DataFrame の列 |
| Scale() (※X()の引数) |
domain で軸の範囲を指定 |
| Axis() | 軸の設定。title で軸ラベルも変更可能 |
| Y() | 縦軸に表示する DataFrame の列 |
| Column() | 図の分割で使用する DataFrame の列 |
| Sort() | 図の並び順を指定 |
| Color() | プロットの色分けで使用する DataFrame の列 |
| Scale() (※Color()の引数) |
domain と range の組み合わせで色を指定 |
| properties() | 図のサイズやタイトル |
| interactive() | なし。カーソルのドラックで図をスライドできるようになる |
【ポイント1】tooltip で指定した国語と数学の得点が カーソルを合わせてプロットで表示される。
【ポイント2】 プロットの色は ColorName またはカラーコードから選択できる。
散布図(統計量の表示)
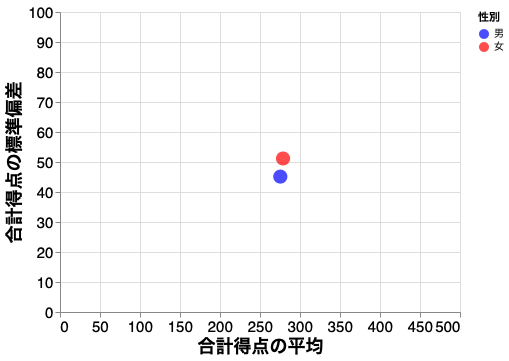
平均や標準偏差といった統計量を表示することができる。
ちなみに散布図は mark_circle()でも、mark_point() でも作成できる。
import altair as alt
from altair_saver import save

scatter = (
    alt.Chart(df)
    .mark_point(filled=True, size=200, opacity=0.7)
    .encode(
        x=alt.X(
            "mean(合計):Q",
            scale=alt.Scale(domain=[0, 500]),
            axis=alt.Axis(title="合計得点の平均"),
        ),
        y=alt.Y(
            "stdev(合計):Q",
            scale=alt.Scale(domain=[0, 100]),
            axis=alt.Axis(title="合計得点の標準偏差"),
        ),
        color=alt.Color("性別", scale=alt.Scale(domain=sex, range=["blue", "red"])),
    )
)
save(scatter, "stat_scatter.html", embed_options={"actions": True})
【ポイント】 aggregation 関数を用いることで主要な統計量は計算可能である。代表的な統計量は mean()、median()、sum()、min()、max()、stderr()(標準誤差)、stdev()(標準偏差)など。
ヒストグラム
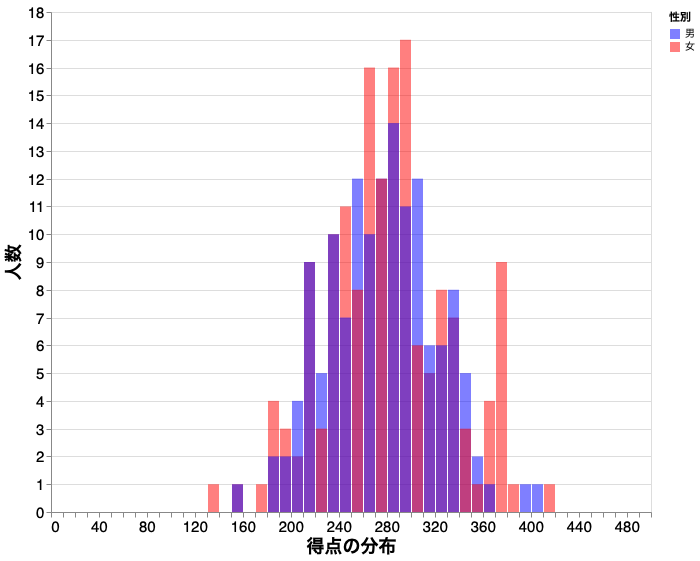
得点の分布を調べる際に有効である。
import altair as alt
from altair_saver import save

histgram = (
    alt.Chart(df)
    .mark_bar(opacity=0.5)
    .encode(
        x=alt.X(
            "合計",
            bin=alt.Bin(step=10, extent=[0, 500]),
            axis=alt.Axis(
                labelFontSize=15, ticks=True, titleFontSize=18, title="得点の分布"
            ),
        ),
        y=alt.Y(
            "count(合計)",
            axis=alt.Axis(labelFontSize=15, ticks=True, titleFontSize=18, title="人数"),
            stack=None,
        ),
        color=alt.Color(
            "性別",
            scale=alt.Scale(domain=sex, range=["blue", "red"]),
        ),
    )
    .properties(width=600, height=500)
    .interactive()
)

save(histgram, "histgram.html", embed_options={"actions": True})
| クラス | 引数の意味 |
|---|---|
| mark_bar() | ヒストグラムの各種設定。2種以上のヒストグラムを重ねる場合 opacity で透明度を設定するとよい |
| bin() | ヒストグラム作成時のビニングの設定。extent で軸全体の範囲、stepでビンの幅を設定。 |
【ポイント】 aggregation 関数の 1 つである count() を用いてビンごとに要素の数を数えることができる。
ヒートマップ(相関係数の表示)
相関係数を altair で表示するには、雑然データから整然データへの変換が必要である。
import altair as alt
from altair_saver import save

corr = df[sub].corr()
corr = pd.melt(corr.reset_index(), id_vars="index", var_name="科目", value_name="相関係数")
heatmap = (
    alt.Chart(corr)
    .mark_rect()
    .encode(
        x=alt.X(
            "index:O",
            sort=sub,
            axis=alt.Axis(
                labelFontSize=20, ticks=True, titleFontSize=20, title="科目", labelAngle=0
            ),
        ),
        y=alt.Y(
            "科目:O",
            sort=sub,
            axis=alt.Axis(
                labelFontSize=20, ticks=True, titleFontSize=20, title="科目", labelAngle=0
            ),
        ),
        color=alt.Color("相関係数:Q", scale=alt.Scale(domain=[0.8, 1])),
        tooltip=["相関係数"],
    )
    .properties(width=300, height=300)
    .interactive()
)

save(heatmap, "heatmap.html", embed_options={"actions": True})
| クラス | 引数の意味 |
|---|---|
| mark_rect() | ヒートマップの各種設定 |
【ポイント1】 ヒートマップの作成には整然データが必要である。
【ポイント2】 domain でヒートの幅を指定できる。
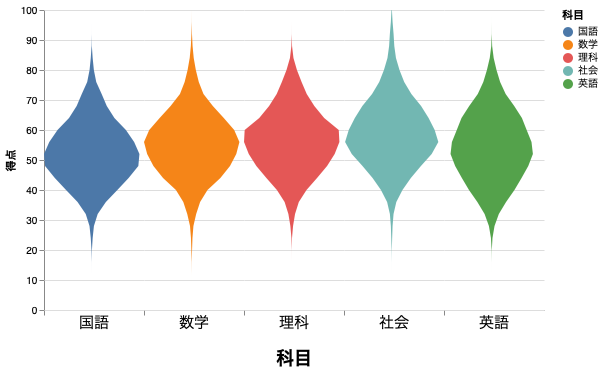
バイオリンプロット
import altair as alt
from altair_saver import save

# 入力データは雑然データ df ではなく整然データ mdf であることに注意
violin = (
    alt.Chart(mdf)
    .transform_density("得点", as_=["得点", "density"], extent=[0, 100], groupby=["科目"])
    .mark_area(orient="horizontal")
    .encode(
        x=alt.X(
            "density:Q",
            stack="center",
            impute=None,
            title=None,
            axis=alt.Axis(labels=False, values=[0], grid=False, ticks=True),
        ),
        y="得点:Q",
        color="科目:N",
        column=alt.Column(
            "科目:N",
            header=alt.Header(
                titleOrient="bottom",
                labelOrient="bottom",
                labelPadding=0,
                labelFontSize=15,
                titleFontSize=18,
            ),
        ),
    )
    .configure_facet(spacing=0)
    .configure_view(stroke=None)
    .properties(width=100, height=300)
    .interactive()
)

save(violin, "violin.html", embed_options={"actions": True})
| クラス | 引数の意味 |
|---|---|
| transform_density() | 滑らかな分布になるようにデータを加工する |
| configure_facet() | 図の配置方法を決める。space で図の間隔を指定 |
| configure_view() | 図の見え方を決める。stroke=None で図の境界線を消す |
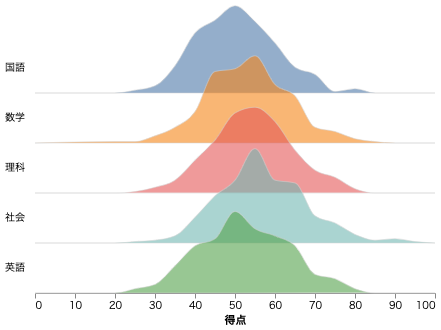
リッジライン
Altair では、リッジラインで分布を表すことができる。波の高さは step と overlap で調節できる。
import altair as alt
from altair_saver import save

step = 50
overlap = 1

ridgeline = (
    alt.Chart(mdf)
    .transform_bin(as_="ビン", field="得点", bin=alt.Bin(step=5, extent=[0, 100]))
    .transform_aggregate(y_axis="count()", groupby=["科目", "ビン"])
    .transform_impute(
        impute="y_axis", groupby=["科目"], key="ビン", value=0, keyvals=[0, 100]
    )
    .mark_area(
        interpolate="monotone", fillOpacity=0.6, stroke="lightgray", strokeWidth=0.5
    )
    .encode(
        alt.X(
            "ビン:Q",
            title="得点",
            axis=alt.Axis(grid=False),
            scale=alt.Scale(domain=[0, 100]),
        ),
        alt.Y(
            "y_axis:Q",
            stack=None,
            title=None,
            axis=None,
            scale=alt.Scale(range=[step, -step * overlap]),
        ),
        alt.Fill("科目:N", legend=None),
        alt.Row("科目:N", title=None, header=alt.Header(labelAngle=0, labelAlign="left")),
    )
    .properties(bounds="flush", width=400, height=int(step))
    .configure_facet(spacing=0)
    .configure_view(stroke=None)
    .configure_title(anchor="end")
)

save(ridgeline, "ridgeline.html", embed_options={"actions": True})
図の重ね合わせ
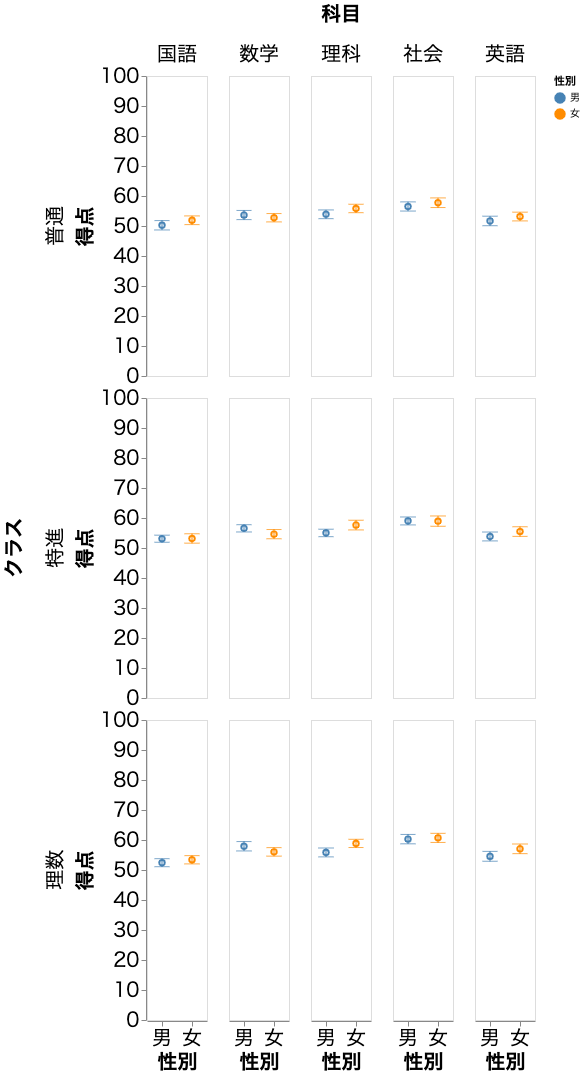
各教科の得点の平均をmark_point()で、標準誤差をmark_errorbar()で表示し、それらを組み合わせる。
import altair as alt
from altair_saver import save

point = (
    alt.Chart()
    .mark_point()
    .encode(
        x=alt.X(
            "性別",
            axis=alt.Axis(
                labelFontSize=20, ticks=True, titleFontSize=20, grid=False, labelAngle=0
            ),
            sort=sex,
        ),
        y=alt.Y(
            "得点:Q",
            aggregate="mean",
            axis=alt.Axis(
                labelFontSize=20, ticks=True, titleFontSize=20, grid=False, domain=True
            ),
            scale=alt.Scale(domain=[0, 100]),
        ),
        color=alt.Color(
            "性別",
            scale=alt.Scale(domain=sex, range=["steelblue", "darkorange"]),
        ),
    )
)

bar = (
    alt.Chart()
    .mark_errorbar(extent="stderr", ticks=True, orient="vertical")
    .encode(
        x=alt.X(
            "性別",
            axis=alt.Axis(
                labelFontSize=20, ticks=True, titleFontSize=20, grid=False, labelAngle=0
            ),
            sort=sex,
        ),
        y=alt.Y(
            "得点:Q",
            axis=alt.Axis(
                labelFontSize=20, ticks=True, titleFontSize=20, grid=False, domain=True
            ),
            scale=alt.Scale(domain=[0, 100]),
        ),
        color=alt.Color(
            "性別",
            scale=alt.Scale(domain=sex, range=["steelblue", "darkorange"]),
        ),
    )
)

chart = (
    alt.layer(point, bar, data=mdf)
    .properties(width=60, height=300)
    .facet(
        column=alt.Column("科目", header=alt.Header(labelFontSize=20, titleFontSize=20)),
        row=alt.Row("クラス", header=alt.Header(labelFontSize=20, titleFontSize=20)),
    )
    .interactive()
)

save(chart, "layered.html", embed_options={"actions": True})
| クラス | 引数の意味 |
|---|---|
| mark_errorbar() | エラーバーの各種設定。extent で種類を選べる。95% 信頼区間はextent=ci
|
| layer() | 重ね合わせる 2 つの図のクラス、および 2 つの図に共通する入力データ |
| facet() | layer()で重ね合わせた図の分割で使用する DataFrame の列 |
【ポイント】 重ね合わせた図を column や row で分割したい場合は facet() を用いる。
【備考】 入力する DataFrame が異なる図を 2 個以上重ね合わせたい場合は、単に chart1+chart2 とする。
プルダウンによる図の切替
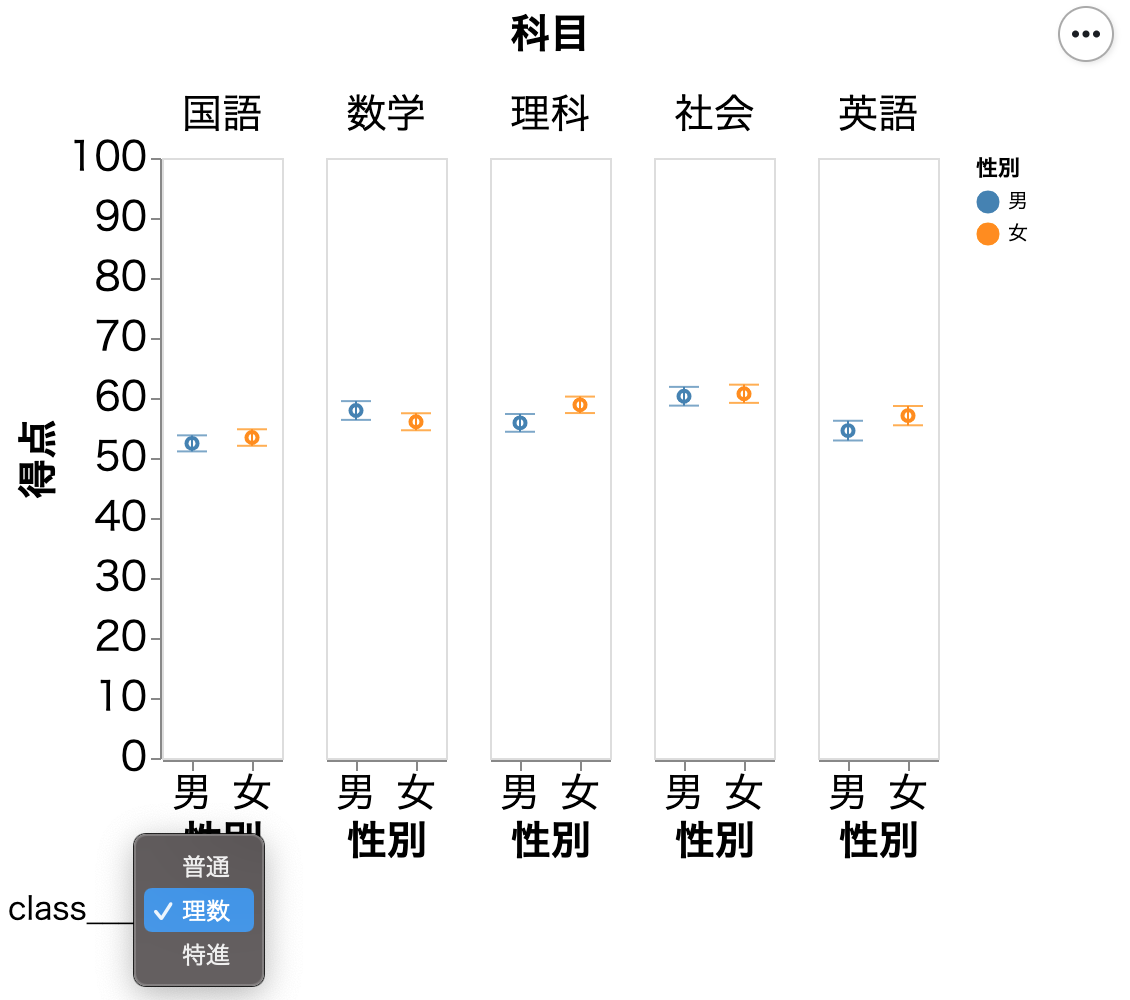
column などで図を分割すると、図全体のサイズが大きくなる。図のサイズを小さく抑えるためにプルダウンを用いることができる。
import altair as alt
from altair_saver import save

genre_dropdown = alt.binding_select(options=cl)
genre_select = alt.selection_single(
    fields=["クラス"], bind=genre_dropdown, name="class", init={"クラス": cl[0]}
)

chart = (
    alt.layer(point, bar, data=mdf)  # point と bar は layered.html のものと共通
    .properties(width=60, height=300)
    .add_selection(genre_select)
    .transform_filter(genre_select)
    .facet(
        column=alt.Column("科目", header=alt.Header(labelFontSize=20, titleFontSize=20))
    )
    .interactive()
)

save(chart, "pulldown.html", embed_options={"actions": True})
| クラス | 引数の意味 |
|---|---|
| binding_select() | プルダウンの選択肢 |
| selection_single() | 図とプルダウンの連結に必要な情報。init でデフォルトで選ばれる選択肢を指定 |
| add_selection() |
selection_single()。 図とプルダウンを連結させることができる |
| transform_filter() |
selection_single()。DataFrame のフィルタリングを実施する。 |
【注意】 箱ひげ図を作成する mark_boxplot() は transform_filter()を使えない。従って、箱ひげ図をプルダウンで切り替えることができない。
散布図と連動した図の切替
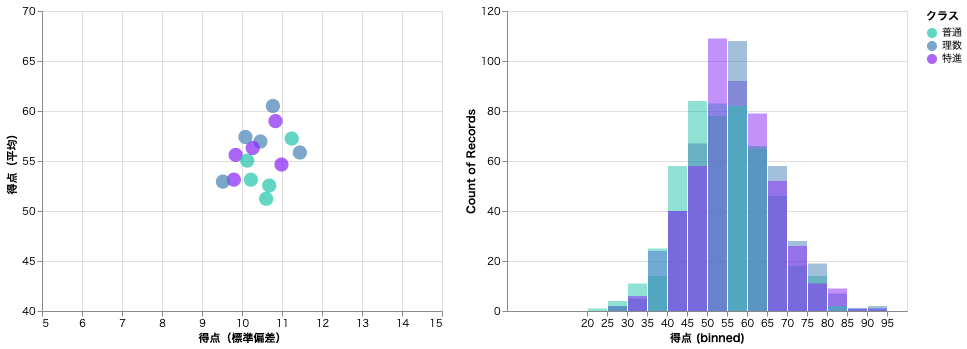
散布図のプロットをクリックすることで、散布図自身や他の図を切り替えることができる。
import altair as alt
from altair_saver import save

mdf_mean = mdf.groupby(["科目", "クラス"]).mean().reset_index()
mdf_std = mdf.groupby(["科目", "クラス"]).std().reset_index()
mdf_agg = pd.merge(mdf_mean, mdf_std, on=["科目", "クラス"], suffixes=("(平均)", "(標準偏差)"))

selector = alt.selection_single(empty="all", fields=["科目"])
color_scale = alt.Scale(domain=cl, range=["#1FC3AA", "#4682b4", "#8624F5"])

points = (
    alt.Chart(mdf_agg)
    .mark_point(filled=True, size=200)
    .encode(
        x=alt.X("得点(標準偏差)", scale=alt.Scale(domain=[5, 15])),
        y=alt.Y("得点(平均)", scale=alt.Scale(domain=[40, 70])),
        color=alt.condition(selector, "クラス", alt.value("lightgray"), scale=color_scale),
        tooltip=["科目", "クラス"],
    )
    .add_selection(selector)
)

hists = (
    alt.Chart(mdf)
    .mark_bar(opacity=0.5, thickness=100)
    .encode(
        x=alt.X(
            "得点",
            bin=alt.Bin(step=5),  # step keeps bin size the same
            scale=alt.Scale(domain=[0, 100]),
        ),
        y=alt.Y("count()", stack=None, scale=alt.Scale(domain=[0, 120])),
        color=alt.Color("クラス", scale=color_scale),
    )
    .transform_filter(selector)
)

save(points | hists, "swittiching.html", embed_options={"actions": True})
| クラス | 引数の意味 |
|---|---|
| condition() | 条件分岐。 condition(条件, True 時の操作, False 時の操作)
|
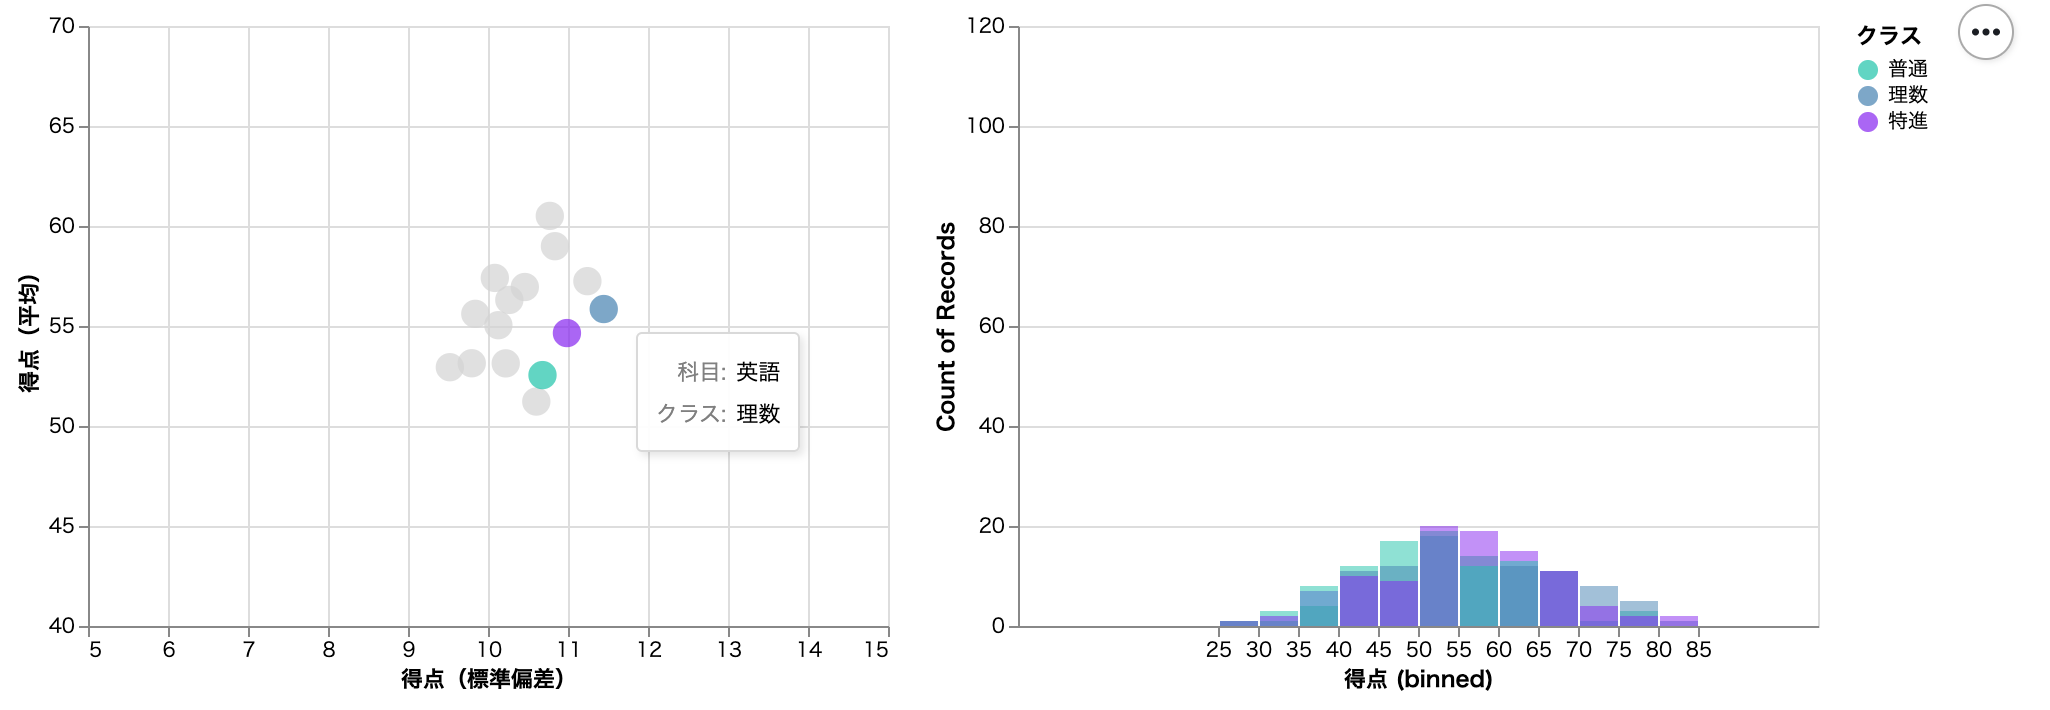
プロットをクリックする前は全ての情報が表示される。左の散布図には、3 クラス(普通、理数、特進)、5 教科(国語、数学、理科、社会、英語)の合計 15 プロットが描画され、右のヒストグラムには各教科の得点分布が描画される。
例えば、理数クラスの英語のプロットをクリックすると、英語以外は散布図では灰色になりヒストグラムではカウントされなくなる。
ジッタープロット
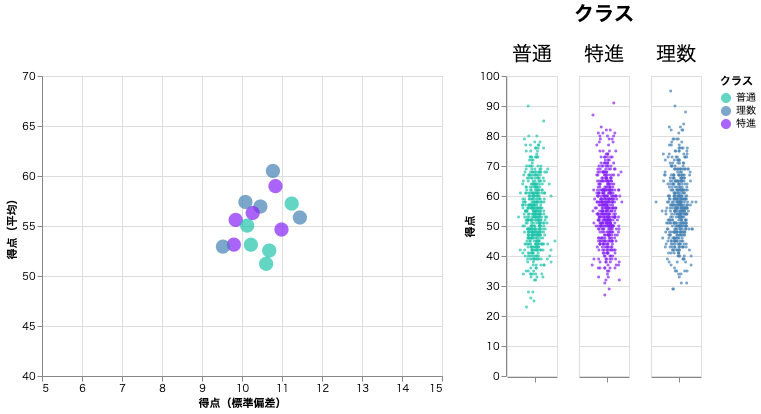
上図のヒストグラムは重ね合わさっているためわかりにくい。図の重なりを回避しながらデータの分布を表現する方法としてジッタープロットがある。
import altair as alt
from altair_saver import save

points = (
    alt.Chart(mdf_agg)
    .mark_point(filled=True, size=200)
    .encode(
        x=alt.X("得点(標準偏差)", scale=alt.Scale(domain=[5, 15])),
        y=alt.Y("得点(平均)", scale=alt.Scale(domain=[40, 70])),
        color=alt.condition(selector, "クラス", alt.value("lightgray"), scale=color_scale),
        tooltip=["科目", "クラス"],
    )
    .add_selection(selector)
)

stripplot = (
    alt.Chart(mdf)
    .mark_circle(size=8)
    .encode(
        x=alt.X(
            "jitter:Q",
            title=None,
            axis=alt.Axis(values=[0], ticks=True, grid=False, labels=False),
            scale=alt.Scale(),
        ),
        y=alt.Y("得点:Q"),
        color=alt.condition(selector, "クラス", alt.value("lightgray"), scale=color_scale),
        column=alt.Column("クラス", header=alt.Header(labelFontSize=20, titleFontSize=20)),
    )
    .transform_filter(selector)
    .transform_calculate(
        # Generate Gaussian jitter with a Box-Muller transform
        jitter="sqrt(-2*log(random()))*cos(2*PI*random())"
    )
    .properties(width=50)
)

save(points | stripplot, "jitter.html", embed_options={"actions": True})
| クラス | 引数の意味 |
|---|---|
| .transform_calculate() | ジッタープロット作成のための乱数を生成する。ここでは正規分布に従って乱数を生成している。 |
棒グラフ
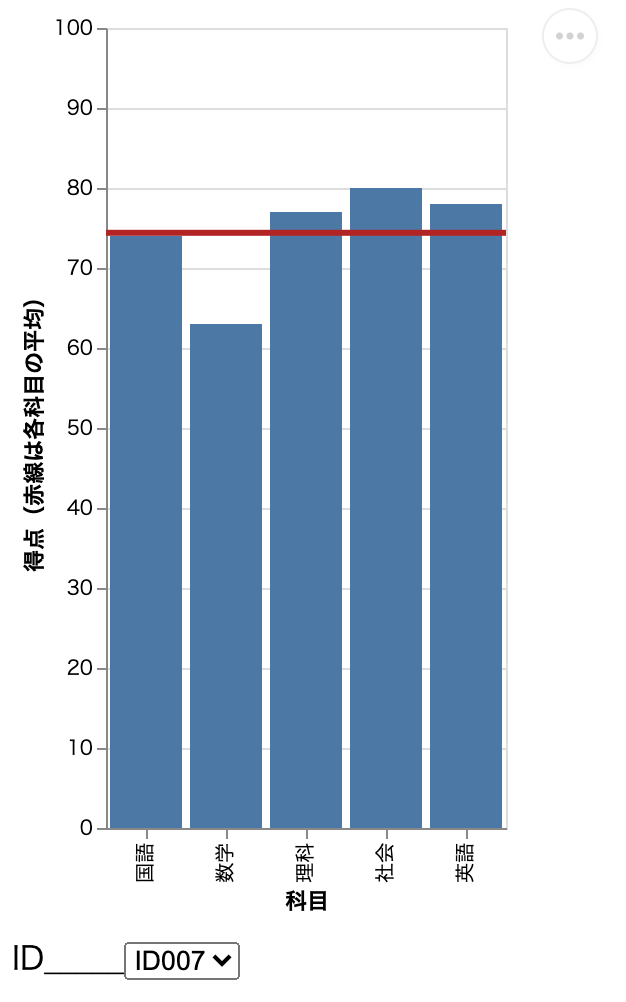
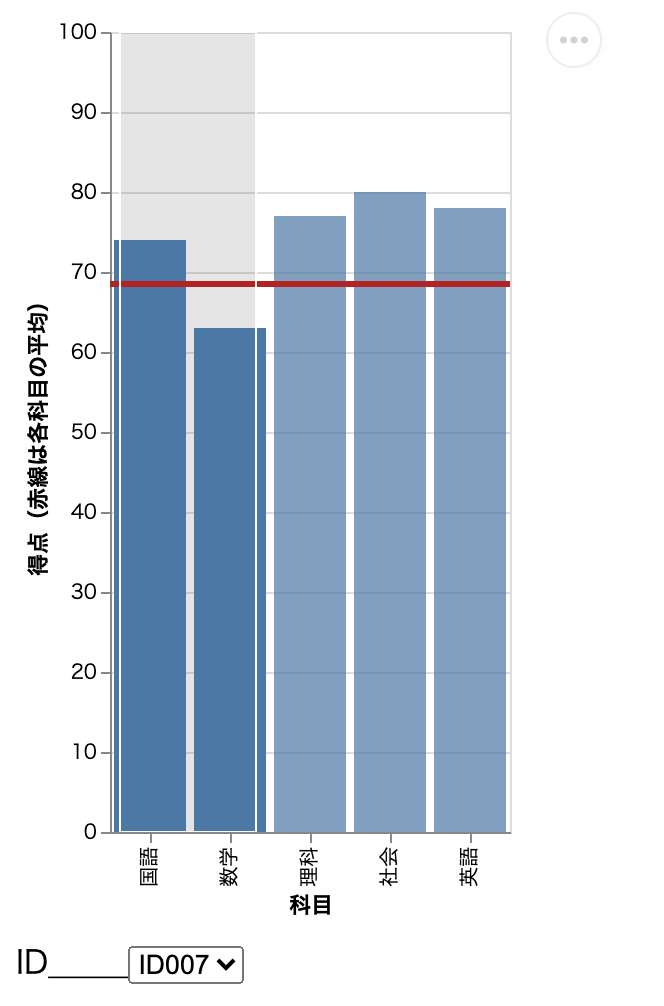
プルダウンで選択した学生の点数を教科ごとに棒グラフで表示する。赤線は 5 教科の平均点を表す。さらにドラッグで選択した教科の平均点を表示することもできる。(例えば、国語と数学 2 教科の平均点を表示させることも可能となる。)
import altair as alt
from altair_saver import save

ID = df["学生番号"].values.tolist()
genre_dropdown = alt.binding_select(options=ID)
genre_select = alt.selection_single(
    fields=["学生番号"], bind=genre_dropdown, name="ID", init={"学生番号": ID[0]}
)

brush = alt.selection(type="interval", encodings=["x"])

bars = (
    alt.Chart()
    .mark_bar()
    .encode(
        x=alt.X("科目:O"),
        y=alt.Y("得点:Q", scale=alt.Scale(domain=[0, 100])),
        opacity=alt.condition(brush, alt.OpacityValue(1), alt.OpacityValue(0.7)),
    )
    .add_selection(brush)
    .add_selection(genre_select)
    .transform_filter(genre_select)
)

line = (
    alt.Chart()
    .mark_rule(color="firebrick")
    .encode(
        y=alt.Y("mean(得点):Q", scale=alt.Scale(domain=[0, 100]), title="得点(赤線は各科目の平均)"),
        size=alt.SizeValue(3),
    )
    .transform_filter(genre_select)
    .transform_filter(brush)
)

chart = alt.layer(bars, line, data=mdf).properties(width=200, height=400)

save(chart, "bars.html", embed_options={"actions": True})
chart
例えば、学生番号ID007 の成績を表示させたい場合は以下のように選択すればよい。
学生番号ID007 の国語と数学の平均点を知りたい場合は、さらに国語と数学の区間をドラッグで選択する。
散布図と棒グラフの連携
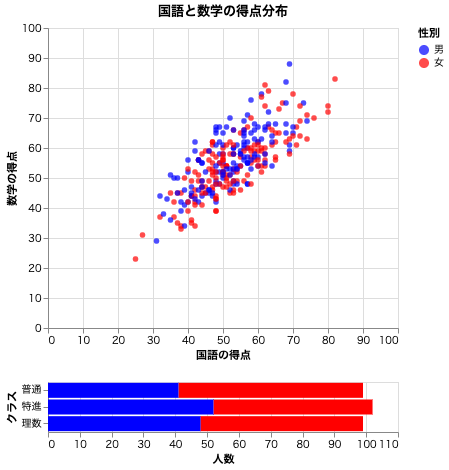
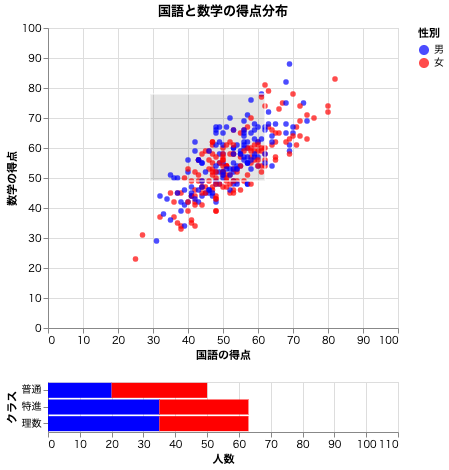
散布図でドラッグした範囲に存在するプロットの数を棒グラフで可視化することができる。
import altair as alt
from altair_saver import save

brush = alt.selection(type="interval")

select_scatter = (
    alt.Chart(df)
    .mark_circle(size=30)
    .encode(
        x=alt.X("国語", scale=alt.Scale(domain=[0, 100]), axis=alt.Axis(title="国語の得点")),
        y=alt.Y("数学", scale=alt.Scale(domain=[0, 100]), axis=alt.Axis(title="数学の得点")),
        color=alt.Color(
            "性別",
            scale=alt.Scale(domain=sex, range=["blue", "red"]),
        ),
        tooltip=["国語", "数学"],
    )
    .properties(width=300, height=300, title="国語と数学の得点分布")
    .add_selection(brush)
    .properties(width=350, height=300)
)

selected_bars = (
    alt.Chart(df)
    .mark_bar()
    .encode(
        y="クラス:N",
        color=alt.Color(
            "性別",
            scale=alt.Scale(domain=sex, range=["blue", "red"]),
        ),
        x=alt.X("count(クラス):Q", title="人数", scale=alt.Scale(domain=[0, 110])),
    )
    .transform_filter(brush)
    .properties(width=350, height=50)
)

chart = alt.vconcat(select_scatter, selected_bars, data=df)

save(chart, "selection_histgram.html", embed_options={"actions": True})
散布図で何も指定しない場合、散布図全体のプロットの数が棒グラフで表示される。
特定の範囲をドラッグで指定すると、その範囲にあるプロットの数が棒グラフで表示される。
時系列データの作成
今回は、架空の店舗における商品A、商品B、商品C の販売数と購買年齢層を月ごとに調査するために以下のデータセットを用意した。
import datetime
import numpy as np
import pandas as pd

np.random.seed(1)  # 乱数の固定

goods_list = ["商品A", "商品B", "商品C"]  # 調査対象の商品
sex_list = ["男", "女"]

t = []  # 時刻リスト
g = []  # 商品リスト
a = []  # 年齢リスト
s = []  # 性別リスト

# 2000 年の元日からの 1 年間でシミュレーションを行う。
time = datetime.datetime(2000, 1, 1, 0)

while time.year == 2000:
    # 顧客の来店をガンマ分布でシミュレーション
    # 冬に来客数が増えるように調整
    gamma = 0.5 * (12 - abs(time.month - 6))
    time += datetime.timedelta(hours=np.round(np.random.gamma(gamma)))
    ## 営業時間を 9:00 ~ 21:00 とする。
    ## それ以外に来客した場合、来客時間を 12 時間先送りにする。
    if 21 < time.hour or time.hour < 9:
        time += datetime.timedelta(hours=12)
    t.append(time)

    # 顧客がどの商品を選ぶのかをランダムで決める
    goods = np.random.choice(goods_list, p=[0.6, 0.3, 0.1])
    g.append(goods)

    # 商品購入者の年齢をシミュレーション
    if goods == "商品A":
        age = np.round(np.random.normal(35, 15))
    elif goods == "商品B":
        age = np.round(np.random.normal(50, 20))
    else:
        age = np.round(np.random.normal(65, 10))
    a.append(age)

    # 商品購入者の性別をシミュレーション
    if goods == "商品A":
        sex = np.random.choice(sex_list, p=[0.75, 0.25])
    elif goods == "商品B":
        sex = np.random.choice(sex_list, p=[0.4, 0.6])
    else:
        sex = np.random.choice(sex_list, p=[0.2, 0.8])
    s.append(sex)

    # 2001 年になったらシミュレーションを終了する。
    if time.year == 2001:
        break

df = pd.DataFrame()
df["来客時間"] = t
df["購入商品"] = g
df["年齢"] = a
df["性別"] = s
df = df[:-1]

print(df)
来客時間 カラムのオブジェクトが datetime 型 であることに注意しよう。
 来客時間 購入商品    年齢 性別
0    2000-01-01 19:00:00  商品A  26.0  男
1    2000-01-01 21:00:00  商品A  10.0  男
2    2000-01-02 13:00:00  商品B  45.0  女
3    2000-01-02 15:00:00  商品B  54.0  女
4    2000-01-02 21:00:00  商品B  28.0  男
...                  ...  ...   ... ..
999  2000-12-30 20:00:00  商品A  46.0  男
1000 2000-12-31 10:00:00  商品B  42.0  女
1001 2000-12-31 14:00:00  商品B  85.0  女
1002 2000-12-31 17:00:00  商品A  59.0  男
1003 2000-12-31 21:00:00  商品B  36.0  女
時系列データの可視化
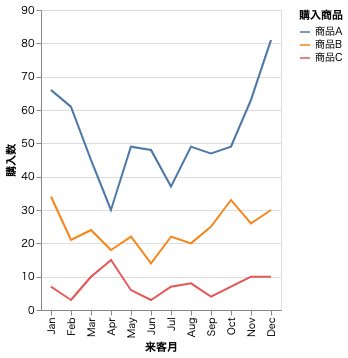
折れ線グラフ
import altair as alt
from altair_saver import save

line = (
    alt.Chart(df)
    .mark_line()
    .encode(
        x=alt.X("month:O", timeUnit="month", title="来客月"),
        y=alt.Y("count(購入商品)", title="購入数"),
        color="購入商品",
    )
    .transform_timeunit(month="month(来客時間)")
)

save(line, "line.html", embed_options={"actions": True})
| クラス | 引数の意味 |
|---|---|
| .mark_line() | 折れ線グラフ全体の情報。線の種類や太さなどを指定できる。 |
| .transform_timeunit() | datetime 型のオブジェクトを日、週、月、年などの区分に変換する。 |
【ポイント】 alt.X(month:O) というように :O をつけると要素に順序がつく。時系列データの可視化では重要なテクニックである。
折れ線グラフ(エラーバンドあり)
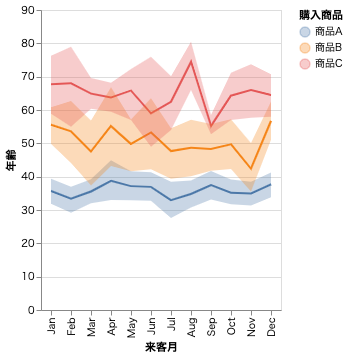
今回は 95% 信頼区間でエラーバンドをつけてみる。
import altair as alt
from altair_saver import save

line = (
    alt.Chart()
    .mark_line()
    .encode(
        x=alt.X("month:O", timeUnit="month", title="来客月"),
        y=alt.Y("mean(年齢)", title="年齢"),
        color="購入商品",
    )
    .transform_timeunit(month="month(来客時間)")
)

band = (
    alt.Chart()
    .mark_errorband(extent="ci")
    .encode(
        x=alt.X("month:O", timeUnit="month", title="来客月"),
        y=alt.Y("年齢", title="年齢"),
        color="購入商品",
    )
    .transform_timeunit(month="month(来客時間)")
)

chart = alt.layer(line, band, data=df)

save(chart, "errorband.html", embed_options={"actions": True})
| クラス | 引数の意味 |
|---|---|
| mark_errorband() | エラーバンドの設定 |
