Streamlit とは
本稿では、Streamlit の使い方を説明する。
Streamlit とは、フロントエンドアプリケーションを作成できる python のフレームワークである。Pandas の DataFrame や、 plotly・altair といった描画ライブラリで作成したグラフを埋め込むことができ、工夫次第でデータ分析にも応用することができる。
環境
- macOS Catalina (ver.10.15.6)
インストール
いくつかの方法でインストールすることできる。
- pip でインストールする。公式HP推奨
pip install streamlit
- conda で仮想環境を構築する。公式Forum参照
conda create -y -n streamlit python=3.7
conda activate streamlit
pip install streamlit
ファイルの実行
Python ファイルを以下のように実行する。
streamlit run ファイル名.py
Streamlit の機能
公式 HP の API reference に、streamlit の機能がまとめられている。その中でデータ分析に活用できる機能を中心にまとめた。
タイトルの表示
import streamlit as st
st.title('My app')

文書の表示
import streamlit as st
st.write("Good morning")

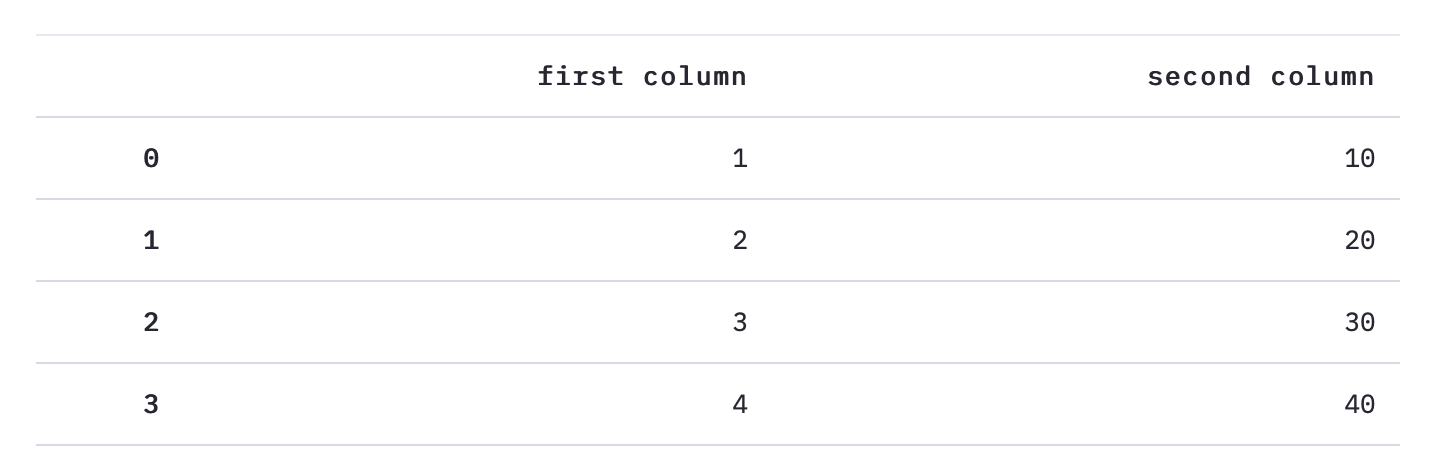
DataFrame の表示
import streamlit as st
import pandas as pd
st.table(pd.DataFrame({
    'first column': [1, 2, 3, 4],
    'second column': [10, 20, 30, 40]
}))
Markdown の表示
import streamlit as st
st.markdown('# Markdown documents')
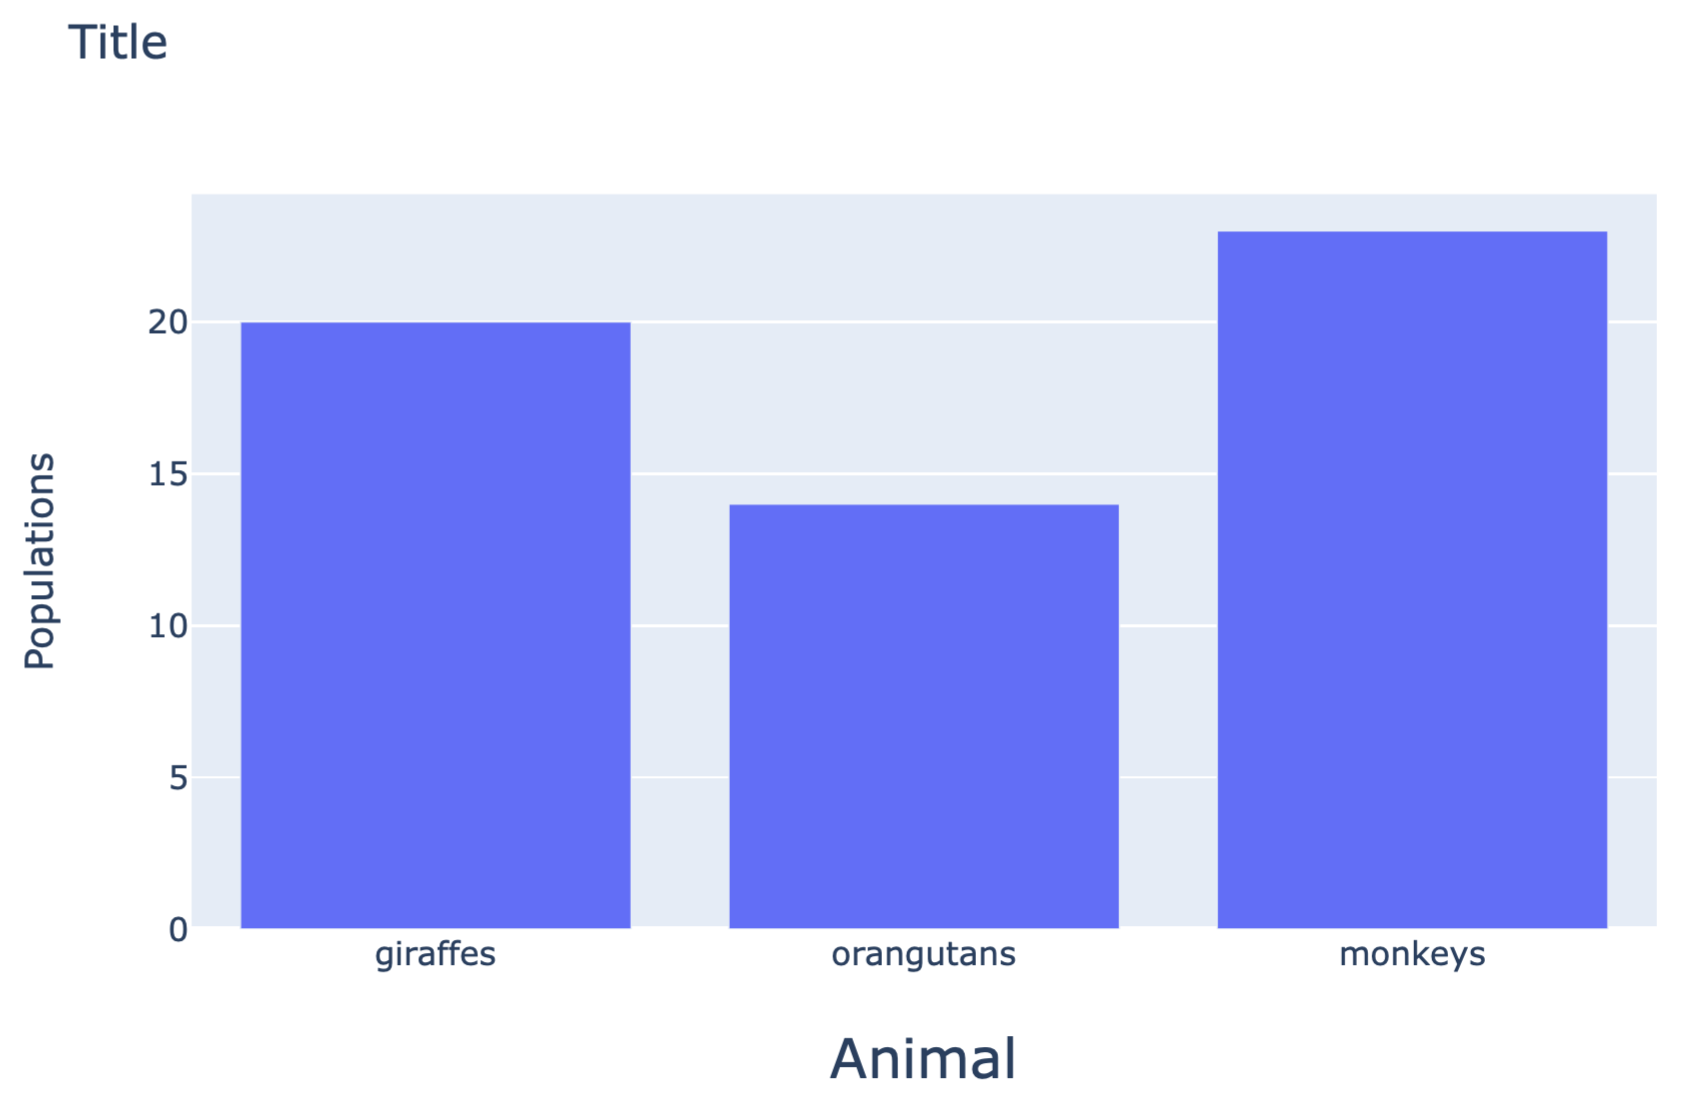
Plotly の表示
Plotlyは、python 描画ライブラリのひとつで、様々な種類のグラフを作成できる。
import streamlit as st
import plotly.graph_objs as go

animals = ['giraffes', 'orangutans', 'monkeys']
populations = [20, 14, 23]

fig = go.Figure(data=[go.Bar(x=animals, y=populations)])

fig.update_layout(
    xaxis = dict(
        tickangle = 0,
        title_text = "Animal",
        title_font = {"size": 20},
        title_standoff = 25),
    yaxis = dict(
        title_text = "Populations",
        title_standoff = 25),
    title ='Title')

st.plotly_chart(fig, use_container_width=True)
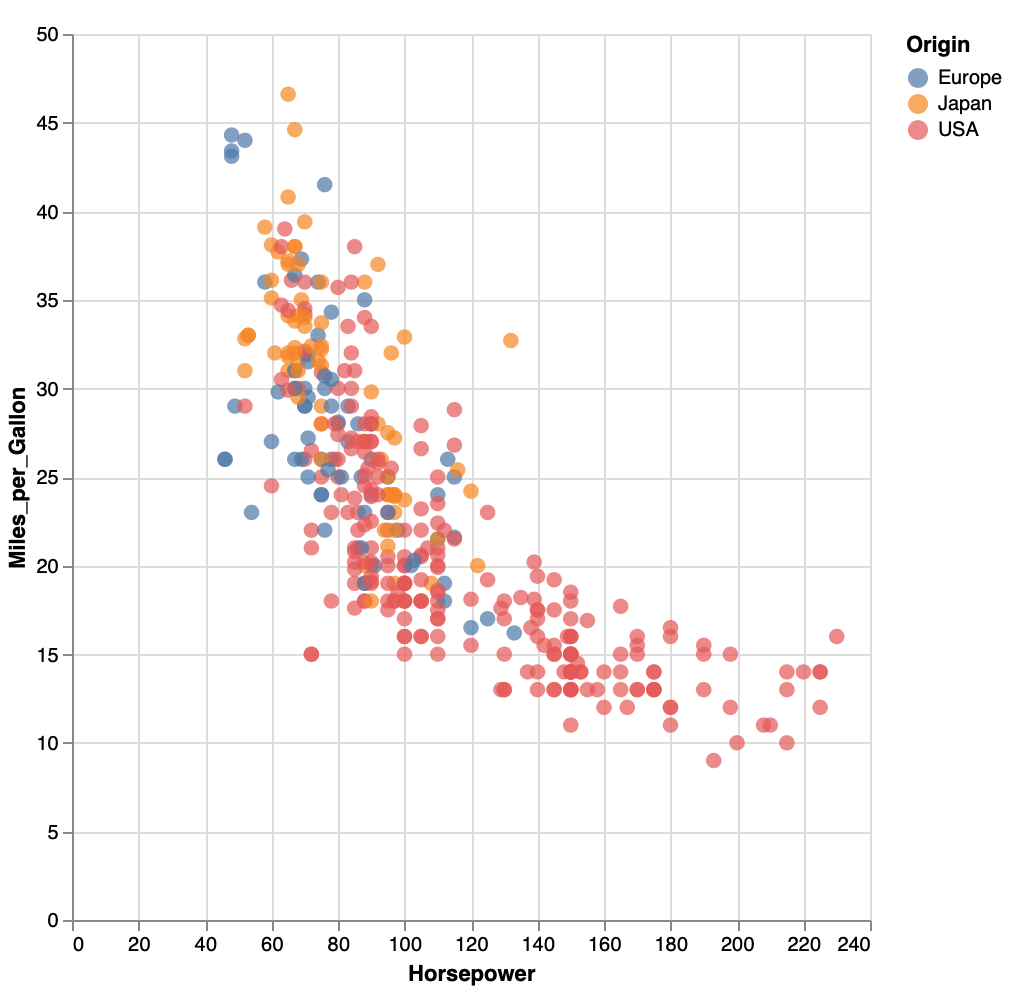
Altair の表示
Altair は、python 描画ライブラリのひとつで、様々な種類のグラフを作成できる。Pandas の DataFrame でデータを入力するのが特徴である。【Python】グラフ作成ライブラリ Altair の使い方
import streamlit as st
import altair as alt
from vega_datasets import data

source = data.cars()

fig = alt.Chart(source).mark_circle(size=60).encode(
    x='Horsepower',
    y='Miles_per_Gallon',
    color='Origin',
    tooltip=['Name', 'Origin', 'Horsepower', 'Miles_per_Gallon']
).properties(
    width=500,
    height=500
).interactive()

st.write(fig)
ボタンの表示
Altair は bool 型を返すボタンを表示させることができる。
import streamlit as st
answer = st.button('Say hello')

if answer == True:
     st.write('Why hello there')
else:
     st.write('Goodbye')
【押す前】

【押した後】

チェックボタンの表示
bool 型を返すチェックボタンの表示も可能である。
import streamlit as st
agree = st.checkbox('I agree')

if agree == True :
     st.write('Great!')
【チェックなし】

【チェックあり】

ラジオボタンの表示
ラジオボタンで要素を選択することも可能である。
import streamlit as st
genre = st.radio(
     "What's your favorite movie genre",
     ('Comedy', 'Drama', 'Documentary'))

if genre == 'Comedy':
     st.write('You selected comedy.')
else:
     st.write("You didn't select comedy.")

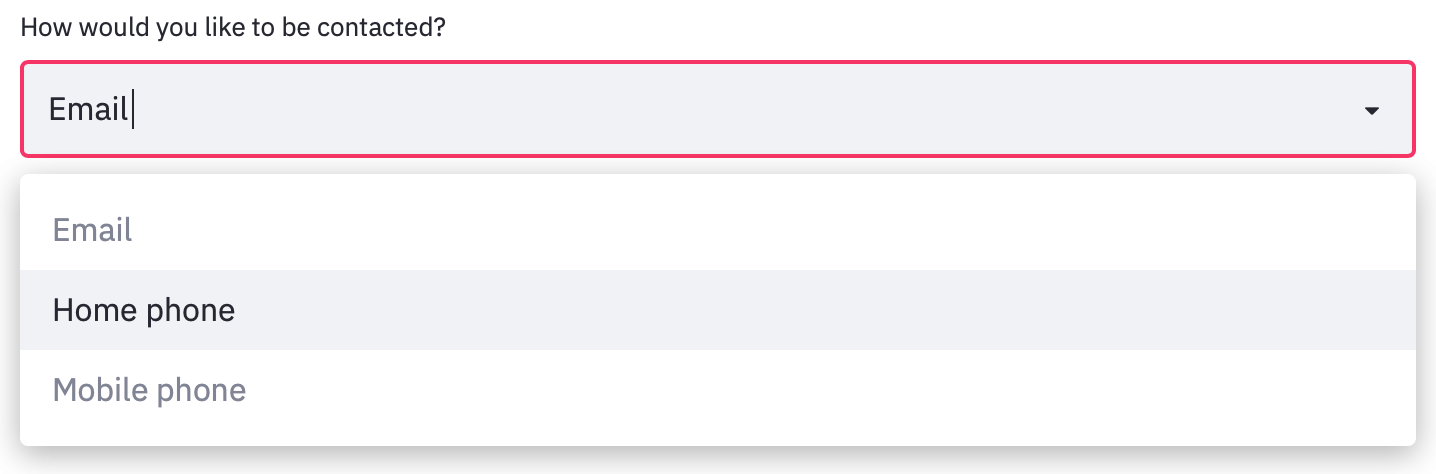
ドロップダウンの表示
ドロップダウンから1つだけ選択する場合は以下のとおり。
import streamlit as st
option = st.selectbox(
    'How would you like to be contacted?',
     ('Email', 'Home phone', 'Mobile phone'))
st.write('You selected:', option)
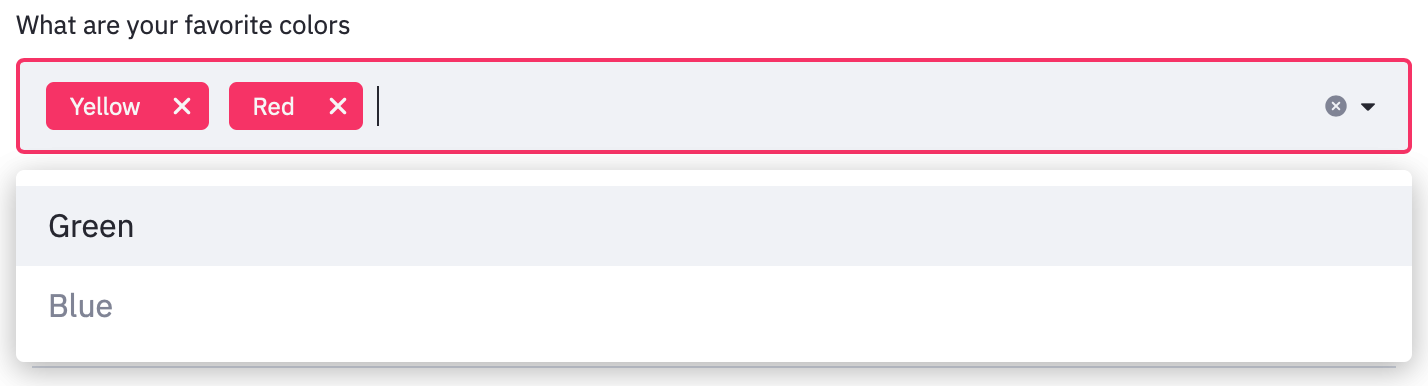
ドロップダウンから2つ以上同時に選択する場合は以下のとおり。デフォルトで Yellow, Redの2つが選択されている。
import streamlit as st
options = st.multiselect(
    'What are your favorite colors',
    ['Green', 'Yellow', 'Red', 'Blue'],
    ['Yellow', 'Red'])

st.table(options)
スライダーの表示
1 つの値を選択する場合は以下のとおり。
以下の例では、最小値0、最大値130、間隔1、初期値25 で動くスライダーを表示させる。
import streamlit as st
age = st.slider('How old are you?',  min_value=0, max_value=130, step=1, value=25)
st.write("I'm ", age, 'years old')

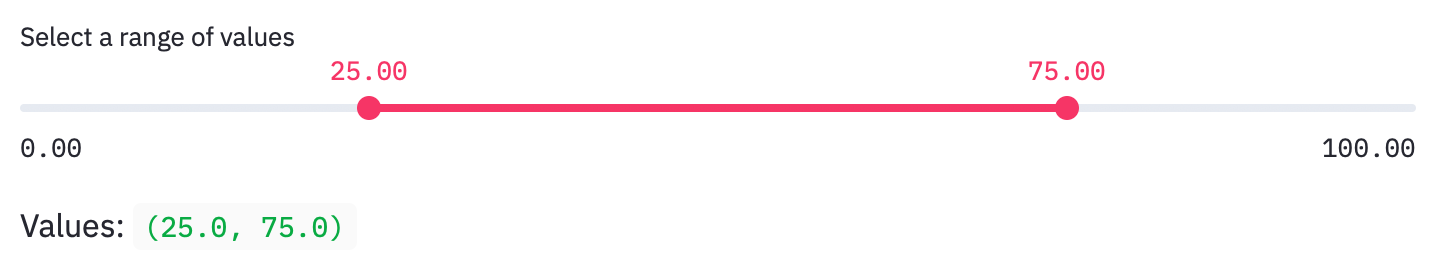
2 つの値を選択する場合は以下のとおり。
以下の例では、最小値0.0、最大値100.0、初期値(25.0,75.0)で動くスライダーを表示させる。
import streamlit as st
values = st.slider(
    'Select a range of values',
   0.0, 100.0, (25.0, 75.0))
st.write('Values:', values)