目的
本項では Kaggle に登録されている売上原価の集計・可視化に取り組む。このデータセットにはある会社の支店 A、B、C の売上原価(三ヶ月分)が含まれている。需要予測等のデータ分析実務に近づけるため、支店間の売上原価を比較するダッシュボードの作成を目的とする。今回は streamlit を用いて、集計時のパラメータを GUI で操作できる interactive な図を作成する。
データの形式
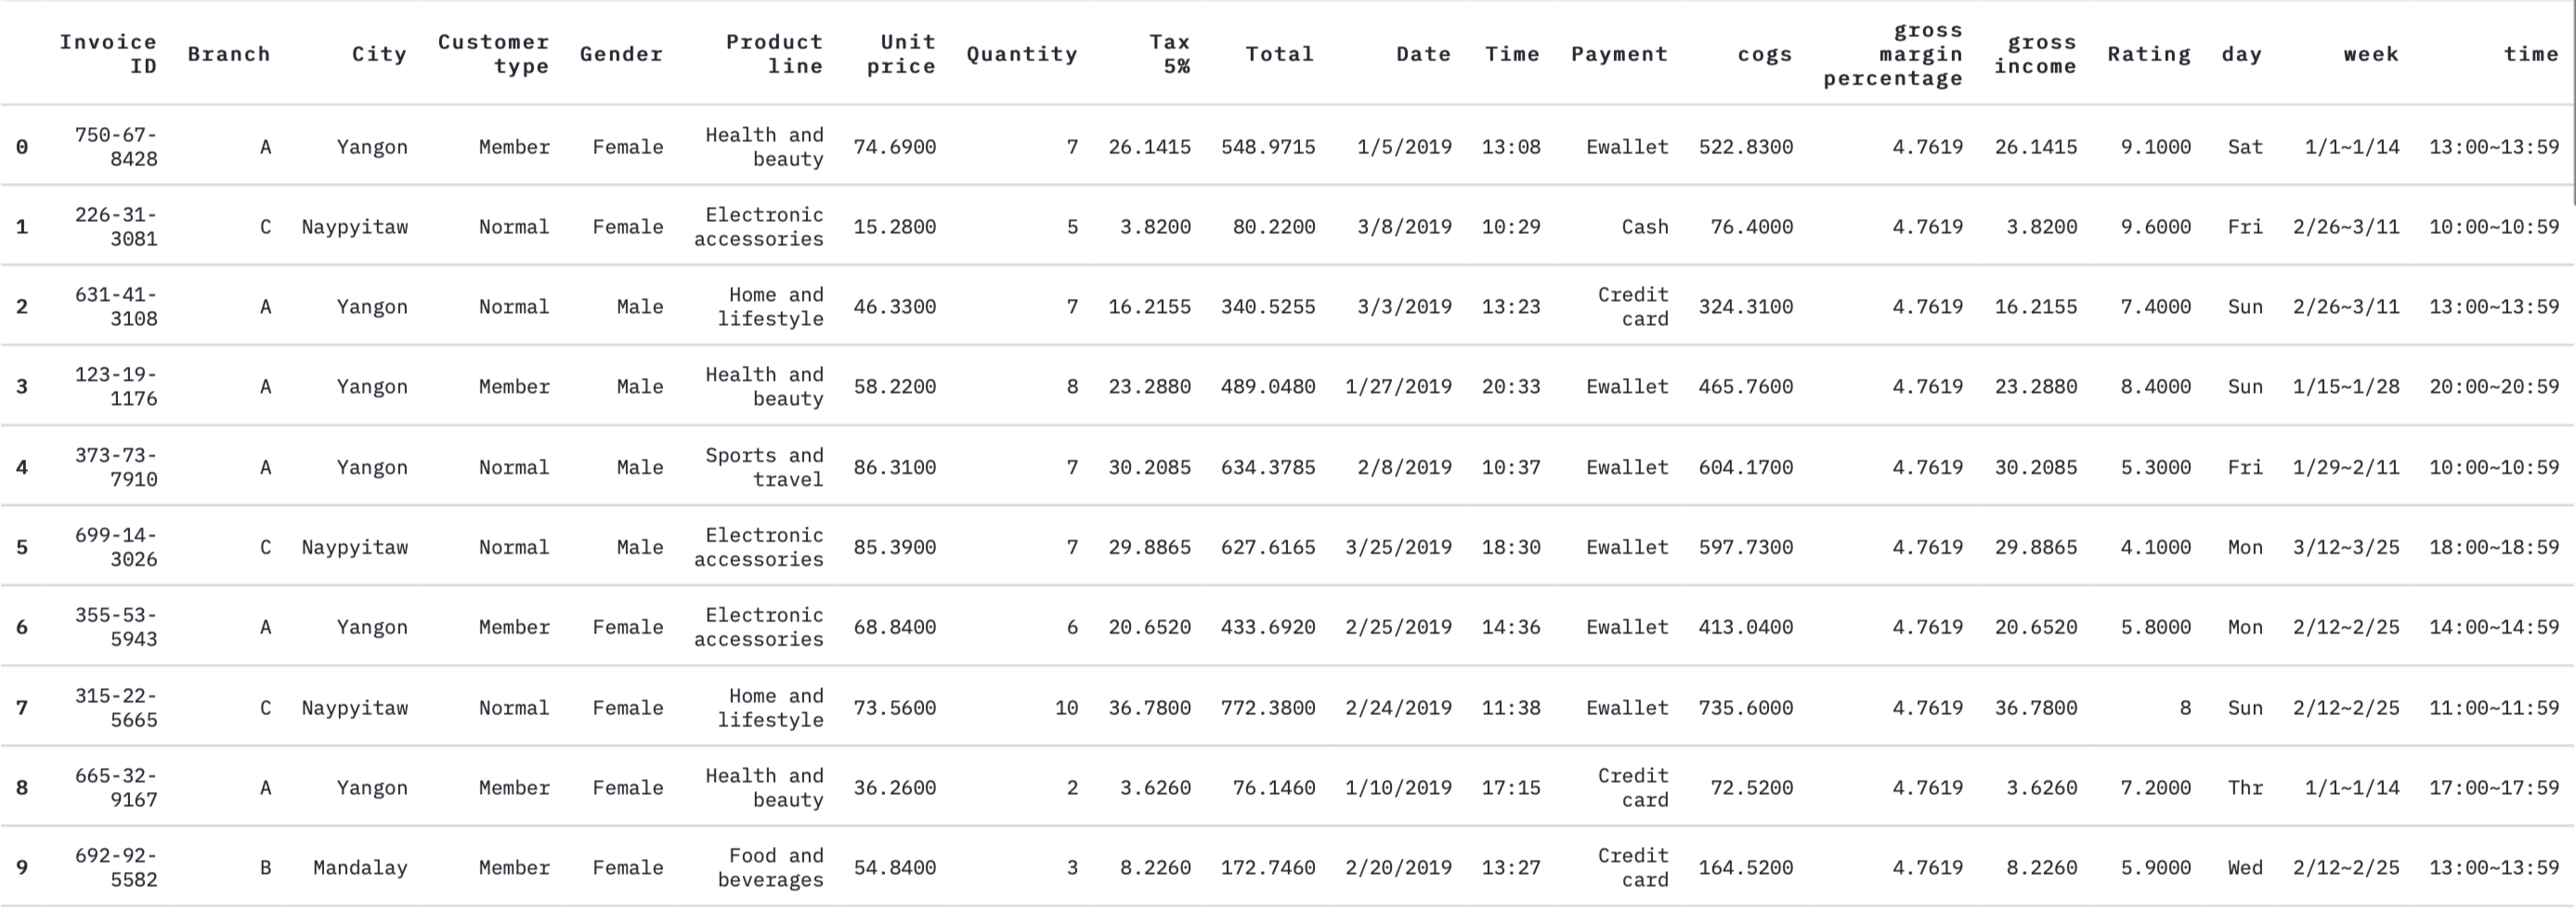
以下のように請求書単位で売上原価(cost of goods sold)の履歴が記録されている。

ちなみに売上原価は次のように計算される。
(cogs)=(Unit Price)×(Quantity)
データの前処理
売上原価の時系列変化を調べるために購入時期を表す列 week を追加し、売上の周期性を調べるために曜日列 day 時間帯列 time を追加する。
import re
import streamlit as st
import pandas as pd
import altair as alt

df = pd.read_csv('supermarket_sales - Sheet1.csv')

date = []
week = []
for c in df['Date']:
    c = re.findall(r'\d+', c)
    m,d = int(c[0]),int(c[1])

    if m == 3:
        d += (31+28) # 三月某日には一月と二月の日数を加える。
    elif m == 2:
        d += 31 # 二月某日には一月の日数を加える。

    d += -1

    # 2019年1月1日は火曜日
    if d%7 == 6: tmp = 'Mon'
    elif d%7 == 0: tmp = 'Tue'
    elif d%7 == 1: tmp = 'Wed'
    elif d%7 == 2: tmp = 'Thr'
    elif d%7 == 3: tmp = 'Fri'
    elif d%7 == 4: tmp = 'Sat'
    elif d%7 == 5: tmp = 'Sun'
    date.append(tmp)

    if d//14 == 0: tmp = '1/1~1/14'
    elif d//14 == 1: tmp = '1/15~1/28'
    elif d//14 == 2: tmp = '1/29~2/11'
    elif d//14 == 3: tmp = '2/12~2/25'
    elif d//14 == 4: tmp = '2/26~3/11'
    elif d//14 == 5: tmp = '3/12~3/25'
    elif d//14 == 6: tmp = '3/26~3/31' # 最終期は他より短いことに注意
    week.append(tmp)

df['day'] = date
df['week'] = week

time = []
for c in df['Time']:
    c = re.findall(r'\d+', c)
    t = c[0] + ':00~' + c[0] +':59'
    time.append(t)

df['time'] = time

st.table(df.head(10))
支店間推移
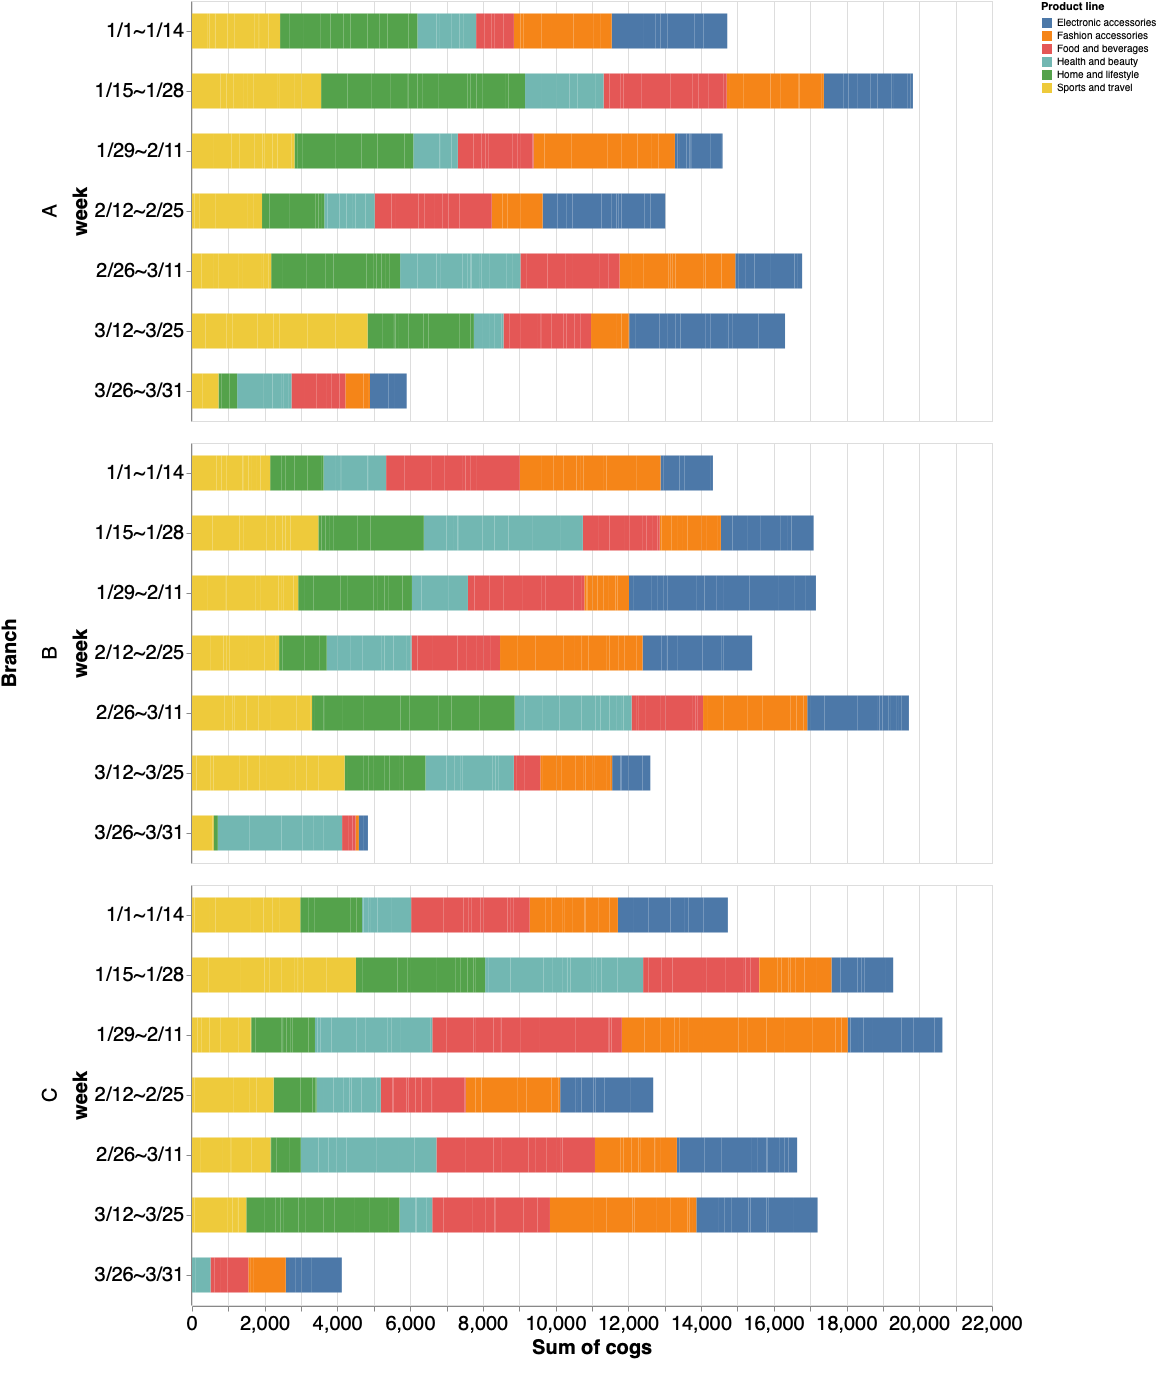
まずは直近の動向を調べてみる。
st.markdown('# 支店別売上推移')

stacked_bar = alt.Chart(df).mark_bar(size=35).encode(
        x=alt.X('sum(cogs)',axis=alt.Axis(labelFontSize=20, ticks=True, titleFontSize=20, labelAngle=0)),
        y=alt.Y('week', axis=alt.Axis(labelFontSize=20, ticks=True, titleFontSize=20, labelAngle=0),sort=['1/1~1/14','1/15~1/28','1/29~2/11','2/12~2/25','2/26~3/11','3/12~3/25','3/26~3/31']),
        color='Product line',
        row = alt.Row('Branch', header=alt.Header(labelFontSize=20, titleFontSize=20)),
        tooltip=['week','Total']
        ).properties(
        width=800,
        height=420,
        )

st.write(stacked_bar)
売上原価分布の比較
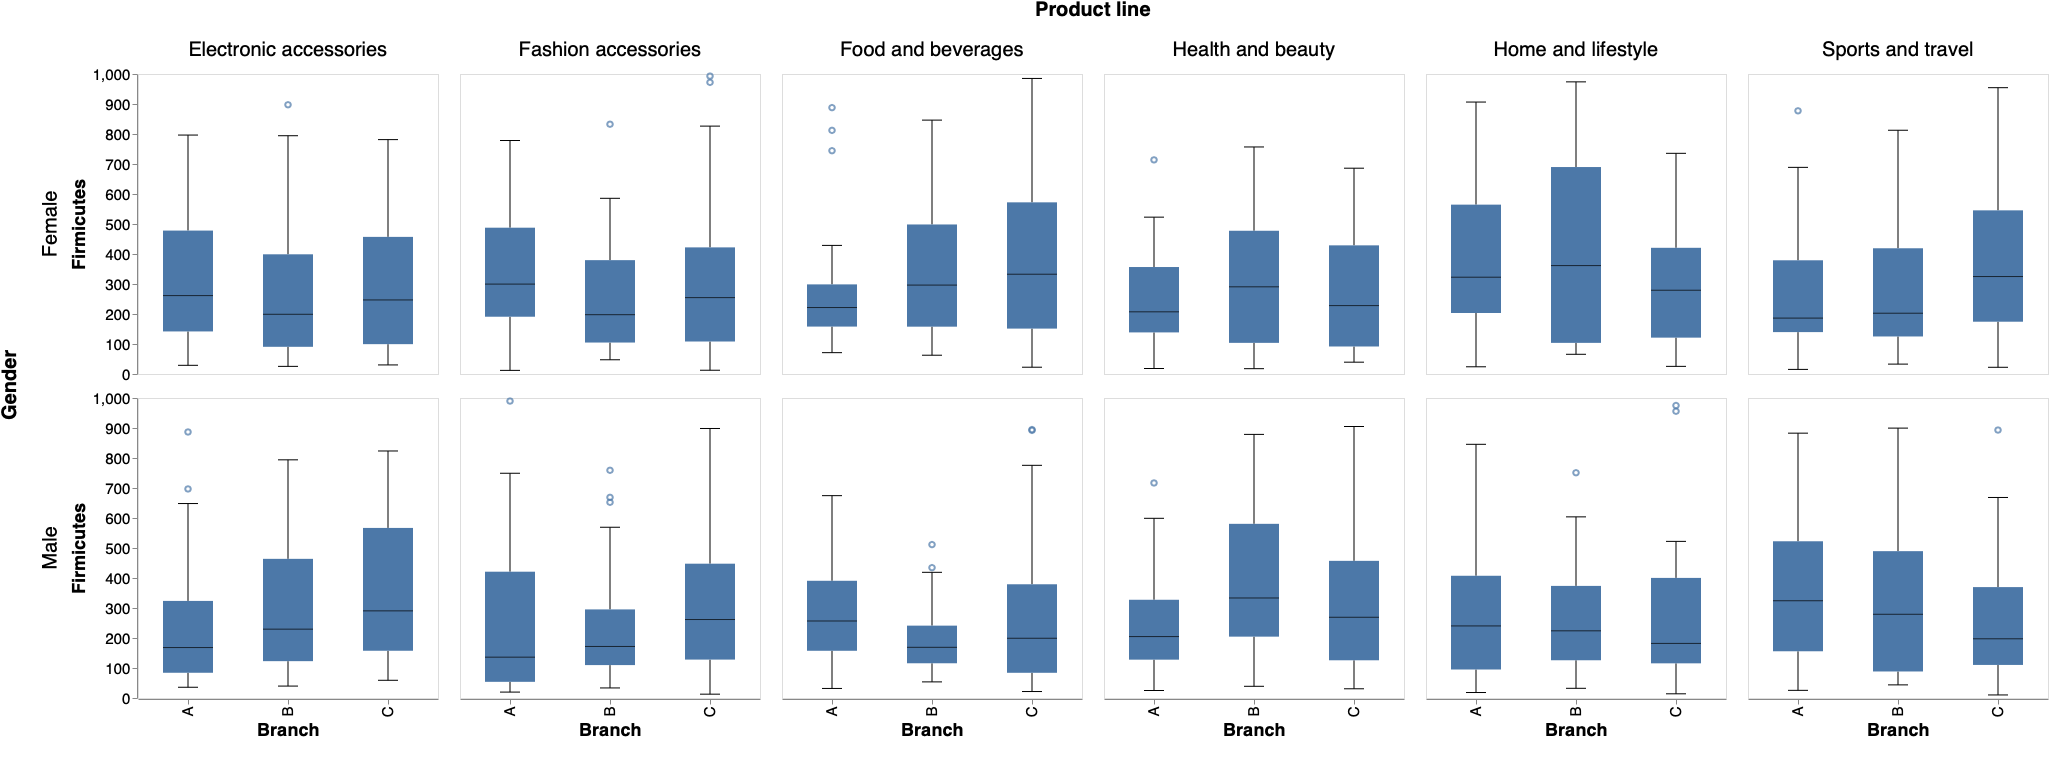
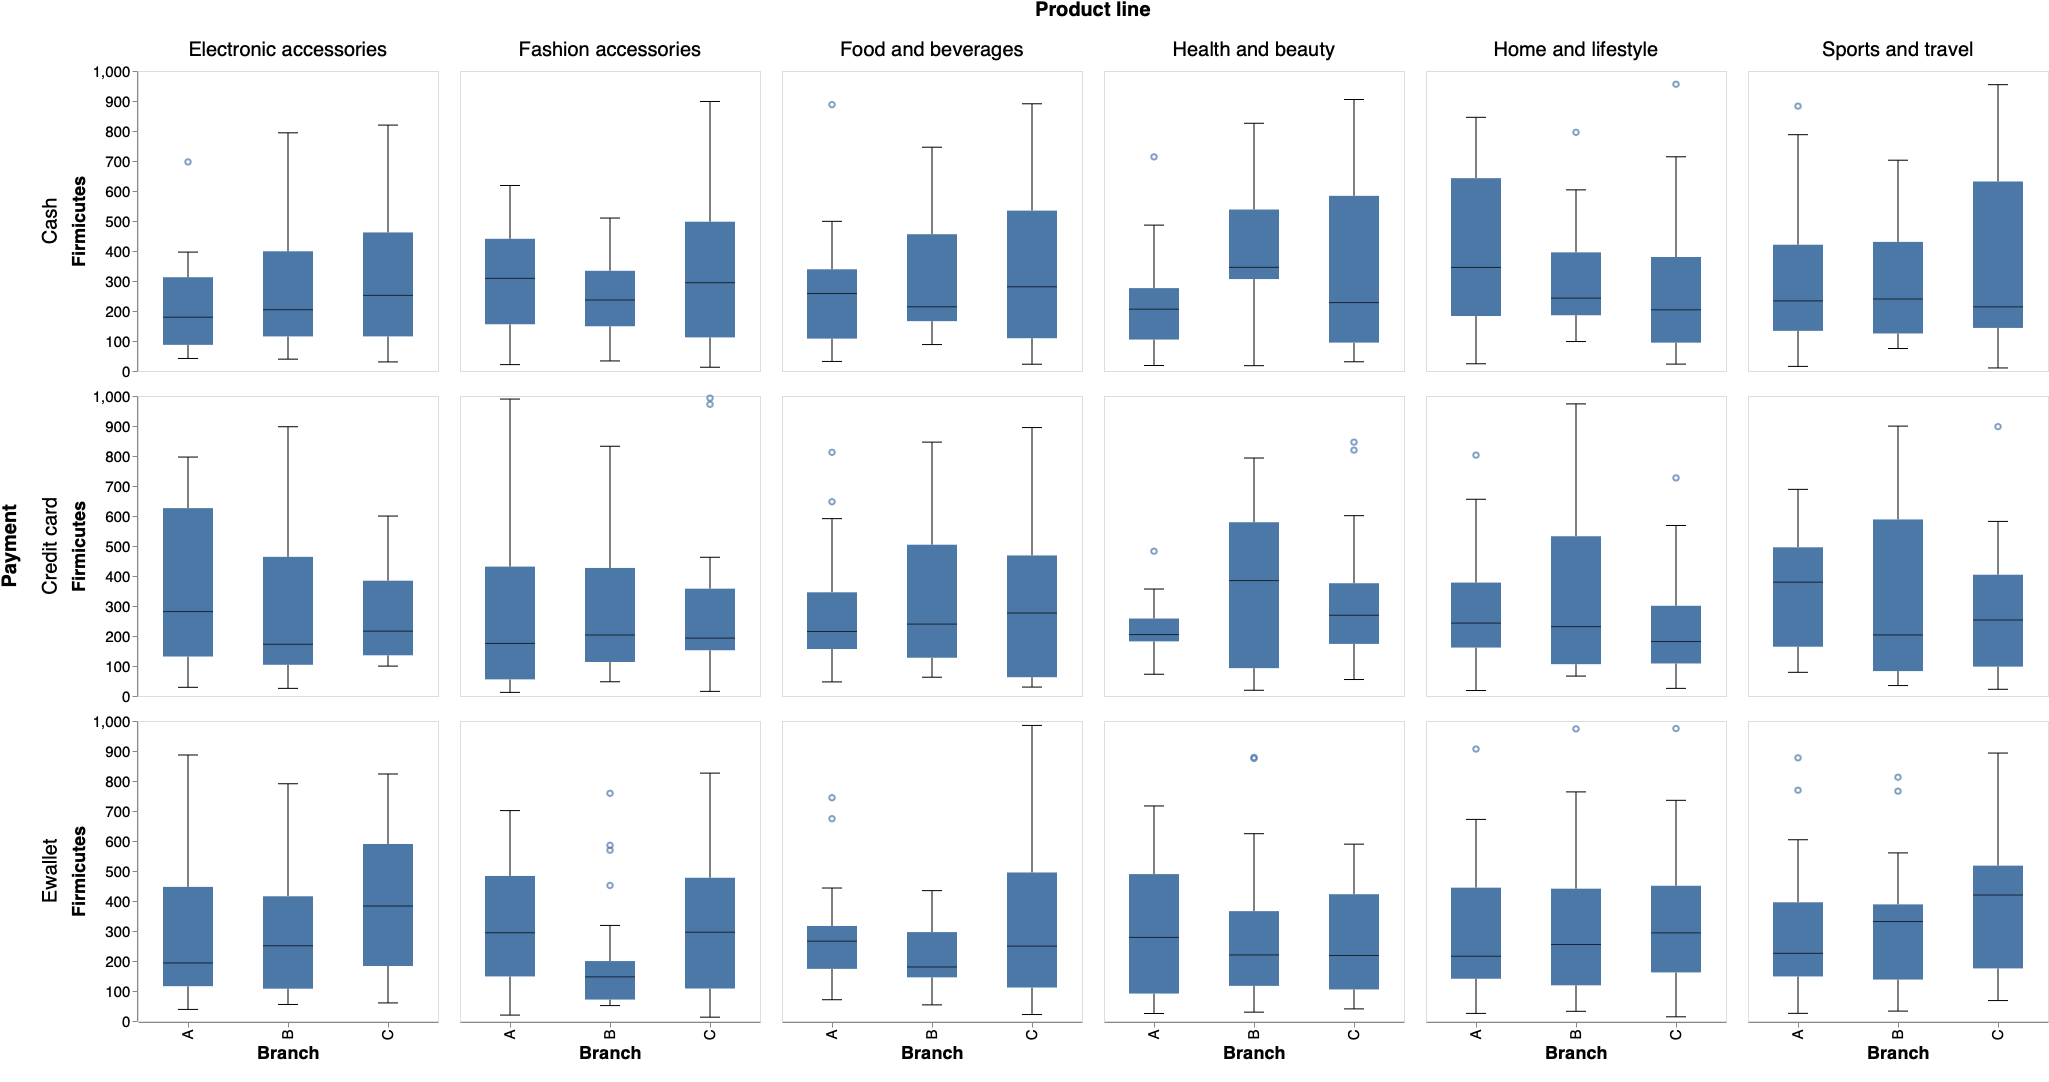
品目別に支店間で売上原価分布を比較する。どのような層に高額商品の需要があるのかを調べたい場合、属性条件をドロップダウンから1つ選択できるようにする。
st.markdown('# 売上原価分布の比較')

cond = st.selectbox(
    '層別条件を選ぶ',
     ('Gender', 'Customer type', 'Payment'))

boxplot = alt.Chart(df).mark_boxplot(size=50,ticks=alt.MarkConfig(width=20), median=alt.MarkConfig(color='black',size=50)).encode(
        x = alt.X('Branch',sort = alt.Sort(['A','B','C']), axis=alt.Axis(labelFontSize=15, ticks=True, titleFontSize=18)),
        y = alt.Y('cogs', axis=alt.Axis(labelFontSize=15, ticks=True, titleFontSize=18, grid=False,domain=True, title='Firmicutes')),
        column = alt.Column('Product line', header=alt.Header(labelFontSize=20, titleFontSize=20)),
        row = alt.Row(cond, header=alt.Header(labelFontSize=20, titleFontSize=20)),
    ).properties(
        width=300,
        height=300,
    )

st.write(boxplot)
ドロップダウンで Gender を選んだ場合は以下のとおり。
ドロップダウンで Payment を選んだ場合は以下のとおり。
売上原価の詳細な比較
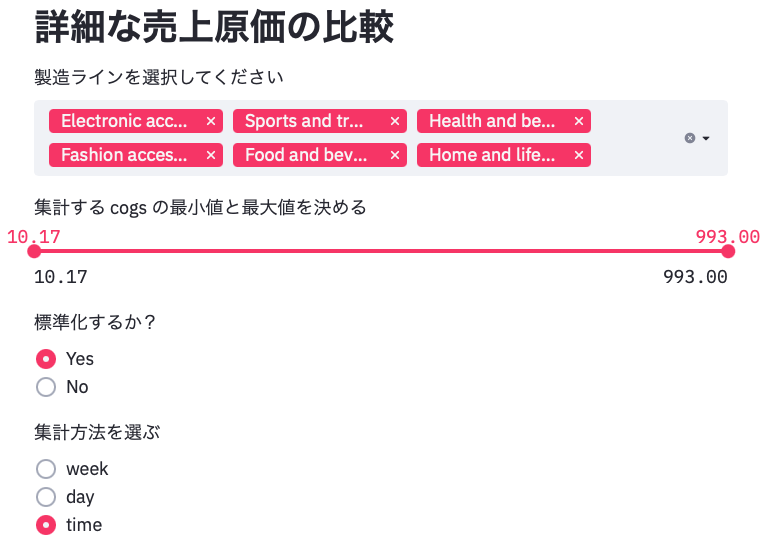
上記の内容を踏まえて支店間で詳細に比較する。多角的に比較できるように次のパラメータを設ける。
- 製造ラインを選択する。特定の製造ラインに着目したい場合は他を除外できる。
- 集計する
cogsの最小値と最大値を決める。スライドバーの範囲外の売上原価は集計しない。外れ値を除外できる。 - 標準化するかどうかを決める。
- 集計方法を選ぶ。
weekは二週間毎、dayは曜日毎、timeは時間帯毎に集計する。
st.markdown('# 詳細な売上原価の比較')

options = st.multiselect(
    '製造ラインを選択してください',
    list(set(df['Product line'])),
    list(set(df['Product line'])))

df = df[df['Product line'].isin(options)]

values = st.slider(
    '集計する cogs の最小値と最大値を決める',
   min(df['cogs']), max(df['cogs']), (min(df['cogs']), max(df['cogs'])))

df = df[(values[0] <= df['cogs']) & (values[1] >= df['cogs'])]

norm = st.radio("標準化するか?",
     ('Yes','No'))

axis = st.radio("集計方法を選ぶ",
     ('week','day','time'))

if axis == 'week':
    sort =['1/1~1/14','1/15~1/28','1/29~2/11','2/12~2/25','2/26~3/11','3/12~3/25','3/26~3/31']
elif axis == 'day':
    sort =['Mon','Tue','Wed','Thr','Fri','Sat','Sun']
elif axis == 'time':
    sort =['10:00~10:59','11:00~11:59','12:00~12:59','13:00~13:59','14:00~14:59','14:00~14:59','15:00~15:59','16:00~16:59','17:00~17:59','18:00~18:59','19:00~19:59','20:00~20:59']

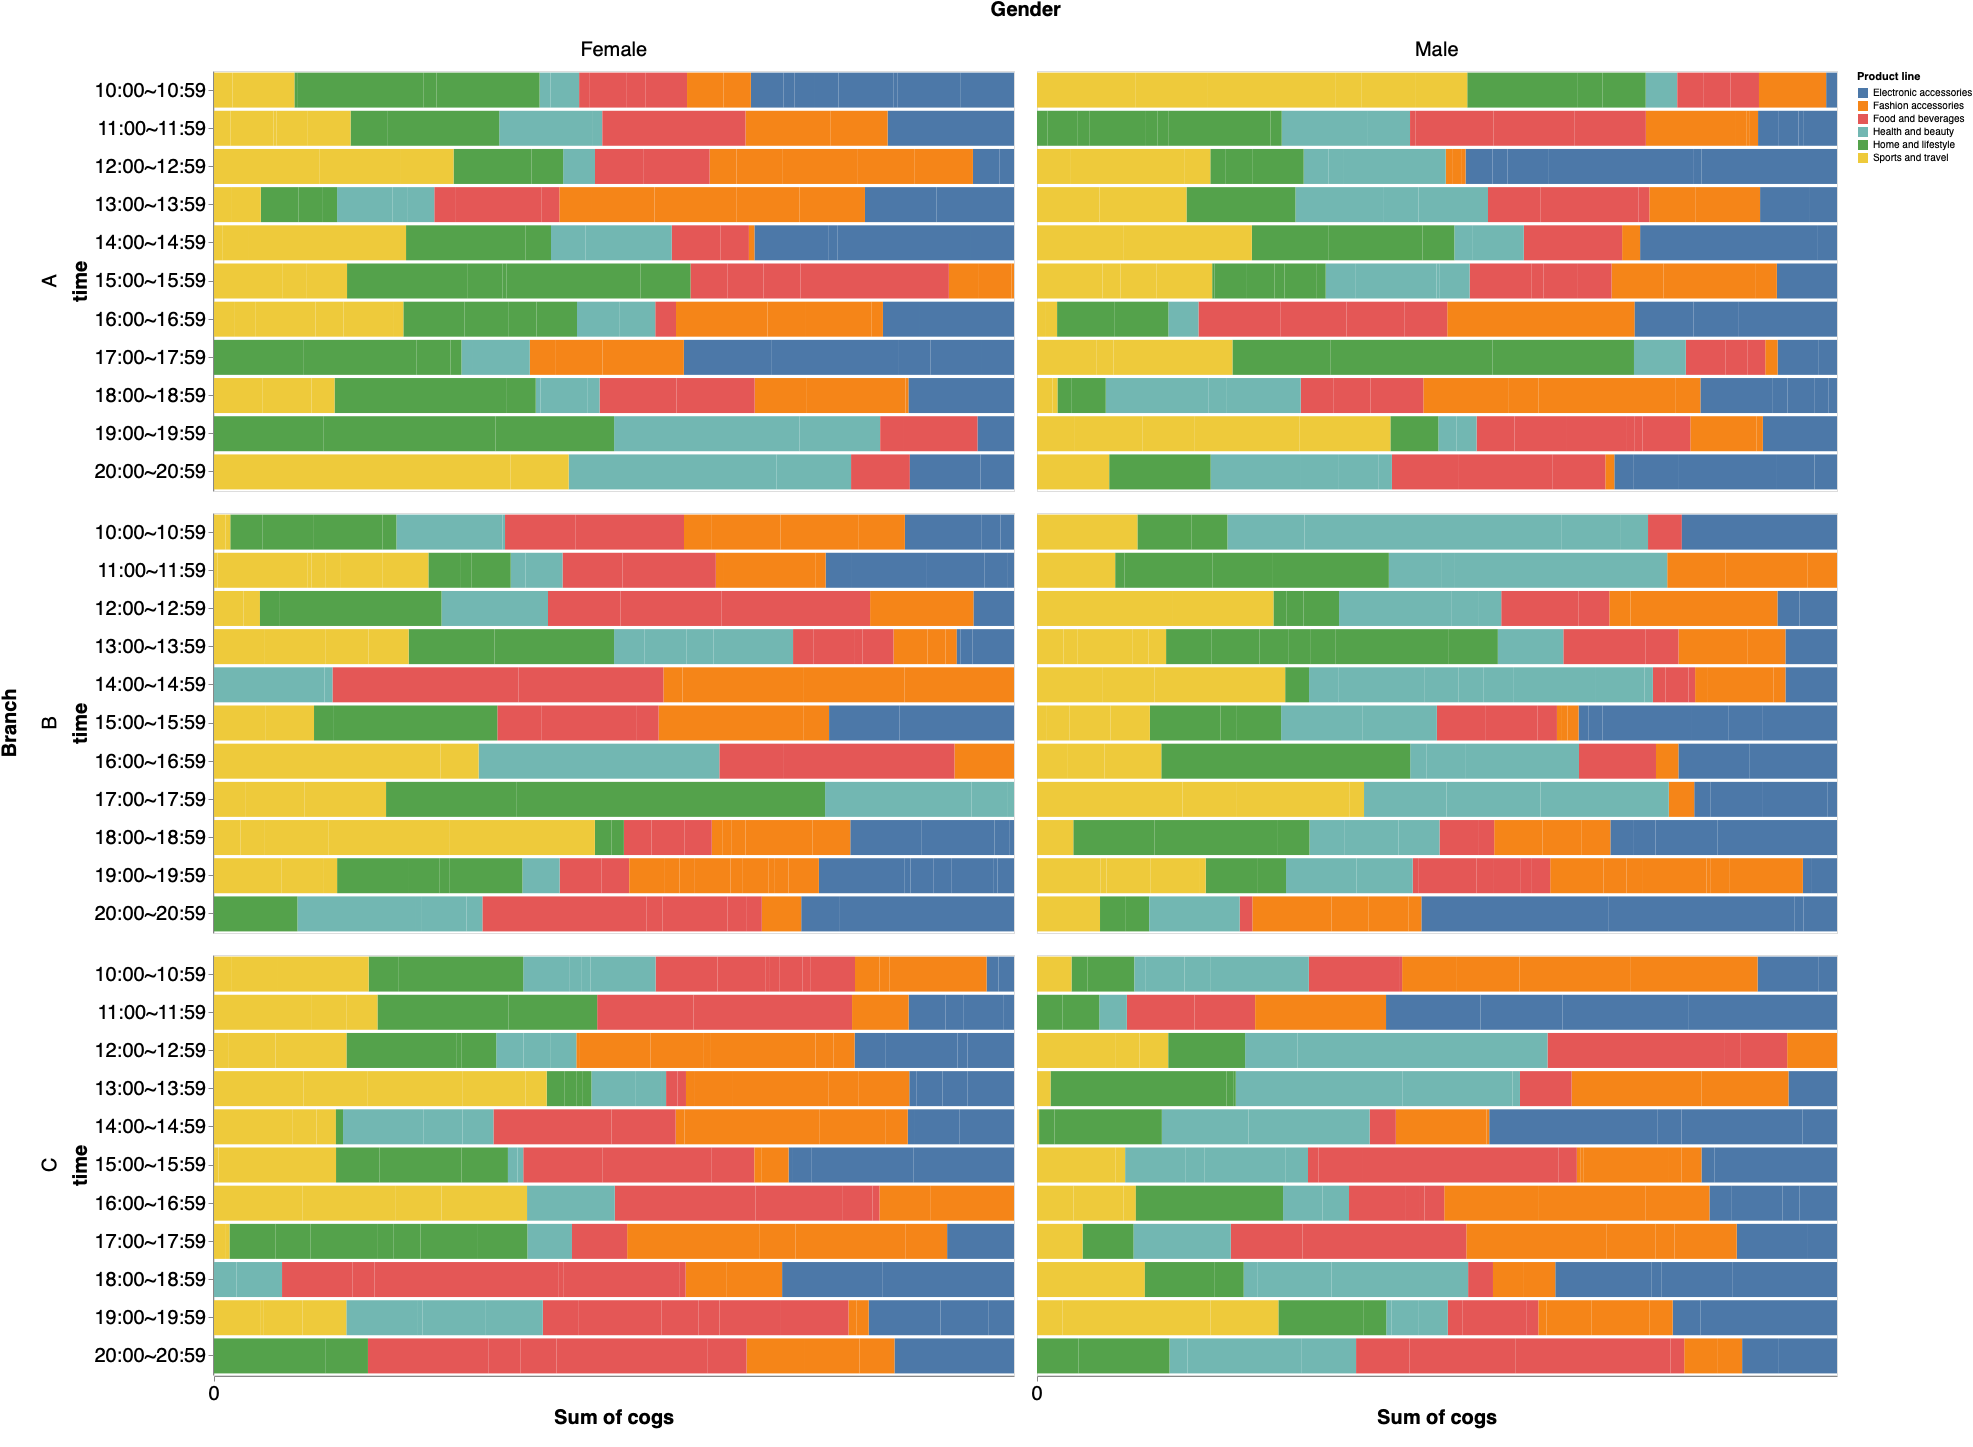
st.markdown('## 組成の可視化')

if norm == 'Yes':
    stacked_bar = alt.Chart(df).mark_bar(size=35).encode(
        x=alt.X('sum(cogs)',axis=alt.Axis(labelFontSize=20, ticks=True, titleFontSize=20, labelAngle=0),stack="normalize"),
        y=alt.Y(axis, axis=alt.Axis(labelFontSize=20, ticks=True, titleFontSize=20, labelAngle=0),sort=sort),
        color='Product line',
        column = alt.Column(cond, header=alt.Header(labelFontSize=20, titleFontSize=20)),
        row = alt.Row('Branch', header=alt.Header(labelFontSize=20, titleFontSize=20)),
        tooltip=[axis,'cogs']
        ).properties(
        width=800,
        height=420,
        )
else:
    stacked_bar = alt.Chart(df).mark_bar(size=35).encode(
        x=alt.X('sum(cogs)',axis=alt.Axis(labelFontSize=20, ticks=True, titleFontSize=20, labelAngle=0)),
        y=alt.Y(axis, axis=alt.Axis(labelFontSize=20, ticks=True, titleFontSize=20, labelAngle=0),sort=sort),
        color='Product line',
        column = alt.Column(cond, header=alt.Header(labelFontSize=20, titleFontSize=20)),
        row = alt.Row('Branch', header=alt.Header(labelFontSize=20, titleFontSize=20)),
        tooltip=[axis,'cogs']
        ).properties(
        width=800,
        height=420,
        )

st.write(stacked_bar)

st.markdown('## 分布の可視化')

point = alt.Chart().mark_point().encode(
    x=alt.X(axis, axis=alt.Axis(labelFontSize=20, ticks=True, titleFontSize=20, grid=False),sort=sort),
    y=alt.Y('cogs:Q', aggregate='mean', axis=alt.Axis(labelFontSize=20, ticks=True, titleFontSize=20, grid=False,domain=True)),
    color=alt.Color('Product line'),
    ).properties(
    width=400,
    height=400
    )

bar = alt.Chart().mark_errorbar(extent='stderr',ticks=True,orient='vertical').encode(
    x=alt.X(axis, axis=alt.Axis(labelFontSize=20, ticks=True, titleFontSize=20, grid=False),sort=sort),
    y=alt.Y('cogs', type='quantitative', axis=alt.Axis(labelFontSize=20, ticks=True, titleFontSize=20, grid=False,domain=True)),
    color=alt.Color('Product line'),
    ).properties(
    width=400,
    height=400
    )

chart = alt.layer(point, bar, data=df
    ).facet(
    column=alt.Column(cond, header=alt.Header(labelFontSize=20, titleFontSize=20)),
    row = alt.Row('Branch', header=alt.Header(labelFontSize=20, titleFontSize=20))
    )

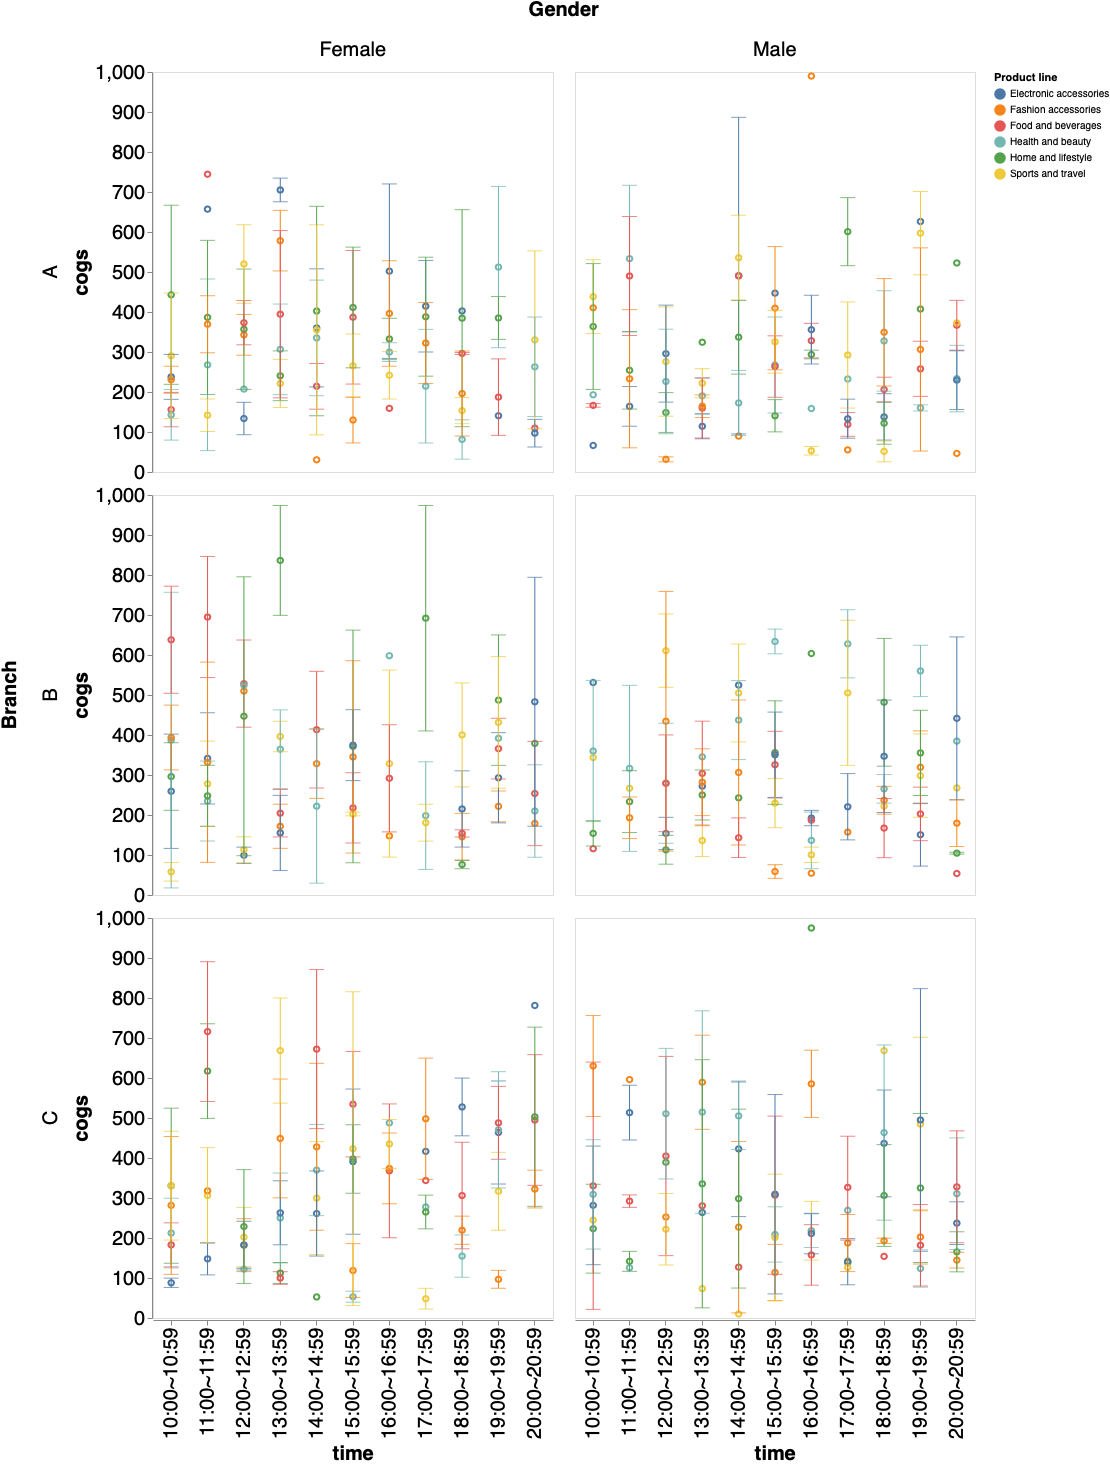
st.write(chart)
組成の可視化
分布の可視化
Streamlit の利点
平均値、中央値、四分位数、標準誤差といった単純な統計量を用いたデータの吟味は、課題の設定や検証に非常に有効である。Streamlit ではこのような統計量を GUI で操作しながら可視化することができる。
Visualization.py のダウンロード
Githubからダウンロードできる。
参考
本稿は [NTT Communications 第七回 TechWorkshop 「データサイエンティストによるデータ分析Workshop」]
(https://www.ntt.com/about-us/recruit/event/event03.html#event07)で取り組んだワークの内容を参考に作成しました。
