概要
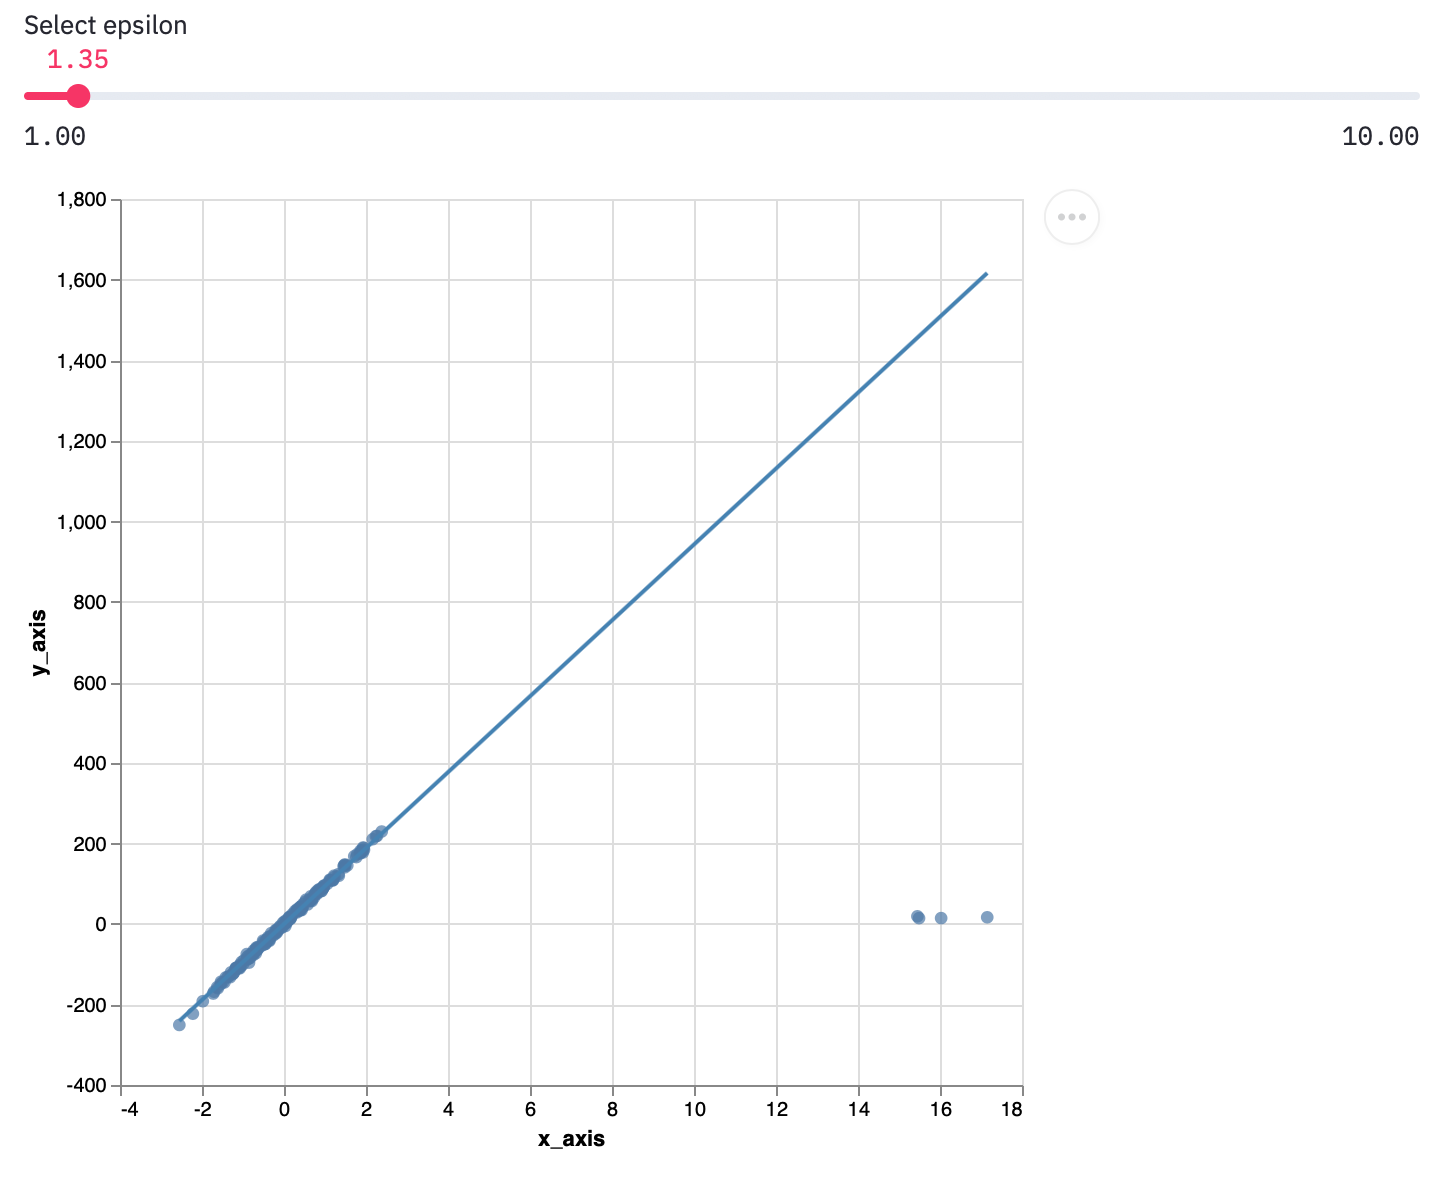
Python の機械学習ライブラリー sckit-learn を用いた、ロバスト線形回帰の描画方法を紹介する。本稿では、python の描画ライブラリ altair でチャートオブジェクトを作成し、Streamlit というアプリケーションフレームワークを使ってブラウザに表示させる。
ロバスト線形回帰の特徴
最小二乗法による線形回帰に比べて、外れ値に影響を受けにくい。
ロバスト線形回帰の作成
HuberRegressor を用いて、ロバスト回帰直線を作成する。
streamlit は、streamlit run ファイル名.py で実行することに注意
streamlit_robust_linear.py
import streamlit as st
import numpy as np
import pandas as pd
import altair as alt
from sklearn.linear_model import HuberRegressor
from sklearn.datasets import make_regression

# デモデータの生成

rng = np.random.RandomState(0)
x, y, coef = make_regression( n_samples=200, n_features=1, noise=4.0, coef=True, random_state=0)
x[:4] = rng.uniform(10, 20, (4, 1))
y[:4] = rng.uniform(10, 20, 4)
df = pd.DataFrame({
    'x_axis': x.reshape(-1,),
    'y_axis': y
     })

# 散布図の生成

plot = alt.Chart(df).mark_circle(size=40).encode(
    x='x_axis',
    y='y_axis',
    tooltip=['x_axis', 'y_axis']
).properties(
    width=500,
    height=500
).interactive()

# ロバスト回帰のパラメータを設定

epsilon = st.slider('Select epsilon',
          min_value=1.00, max_value=10.00, step=0.01, value=1.35)

# ロバスト回帰実行

huber = HuberRegressor(epsilon=epsilon
    ).fit(
    df['x_axis'].values.reshape(-1,1),
    df['y_axis'].values.reshape(-1,1)
    )

# ロバスト線形回帰の係数を取得

a1 = huber.coef_[0]
b1 = huber.intercept_

# 回帰直線の定義域を指定

x_min = df['x_axis'].min()
x_max = df['x_axis'].max()

# 回帰直線の作成

points = pd.DataFrame({
    'x_axis': [x_min, x_max],
    'y_axis': [a1*x_min+b1, a1*x_max+b1],
})

line = alt.Chart(points).mark_line(color='steelblue').encode(
    x='x_axis',
    y='y_axis'
    ).properties(
    width=500,
    height=500
    ).interactive()

# グラフの表示

st.write(plot+line)
パラメータについて
Epsilon は 1 以上の実数で、外れ値の影響度を表す。Default は 1.35 に設定されている。

Epsilon を大きくするほど、外れ値による影響を大きく受ける。(画像は epsilon=10)

最小二乗法による線形回帰直線の作成
HuberRegressor を LinearRegression に置換すると、最小二乗法による線形回帰直線を作成できる。