0
0

Delete article

Deleted articles cannot be recovered.

Draft of this article would be also deleted.

Are you sure you want to delete this article?

Power BI で図形を利用する

0
Last updated at Posted at 2026-10-08

一連の投稿で、
「Cognos Analytics をエンドユーザーの方に自己学習して頂くためのサイト」 https://qiita.com/shinyama/items/95885c7246dc413b6448
内の手順をPower BIで再現してみます。
今回は上記サイトのうち「Cognos Analytics ダッシュボード 図形の利用」という手順を行います。

画面上部の「挿入」タブを選択します。

「図形」をクリックし、「吹き出し」(または任意の形状)を選択してキャンバスに配置します。
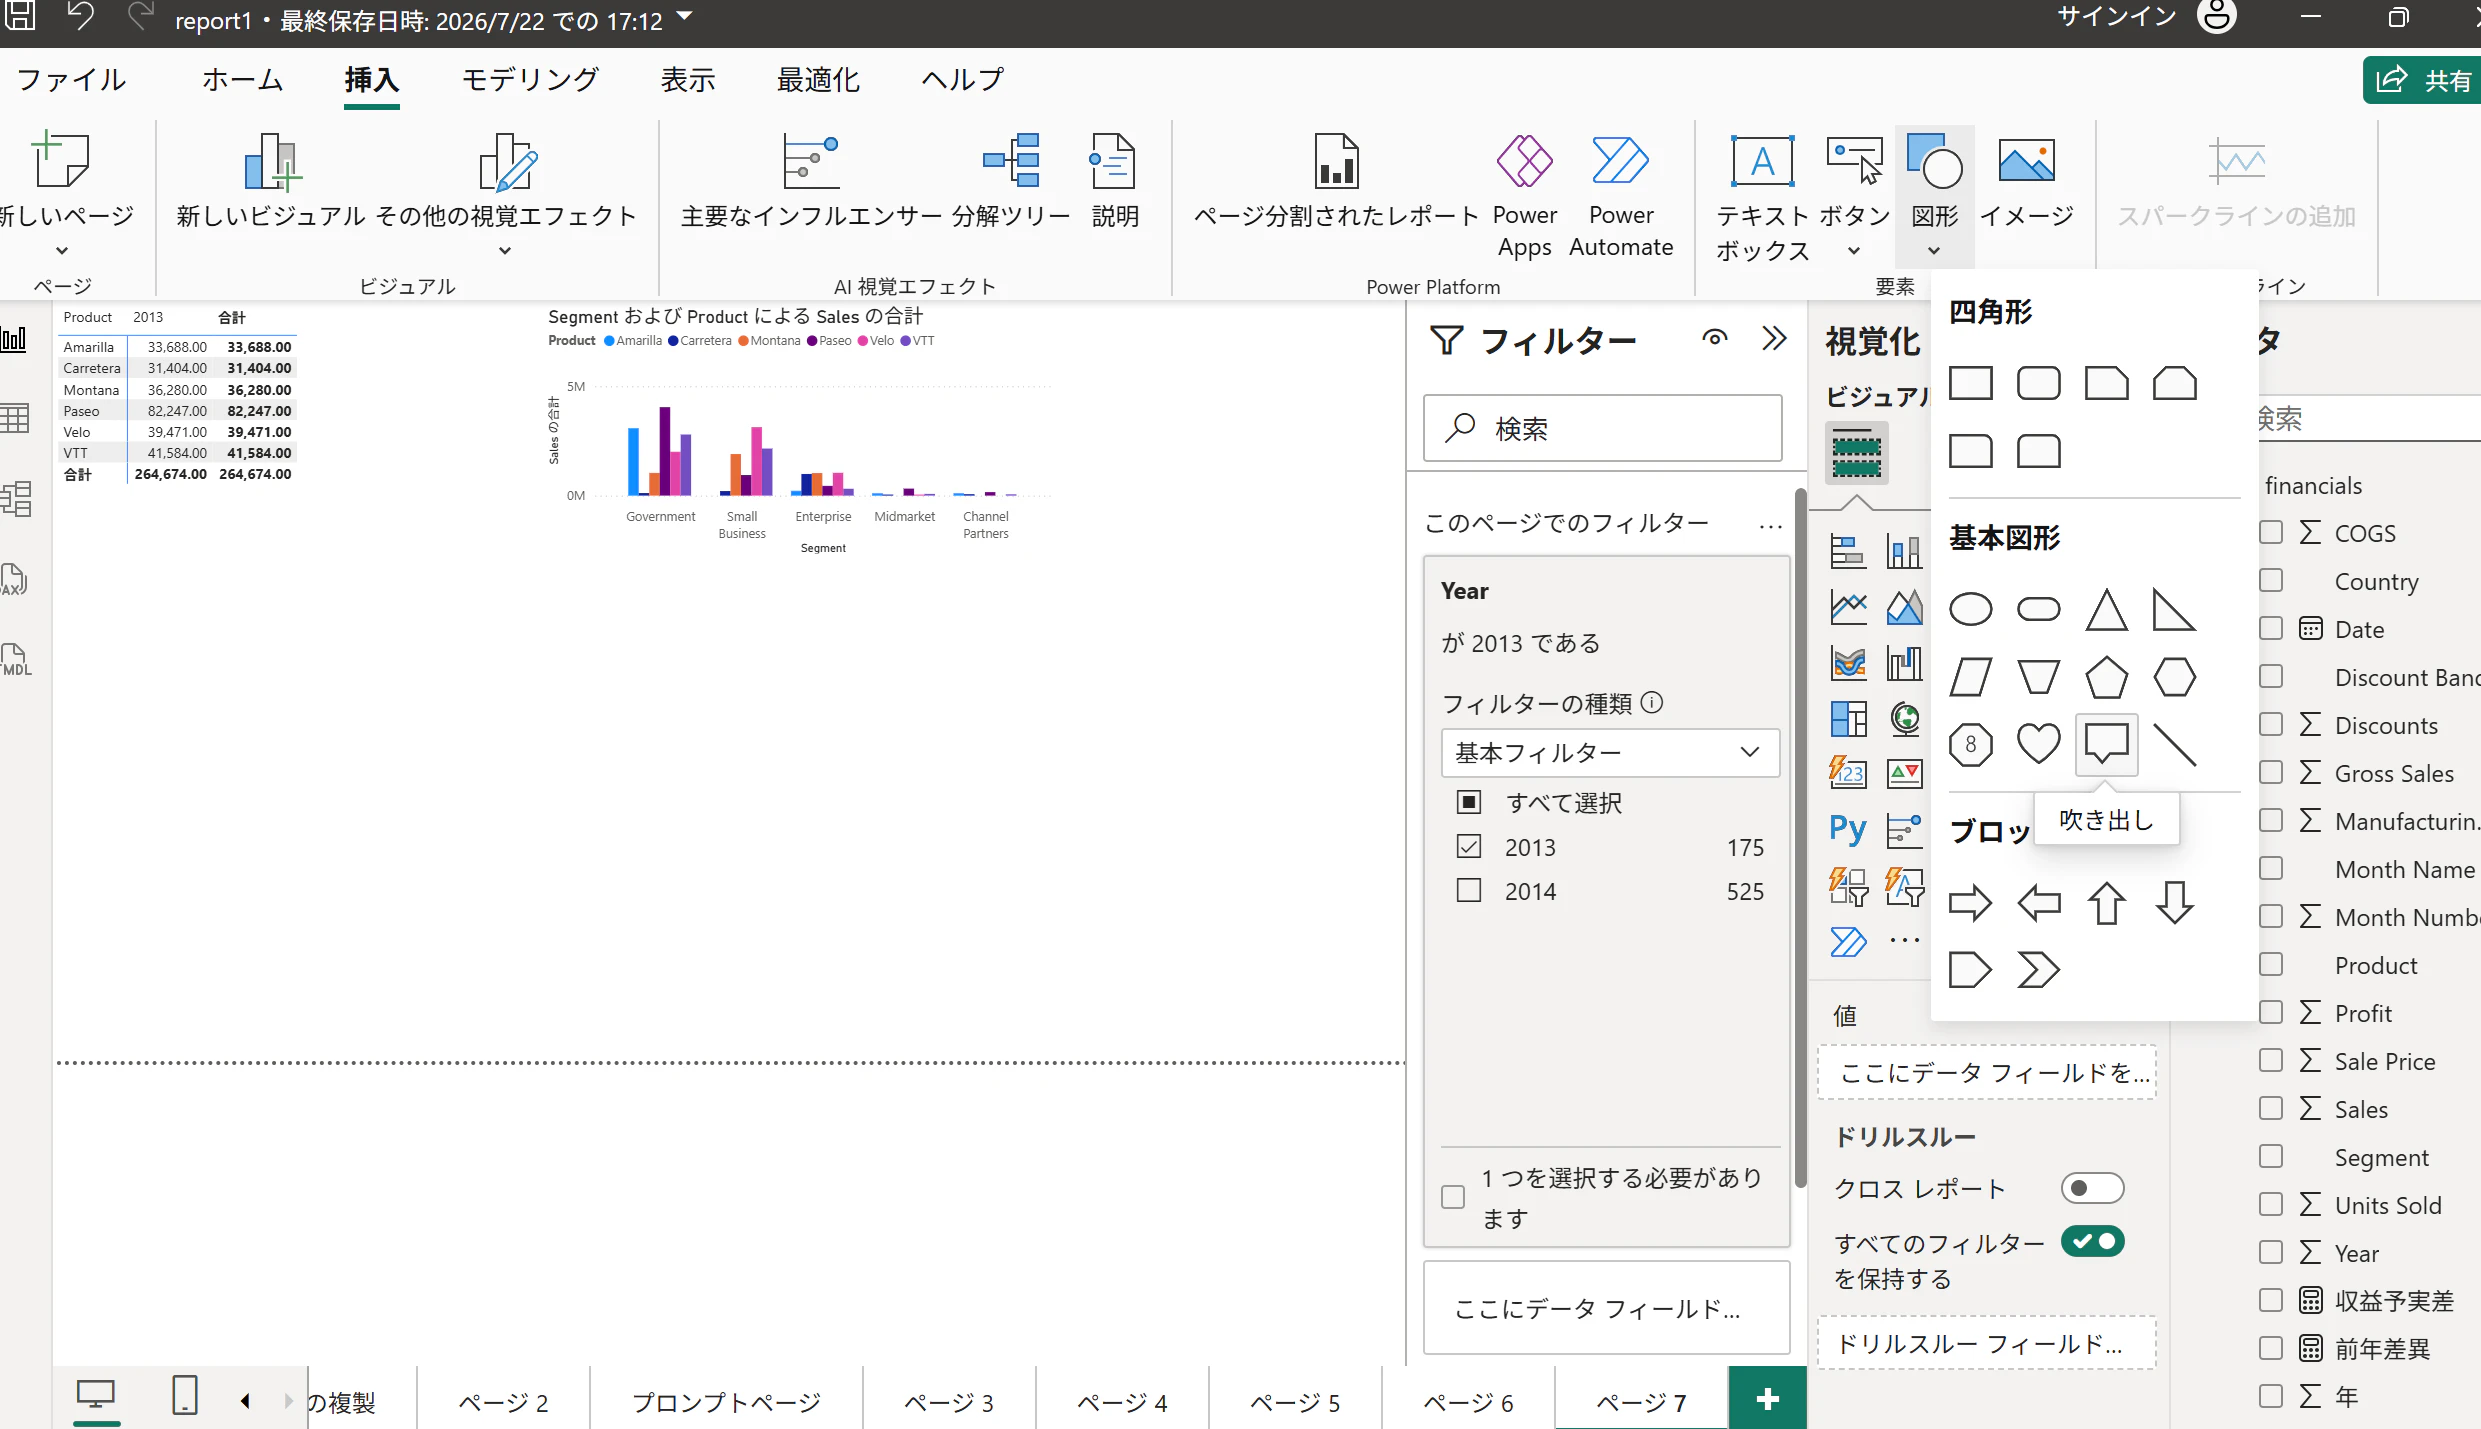
image.png

画面右側の「図形の書式設定」ペインを開きます。

「スタイル」を展開し、「テキスト」のトグルをオンにします。

「テキスト」欄に直接文字(「注目」など)を入力します。
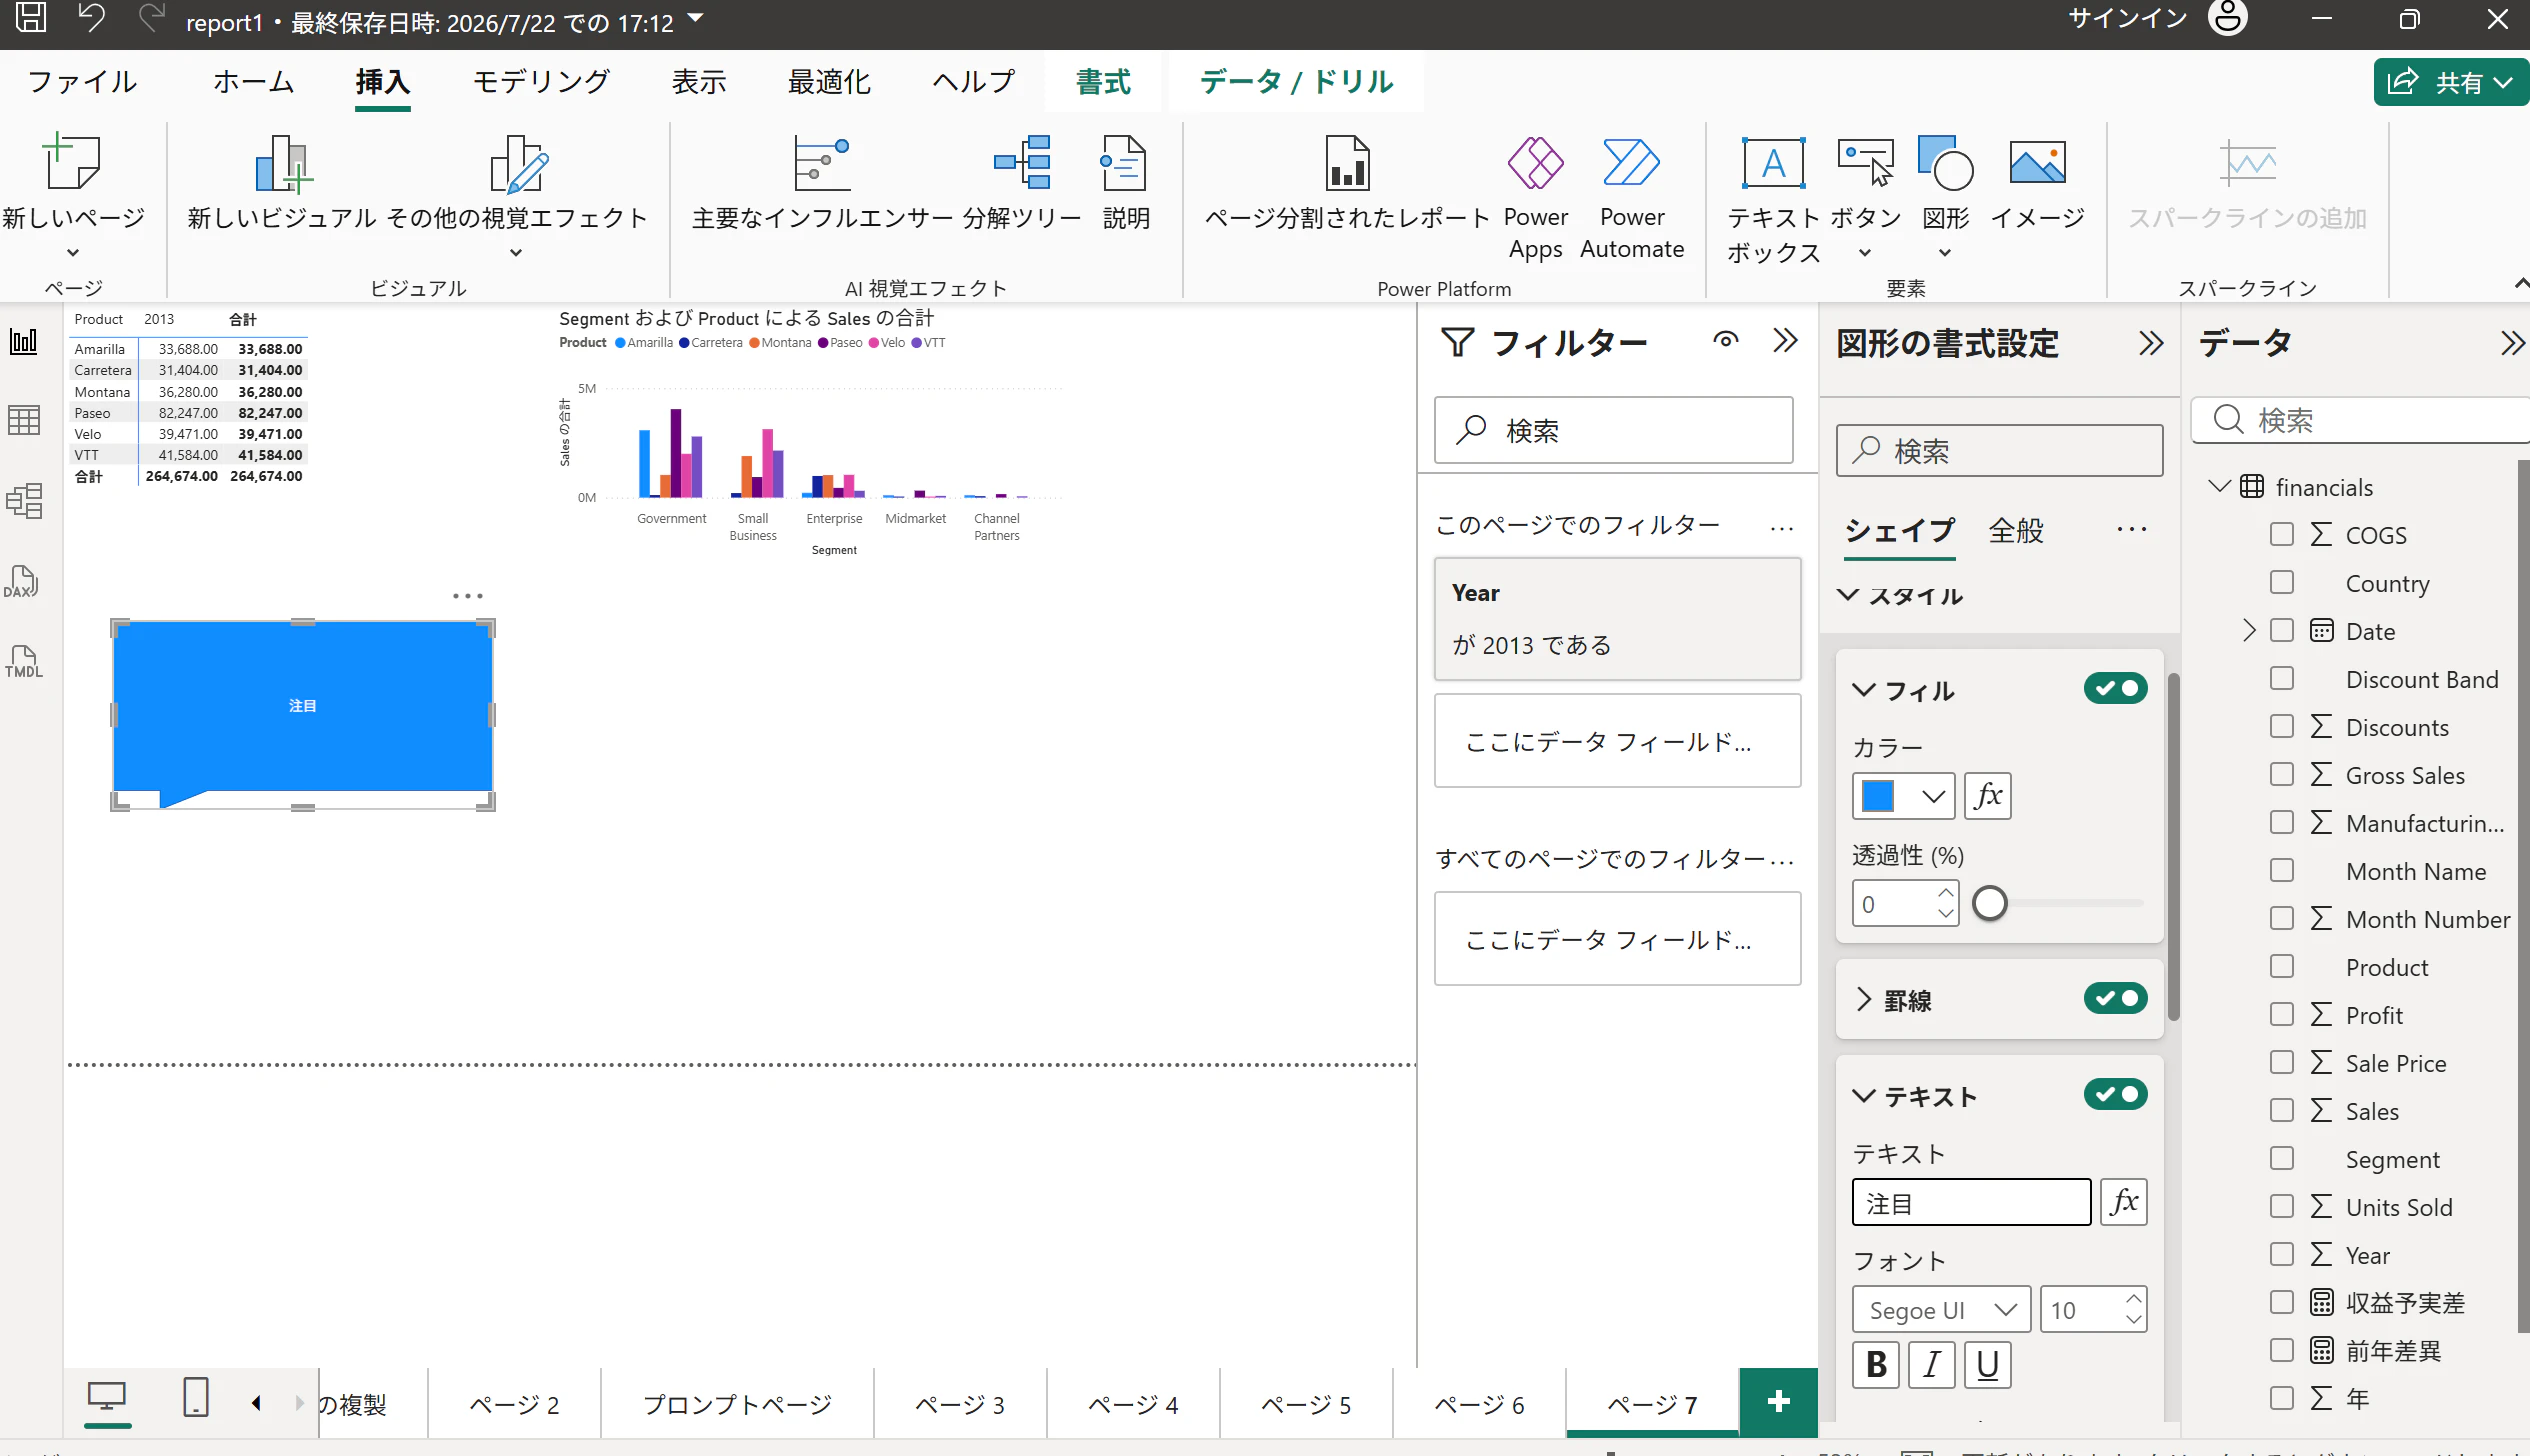
image.png

同画面内でフォントサイズや文字色を変更して調整します。

図形がテキストや他のオブジェクトを隠してしまう場合、対象のオブジェクトを選択した状態で「書式」タブを選択し、「背面へ移動」などをクリックして表示順序を調整します。
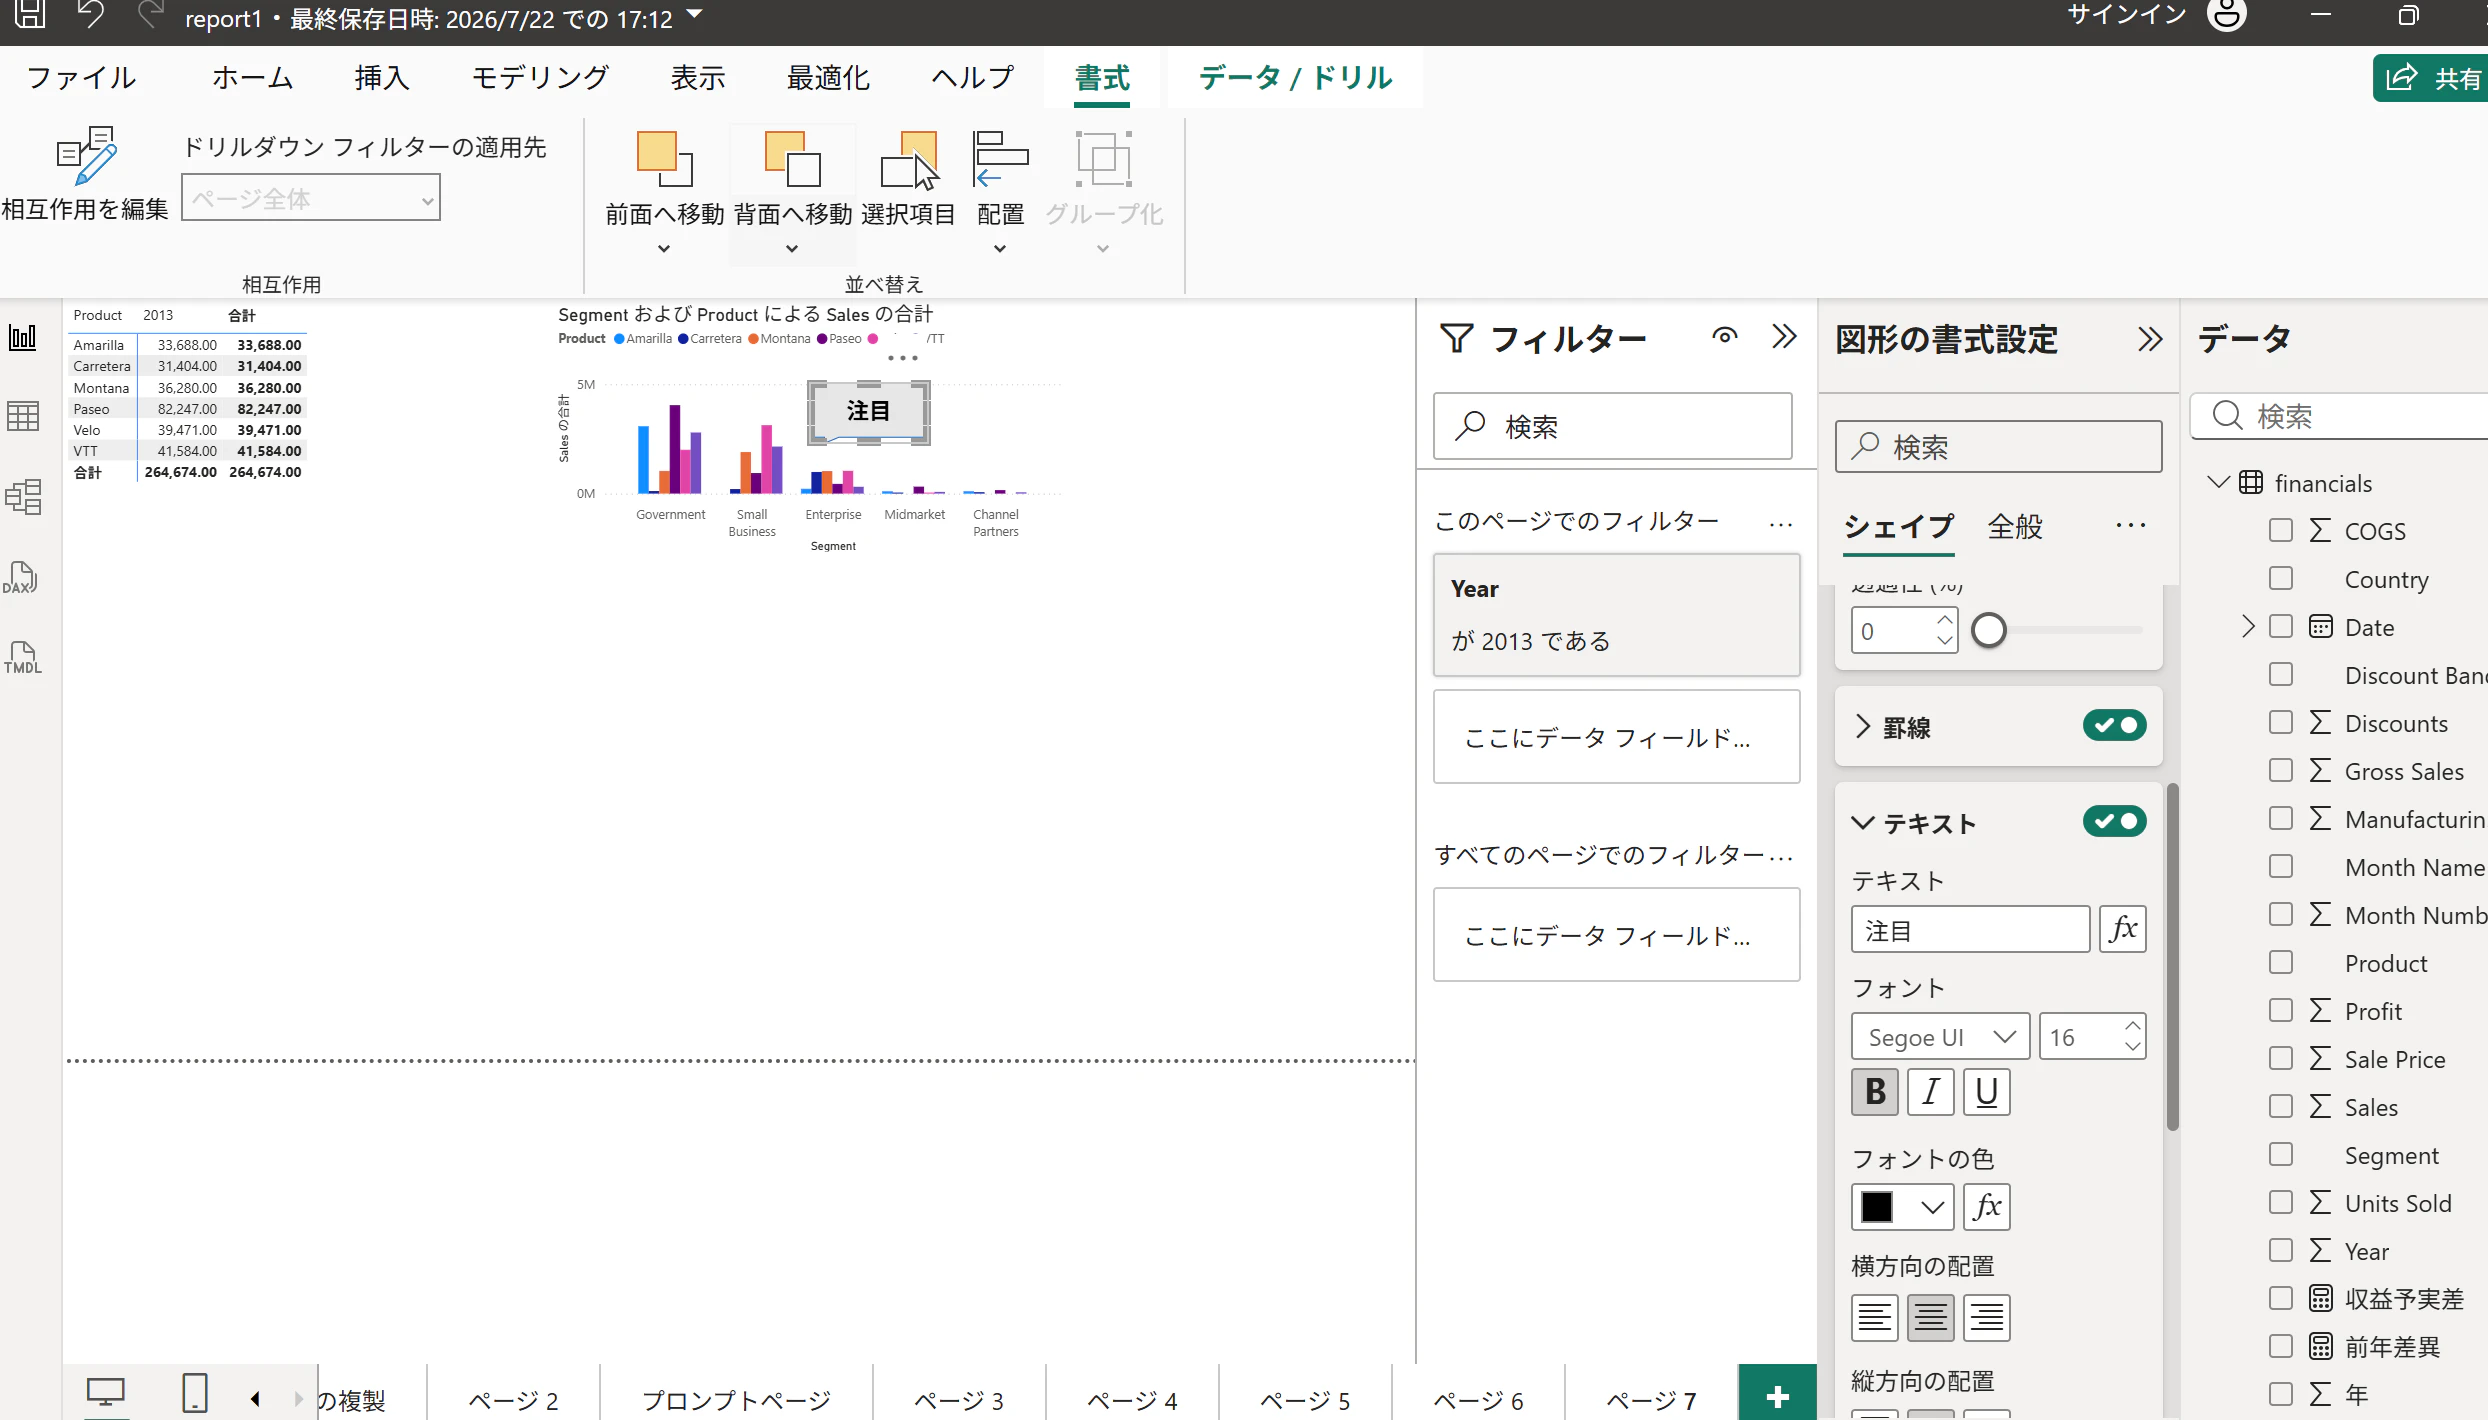
image.png

0
0
0

Register as a new user and use Qiita more conveniently

  1. You get articles that match your needs
  2. You can efficiently read back useful information
  3. You can use dark theme
What you can do with signing up
0
0

Delete article

Deleted articles cannot be recovered.

Draft of this article would be also deleted.

Are you sure you want to delete this article?