2020年に書いた記事の続編その2です。今回はラズパイ(Ubuntu)のdocker環境を構築します。以下の記述は2021年3月執筆時点の情報です。
この記事はDockerをラズパイで動かそうシリーズ(?)の一つです
- Raspberry Pi 4でUbuntuサーバーの初期設定を行う
- RaspberryPiにDockerを構築する(Ubuntu編)←今ここ
- RaspberryPiでdocker構築に時間がかかった時のtips
大まかな手順
- gitクローン
- dockerインストール
- docker-composeインストール
- Docker構築(Netdata導入)
バージョン関連
- Raspberry pi 4B 8GB RAM
| ソフト | バージョン |
|---|---|
| Ubuntu | 20.04.2 LTS (64bit) |
| git | 2.25.1 |
| docker | 20.10.5, build 55c4c88 |
| docker-compose | 1.28.5 |
Git
開発用途には十分なスペックがあるので、今後ラズパイ上で開発することを見据えてgithubにはssh接続します。何回かやってますがよく忘れるので忘備録的に書いておきます。なお以下の記事の写経です。
秘密鍵の生成
デフォルトでssh鍵が保存されている場所に移動。
$ cd ~/.ssh
ラズパイ上で秘密鍵を生成します。
$ ssh-keygen -t rsa
Generating public/private rsa key pair.
Enter file in which to save the key (/home/user/.ssh/id_rsa): XXX
Enter passphrase (empty for no passphrase):
Enter same passphrase again:
Your identification has been saved in XXX
Your public key has been saved in XXX.pub
The key fingerprint is:
HOGEHOGE
The key's randomart image is:
公開鍵(XXX.pub)の内容をメモしておきます
$ cat XXXX.pub
ssh-rsa <<<文字列>> ubuntu@linux
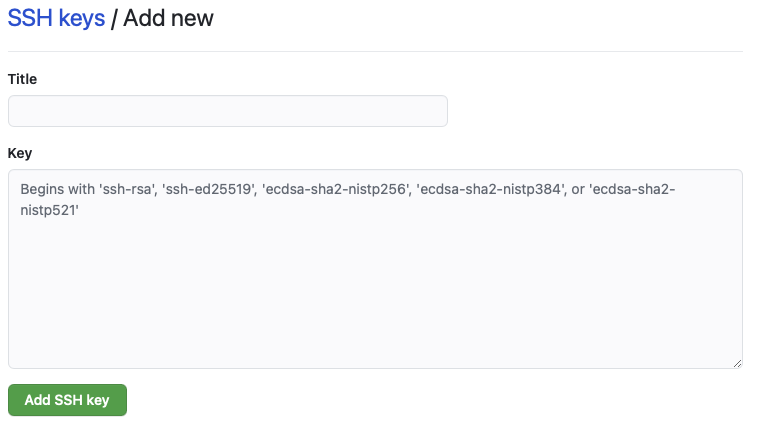
Githubに公開鍵を登録
https://github.com/settings/keys にアクセスして右上の「New SSH key」をクリック。事前にgithubにサインアップしてください。
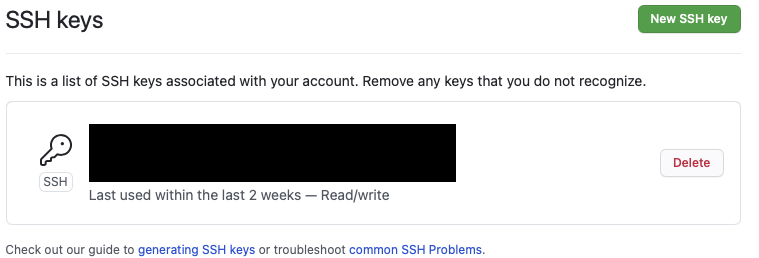
catで表示した公開鍵を貼り付けます。
configを書く
.ssh配下にconfigファイルを作成する
$ touch ~/.ssh/config
$ vi ~/.ssh/config
host github github.com
  HostName github.com
  User [githabのユーザ名]
  IdentityFile ~/.ssh/[秘密鍵]
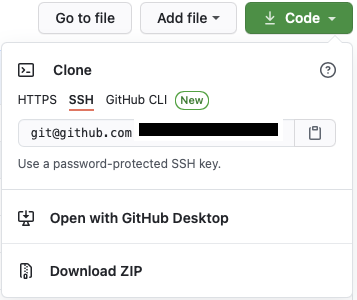
Git clone
自分のgithubレポジトリの右上に「Code」をクリックし、「SSH」を選択。「git@github.com:k-ken-t4g/XXX.git」と書かれている箇所をコピペします。
適当なディレクトリに移動してクローンします。
$ git clone git@github.com:k-ken-t4g/XXX.git
Cloning into 'XXX'...
Enter passphrase for key '/home/user/.ssh/XXX':
remote: Enumerating objects: 80, done.
remote: Counting objects: 100% (80/80), done.
remote: Compressing objects: 100% (50/50), done.
remote: Total 515 (delta 37), reused 61 (delta 27), pack-reused 435
Receiving objects: 100% (515/515), 8.61 MiB | 4.45 MiB/s, done.
Resolving deltas: 100% (241/241), done.
Dockerインストール
以下の公式ドキュメントに則って構築します。公式レポジトリを構築する方法だと最新版を定期的に入手したり、dockerをバージョン指定して入手できます。以下はほぼ下のリンクの和訳です。
公式レポジトリをセットアップした上でインストール
古いdockerをアンインストール
$ sudo apt-get remove docker docker-engine docker.io containerd runc
リポジトリのセットアップ
事前準備として以下のコマンドを実行
$ sudo apt-get update

$ sudo apt-get install \
    apt-transport-https \
    ca-certificates \
    curl \
    gnupg
Dockerの公式GPG鍵を入手
$ curl -fsSL https://download.docker.com/linux/ubuntu/gpg | sudo gpg --dearmor -o /usr/share/keyrings/docker-archive-keyring.gpg
ラズパイで「stable」版を入手したい場合は以下のコマンドを実行。nightlyやtestを入手したい場合はstableの箇所を修正するか追記してください。
echo \
  "deb [arch=arm64 signed-by=/usr/share/keyrings/docker-archive-keyring.gpg] https://download.docker.com/linux/ubuntu \
  $(lsb_release -cs) stable" | sudo tee /etc/apt/sources.list.d/docker.list > /dev/null
Docker Engineのインストール
$ sudo apt-get update
$ sudo apt-get install -y docker-ce docker-ce-cli containerd.io
(参考)古いバージョンをインストールしたい場合
レポジトリで利用可能なバージョンの一覧を取得
$ apt-cache madison docker-ce
 docker-ce | 5:20.10.5~3-0~ubuntu-focal | https://download.docker.com/linux/ubuntu focal/stable arm64 Packages
 docker-ce | 5:20.10.4~3-0~ubuntu-focal | https://download.docker.com/linux/ubuntu focal/stable arm64 Packages
 docker-ce | 5:20.10.3~3-0~ubuntu-focal | https://download.docker.com/linux/ubuntu focal/stable arm64 Packages
特定のバージョンをインストールする
sudo apt-get install docker-ce=<VERSION_STRING> docker-ce-cli=<VERSION_STRING> containerd.io
動作確認
sudo docker run hello-world
Unable to find image 'hello-world:latest' locally
latest: Pulling from library/hello-world
256ab8fe8778: Pull complete
Digest: sha256:89b647c604b2a436fc3aa56ab1ec515c26b085ac0c15b0d105bc475be15738fb
Status: Downloaded newer image for hello-world:latest

Hello from Docker!
This message shows that your installation appears to be working correctly.

To generate this message, Docker took the following steps:
 1. The Docker client contacted the Docker daemon.
 2. The Docker daemon pulled the "hello-world" image from the Docker Hub.
    (arm64v8)
 3. The Docker daemon created a new container from that image which runs the
    executable that produces the output you are currently reading.
 4. The Docker daemon streamed that output to the Docker client, which sent it
    to your terminal.

To try something more ambitious, you can run an Ubuntu container with:
 $ docker run -it ubuntu bash

Share images, automate workflows, and more with a free Docker ID:
 https://hub.docker.com/

For more examples and ideas, visit:
 https://docs.docker.com/get-started/
マニュアルインストール
とりあえず下のコマンドを打っておけば最新版のdockerは手に入ります
curl -sSL https://get.docker.com | sh
実行結果は以下の通り
+ sudo -E sh -c docker version
Client: Docker Engine - Community
 Version:           20.10.5
 API version:       1.41
 Go version:        go1.13.15
 Git commit:        55c4c88
 Built:             Tue Mar  2 20:19:31 2021
 OS/Arch:           linux/arm64
 Context:           default
 Experimental:      true

Server: Docker Engine - Community
 Engine:
  Version:          20.10.5
  API version:      1.41 (minimum version 1.12)
  Go version:       go1.13.15
  Git commit:       363e9a8
  Built:            Tue Mar  2 20:17:22 2021
  OS/Arch:          linux/arm64
  Experimental:     false
 containerd:
  Version:          1.4.3
  GitCommit:        269548fa27e0089a8b8278fc4fc781d7f65a939b
 runc:
  Version:          1.0.0-rc92
  GitCommit:        ff819c7e9184c13b7c2607fe6c30ae19403a7aff
 docker-init:
  Version:          0.19.0
  GitCommit:        de40ad0
取り除きたい場合は以下のコマンドを実行
$ sudo apt-get purge docker-ce docker-ce-cli containerd.io
$ sudo rm -rf /var/lib/docker
$ sudo rm -rf /var/lib/containerd
docker-composeのインストール
公式ドキュメントに沿ってdocker-composeをインストール
以下のコマンドを実行。docker-composeのバージョン1.28.5は2021年3月時点での最新安定版。
$ sudo apt install python3-pip #pip未インストールの場合
$ sudo pip3 install docker-compose
docker-composeの起動確認
$ sudo docker-compose --version
docker-compose version 1.28.5, build unknown
Netdata構築
Netdataでラズパイをモニターするためにdocker-composeで構築します。公式マニュアルが若干変更されたので、前回構築時点とは若干設定が異なります。また、ラズパイの温度が見られるように変更しています。
version: '3'
services:
  netdata:
    #image: netdata/netdata
    build:
      context: ./
    ports:
      - 19999:19999
    cap_add:
      - SYS_PTRACE
    security_opt:
      - apparmor:unconfined
    volumes:
      - netdataconfig:/etc/netdata
      - netdatalib:/var/lib/netdata
      - netdatacache:/var/cache/netdata
      - /etc/passwd:/host/etc/passwd:ro
      - /etc/group:/host/etc/group:ro
      - /proc:/host/proc:ro
      - /sys:/host/sys:ro
      - /etc/os-release:/host/etc/os-release:ro
    environment:
      - DOCKER_HOST=proxy:2375
    restart: unless-stopped
  proxy:
    image: tecnativa/docker-socket-proxy
    restart: always
    volumes:
     - /var/run/docker.sock:/var/run/docker.sock:ro
    privileged: true
    environment:
      - CONTAINERS=1

volumes:
  netdataconfig:
  netdatalib:
  netdatacache:
FROM netdata/netdata

RUN sed -i -e 's/^# sensors=force/sensors=force/' /usr/lib/netdata/conf.d/charts.d.conf
COPY --chown=netdata:netdata rpi.html /usr/share/netdata/web
<!DOCTYPE html>
<!-- SPDX-License-Identifier: GPL-3.0-or-later -->
<html lang="en">

<head>
    <title>NetData Dashboard for RPi</title>
    <meta name="application-name" content="netdata">

    <meta http-equiv="Content-Type" content="text/html; charset=utf-8" />
    <meta charset="utf-8">
    <meta http-equiv="X-UA-Compatible" content="IE=edge,chrome=1">
    <meta name="viewport" content="width=device-width, initial-scale=1">
    <meta name="apple-mobile-web-app-capable" content="yes">
    <meta name="apple-mobile-web-app-status-bar-style" content="black-translucent">

    <meta property="og:locale" content="en_US" />
    <meta property="og:image"
        content="https://cloud.githubusercontent.com/assets/2662304/22945737/e98cd0c6-f2fd-11e6-96f1-5501934b0955.png" />
    <meta property="og:url" content="http://my-netdata.io/" />
    <meta property="og:type" content="website" />
    <meta property="og:site_name" content="netdata" />
    <meta property="og:title" content="netdata - real-time performance monitoring, done right!" />
    <meta property="og:description"
        content="Stunning real-time dashboards, blazingly fast and extremely interactive. Zero configuration, zero dependencies, zero maintenance." />

</head>
<script>
    // this section has to appear before loading dashboard.js
    // Select a theme.
    // uncomment on of the two themes:
    // var netdataTheme = 'default'; // this is white
    var netdataTheme = 'slate'; // this is dark
// Set the default netdata server.
// on charts without a 'data-host', this one will be used.
// the default is the server that dashboard.js is downloaded from.
// var netdataServer = 'http://my.server:19999/';
</script>

<!--
    Load dashboard.js
    to host this HTML file on your web server,
    you have to load dashboard.js from the netdata server.
    So, pick one the two below
    If you pick the first, set the server name/IP.
    The second assumes you host this file on /usr/share/netdata/web
    and that you have chown it to be owned by netdata:netdata
-->
<!-- <script type="text/javascript" src="http://my.server:19999/dashboard.js"></script> -->
<script type="text/javascript" src="dashboard.js?v20190902-0"></script>

<script>
    // Set options for TV operation
    // This has to be done, after dashboard.js is loaded
    // destroy charts not shown (lowers memory on the browser)
    NETDATA.options.current.destroy_on_hide = true;
    // set this to false, to always show all dimensions
    NETDATA.options.current.eliminate_zero_dimensions = true;
    // lower the pressure on this browser
    NETDATA.options.current.concurrent_refreshes = false;
    // if the tv browser is too slow (a pi?)
    // set this to false
    NETDATA.options.current.parallel_refresher = true;
    // always update the charts, even if focus is lost
    NETDATA.options.current.stop_updates_when_focus_is_lost = false;
    // Since you may render charts from many servers and any of them may
    // become offline for some time, the charts will break.
    // This will reload the page every RELOAD_EVERY minutes
    var RELOAD_EVERY = 5;
    setTimeout(function () {
        location.reload();
    }, RELOAD_EVERY * 60 * 1000);
</script>

<body>

    <div style="width: 100%; text-align: center; display: inline-block;">
        <div style="width: 100%; text-align: center; display: inline-block;">
            <div style="width: 100%; height: 15px; text-align: center; display: inline-block;">
                <b>Raspberry Pi</b>
            </div>
        </div>

        <div style="width: 98%; height:100%; align: center; display: inline-block;">
            Overview
            <br />
            <div data-netdata="system.cpu" data-chart-library="gauge" data-title="CPU" data-units="%"
                data-gauge-max-value="100" data-width="20%" data-after="-420" data-points="420" data-colors="#22AA99">
            </div>
            <div data-netdata="sensors.temp_thermal_zone0_thermal_thermal_zone0" data-chart-library="gauge"
                data-title="Temperature" data-units="°C" data-gauge-min-value="20" data-gauge-max-value="100"
                data-width="20%" data-after="-420" data-points="420" data-colors="#884466">
            </div>
            <div class="netdata-container-easypiechart" style="margin-right: 10px; width: 11%; will-change: transform;"
                data-netdata="disk_space._" data-dimensions="avail" data-chart-library="easypiechart" data-title="Disk Space"
                data-width="11%" data-before="0" data-after="-300" data-points="300" >
            </div>
        </div>

        <div style="width: 100%; height: 19vh; text-align: center; display: inline-block;">
            <div style="width: 100%; height: 15px; text-align: center; display: inline-block;">
                <b>CPU</b>
            </div>
            <div style="width: 100%; height: calc(100% - 15px); text-align: center; display: inline-block;">
                <br />
                <div data-netdata="system.cpu" data-title="System CPU" data-chart-library="dygraph" data-width="49%"
                    data-height="100%" data-after="-300" data-dygraph-valuerange="[0, 100]" data-decimal-digits="0">
                </div>

                <div data-netdata="cpu.cpufreq" data-title="CPU Frequency" data-chart-library="dygraph" data-width="49%"
                    data-height="100%" data-after="-300" data-dygraph-valuerange="[500, 1800]" data-decimal-digits="0">
                </div>

                <div style="width: 100%; height: calc(100% - 15px); text-align: center; display: inline-block;">
                    <div data-netdata="system.load" data-title="System Load" data-chart-library="dygraph"
                        data-width="49%" data-height="100%" data-after="-300" data-dygraph-valuerange="[null, null]">
                    </div>
                    <div data-netdata="sensors.temp_thermal_zone0_thermal_thermal_zone0" data-title="CPU Temperature"
                        data-chart-library="dygraph" data-width="49%" data-height="100%"
                        data-dygraph-valuerange="[30, 90]" data-after="-300" data-decimal-digits="-1">
                    </div>

                </div>
            </div>
        </div>

        <div style="width: 100%; height: 19vh; text-align: center; display: inline-block;">
            <div style="width: 100%; height: 15px; text-align: center; display: inline-block;">
                <b>Memory</b>
            </div>
            <div style="width: 100%; height: calc(100% - 15px); text-align: center; display: inline-block;">
                <br />
                <div data-netdata="system.ram" data-title="System RAM" data-chart-library="dygraph" data-width="49%"
                    data-height="100%" data-after="-300" data-dygraph-valuerange="[null, null]">
                </div>

                <div data-netdata="system.swap" data-title="System SWAP" data-chart-library="dygraph" data-width="49%"
                    data-height="100%" data-after="-300" data-dygraph-valuerange="[null, null]">
                </div>
            </div>
        </div>

        <div style="width: 100%; height: 19vh; text-align: center; display: inline-block;">
            <div style="width: 100%; height: 15px; text-align: center; display: inline-block;">
                <b>I/Os</b>
            </div>
            <div style="width: 100%; height: calc(100% - 15px); text-align: center; display: inline-block;">
                <div data-netdata="system.io" data-title="System I/O" data-common-max="io" data-common-min="io"
                    data-chart-library="dygraph" data-width="49%" data-height="100%" data-after="-300"></div>
                <div data-netdata="system.net" data-title="Network Traffic" data-common-max="traffic"
                    data-common-min="traffic" data-chart-library="dygraph" data-width="49%" data-height="100%"
                    data-after="-300"> </div>
            </div>
        </div>
    </div>
    </div>
    <p align='center'>Netdata dashboard for Raspberry Pi. Powered by <a
            href='https://signal-flag-z.blogspot.com/'>Signal Flag Z</a></p>
</body>
</html>
docker-compose.ymlを配置したディレクトリに移動して以下を実行
$ sudo docker-compose up -d
Creating network "netdata_default" with the default driver
Creating volume "netdata_netdataconfig" with default driver
Creating volume "netdata_netdatalib" with default driver
Creating volume "netdata_netdatacache" with default driver
Building netdata
Sending build context to Docker daemon  241.7kB

Step 1/3 : FROM netdata/netdata
latest: Pulling from netdata/netdata
dce8679b510e: Pulling fs layer
d4daa44a897a: Pulling fs layer
dfd4cf4c2021: Pulling fs layer
9959791c8ab8: Pulling fs layer
435fcc90d0ca: Pulling fs layer
9e846689d9ed: Pulling fs layer
97cff47946d6: Pulling fs layer
9959791c8ab8: Waiting
435fcc90d0ca: Waiting
9e846689d9ed: Waiting
97cff47946d6: Waiting
dce8679b510e: Verifying Checksum
dfd4cf4c2021: Verifying Checksum
dfd4cf4c2021: Download complete
dce8679b510e: Pull complete
9959791c8ab8: Verifying Checksum
9959791c8ab8: Download complete
435fcc90d0ca: Verifying Checksum
435fcc90d0ca: Download complete
97cff47946d6: Verifying Checksum
97cff47946d6: Download complete
9e846689d9ed: Verifying Checksum
9e846689d9ed: Download complete
d4daa44a897a: Verifying Checksum
d4daa44a897a: Download complete
d4daa44a897a: Pull complete
dfd4cf4c2021: Pull complete
9959791c8ab8: Pull complete
435fcc90d0ca: Pull complete
9e846689d9ed: Pull complete
97cff47946d6: Pull complete
Digest: sha256:e42ef5a9aadc9e2d8680c43b220d9f4aae63044347d5362b372db8db60cc772e
Status: Downloaded newer image for netdata/netdata:latest
 ---> 2cefb6d78bdb
Step 2/3 : RUN sed -i -e 's/^# sensors=force/sensors=force/' /usr/lib/netdata/conf.d/charts.d.conf
 ---> Running in 3c95f71f51b0
Removing intermediate container 3c95f71f51b0
 ---> 0fe6b74eff24
Step 3/3 : COPY --chown=netdata:netdata rpi.html /usr/share/netdata/web
 ---> 334ecfb948fc
Successfully built 334ecfb948fc
Successfully tagged netdata_netdata:latest
WARNING: Image for service netdata was built because it did not already exist. To rebuild this image you must use `docker-compose build` or `docker-compose up --build`.
Pulling proxy (tecnativa/docker-socket-proxy:)...
latest: Pulling from tecnativa/docker-socket-proxy
b538f80385f9: Pull complete
5216d9715640: Pull complete
18199a78a738: Pull complete
3e45a152932c: Pull complete
Digest: sha256:6c22b9545adc95258af9deffdde6c0ce0a0a70716771e5a4e02d24d1b6e0dda1
Status: Downloaded newer image for tecnativa/docker-socket-proxy:latest
Creating netdata_netdata_1 ... done
Creating netdata_proxy_1   ... done
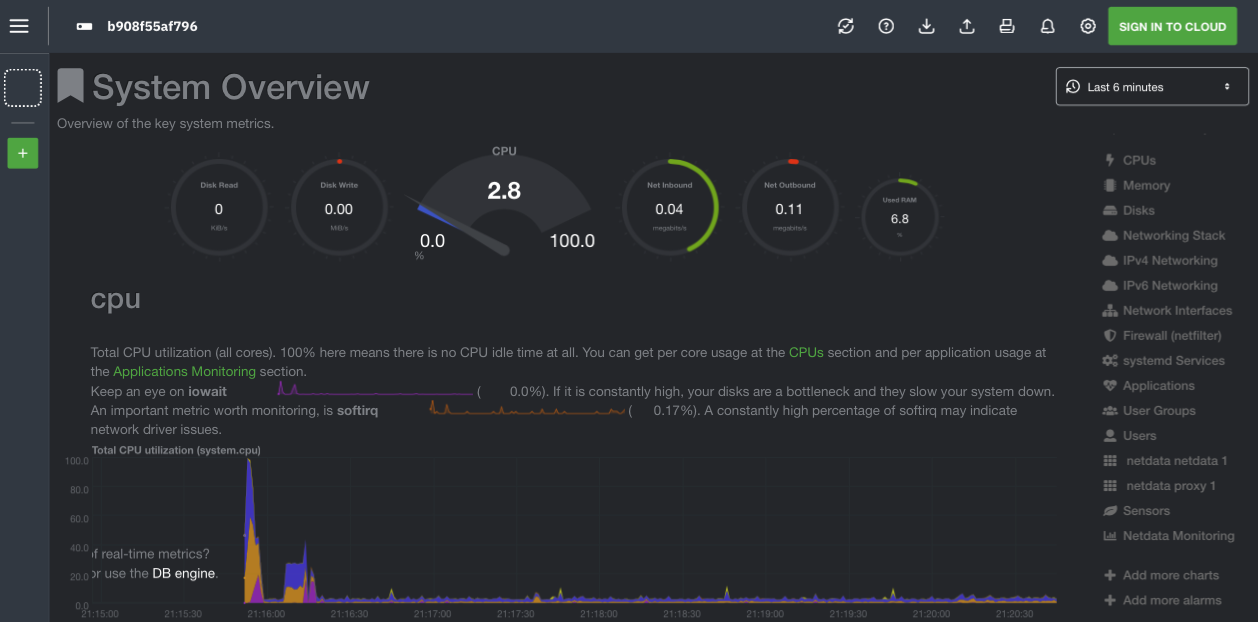
http://[ラズパイのIPアドレス]:19999/にアクセスしてログが取得されているか確認。
小ネタ:データ移動
PostgresのDocker Volumeに入っているデータを、そっくりそのまま違うマシンにコピーして動かせるか軽く調べてみた結果なさそうだったので、愚直に以下の方法でやりました。
後で調べた結果、もっと楽な方法があったのでリンクを貼ります。
- Dockerコンテナに入る
$ sudo docker exec -it [コンテナ名] bash
- PostgresのDockerコンテナ内で
pg_dumpall。参考:pg_dump
$ pg_dumpall -f 20210307.sql -U postgres
- ホストマシン側でコンテナ内のデータをホスト側へコピー。参考:Dockerでホストとコンテナ間でのファイルコピー
sudo docker cp [コンテナ名]:[取り出したいファイルのパス] [ホスト側のパス]
- 違うホストマシンにdumpしたファイルを転送(
WinSCPやCyberduckなど)。 - ホストマシン側からコンテナへdump結果をコピー
sudo docker cp [ホスト側のパス] [コンテナ名]:[取り出したいファイルのパス]
- リストア
psql -f 20210307.sql -U postgres
今後目指したいところ
以上でひとまず必要なDocker環境を準備しました。
今のところdockerを使ってデータ収集を行なっていますが、自宅にk8s分析環境を構築したいなと思っています。~~そこまで到達できるかは別にして。~~以下参考。