はじめに
今回は、機械学習の一つであるアンサンブル学習のスタッキング法についてのいいチュートリアルをKaggleで見つけたので共有します。
目的は、様々なパラメータからタイタニック号事件の生存を予測することです。
原文:Introduction to Ensembling/Stacking in Python
お手元で試しながら読む場合は、先にKaggleからデータをダウンロードしてください。
データ入手方法:【Kaggle初心者入門編】タイタニック号で生き残るのは誰?
Introduction
原文を呼んでください。
要は、「スタッキング法でのアンサンブル学習は、機械学習において良い精度を出すよ。」って書いてあります。

機械学習において、単一の学習器をそのまま使うのではなく、複数の学習器を組み合わせることで、予測エラーを小さくする手法をアンサンブル学習といいます。
アンサンブル(混合学習手法の)には複数の学習器の平均や多数決を取るvoting、構成済の学習器の誤りを反映して次段の弱学習器を形成するboosting、そして初段の学習器の出力結果を次段の入力結果とするstacking(以下スタッキング)とよばれるものがあり、Kaggleなどのデータ分析コンペでは良く使われます。
参考:【機械学習】スタッキングのキホンを勉強したのでそのメモ
まずは下準備として、ライブラリを読み込みます。
import pandas as pd
import numpy as np
import re
import sklearn
import xgboost as xgb # 勾配ブースティング
import seaborn as sns # オシャレなグラフ
import matplotlib.pyplot as plt
%matplotlib inline

import plotly.offline as py
py.init_notebook_mode(connected=True)
import plotly.graph_objs as go
import plotly.tools as tls

import warnings
warnings.filterwarnings('ignore')

# Going to use these 5 base models for the stacking
from sklearn.ensemble import (RandomForestClassifier, AdaBoostClassifier,
                              GradientBoostingClassifier, ExtraTreesClassifier)
from sklearn.svm import SVC
from sklearn.cross_validation import KFold
勾配ブースティング:ロス関数の最小化の際に使われる。
参考:機械学習アルゴリズム〜XGboost〜
Feature Exploration, Engineering and Cleaning
ここでは、データを整形して特徴データを作成していきます。
# データ読み込み
train = pd.read_csv('../input/train.csv')
test = pd.read_csv('../input/test.csv')

# 乗客のID
PassengerId = test['PassengerId']

# 最初の3行だけ見る
train.head(3)

使用するデータは、タイタニック号事件でのデータです。
- PassengerId – 乗客識別ユニークID
- Survived – 生存フラグ(0=死亡、1=生存)
- Pclass – チケットクラス
- Name – 乗客の名前
- Sex – 性別(male=男性、female=女性)
- Age – 年齢
- SibSp – タイタニックに同乗している兄弟/配偶者の数
- parch – タイタニックに同乗している親/子供の数
- ticket – チケット番号
- fare – 料金
- cabin – 客室番号
- Embarked – 出港地(タイタニックへ乗った港)
Feature Engineering
長い作業になりますが、機械学習において前処理が一番重要です。
前処理では、欠損値や文字データを全て数値データに変換します。
full_data = [train, test]

# 乗客の名前の長さ
train['Name_length'] = train['Name'].apply(len)
test['Name_length'] = test['Name'].apply(len)

# 客室番号データがあるなら1を、欠損値なら0を
train['Has_Cabin'] = train["Cabin"].apply(lambda x: 0 if type(x) == float else 1)
test['Has_Cabin'] = test["Cabin"].apply(lambda x: 0 if type(x) == float else 1)

# 家族の大きさを"タイタニックに同乗している兄弟/配偶者の数"と
# "タイタニックに同乗している親/子供の数"から定義
for dataset in full_data:
    dataset['FamilySize'] = dataset['SibSp'] + dataset['Parch'] + 1

# 家族がいるかどうか
# いるなら"IsAlone"が1
for dataset in full_data:
    dataset['IsAlone'] = 0
    dataset.loc[dataset['FamilySize'] == 1, 'IsAlone'] = 1

# 出港地の欠損値を一番多い"S"としておく
for dataset in full_data:
    dataset['Embarked'] = dataset['Embarked'].fillna('S')

# 料金の欠損値を中央値としておく
# 料金の大きく4つのグループに分ける
for dataset in full_data:
    dataset['Fare'] = dataset['Fare'].fillna(train['Fare'].median())
train['CategoricalFare'] = pd.qcut(train['Fare'], 4)

# 年齢を5つのグループに分ける
for dataset in full_data:
    age_avg = dataset['Age'].mean()
    age_std = dataset['Age'].std()
    age_null_count = dataset['Age'].isnull().sum()
    age_null_random_list = np.random.randint(age_avg - age_std, age_avg + age_std, size=age_null_count)
    dataset['Age'][np.isnan(dataset['Age'])] = age_null_random_list
    dataset['Age'] = dataset['Age'].astype(int)
train['CategoricalAge'] = pd.cut(train['Age'], 5)

# 名前を取り出す関数1
def get_title(name):
    title_search = re.search(' ([A-Za-z]+)\.', name)
    # 名前があれば取り出して返す
    if title_search:
        return title_search.group(1)
    return ""

# 関数1を使う
for dataset in full_data:
    dataset['Title'] = dataset['Name'].apply(get_title)

# 名前の変なところを変換
    dataset['Title'] = dataset['Title'].replace(['Lady', 'Countess','Capt', 'Col','Don', 'Dr', 'Major', 'Rev', 'Sir', 'Jonkheer', 'Dona'], 'Rare')

    dataset['Title'] = dataset['Title'].replace('Mlle', 'Miss')
    dataset['Title'] = dataset['Title'].replace('Ms', 'Miss')
    dataset['Title'] = dataset['Title'].replace('Mme', 'Mrs')

for dataset in full_data:
    # 女なら0、男なら1
    dataset['Sex'] = dataset['Sex'].map( {'female': 0, 'male': 1} ).astype(int)

    # 名前の5種類にラベル付
    title_mapping = {"Mr": 1, "Miss": 2, "Mrs": 3, "Master": 4, "Rare": 5}
    dataset['Title'] = dataset['Title'].map(title_mapping)
    dataset['Title'] = dataset['Title'].fillna(0)

    # 出港地の3種類にラベル付
    dataset['Embarked'] = dataset['Embarked'].map( {'S': 0, 'C': 1, 'Q': 2} ).astype(int)

    # 料金を4つのグループに分ける
    dataset.loc[ dataset['Fare'] <= 7.91, 'Fare'] 						        = 0
    dataset.loc[(dataset['Fare'] > 7.91) & (dataset['Fare'] <= 14.454), 'Fare'] = 1
    dataset.loc[(dataset['Fare'] > 14.454) & (dataset['Fare'] <= 31), 'Fare']   = 2
    dataset.loc[ dataset['Fare'] > 31, 'Fare'] 							        = 3
    dataset['Fare'] = dataset['Fare'].astype(int)

    # 年齢を5つのグループに分ける
    dataset.loc[ dataset['Age'] <= 16, 'Age'] 					       = 0
    dataset.loc[(dataset['Age'] > 16) & (dataset['Age'] <= 32), 'Age'] = 1
    dataset.loc[(dataset['Age'] > 32) & (dataset['Age'] <= 48), 'Age'] = 2
    dataset.loc[(dataset['Age'] > 48) & (dataset['Age'] <= 64), 'Age'] = 3
    dataset.loc[ dataset['Age'] > 64, 'Age'] = 4 ;

# 必要ない特徴を削除
drop_elements = ['PassengerId', 'Name', 'Ticket', 'Cabin', 'SibSp']
train = train.drop(drop_elements, axis = 1)
train = train.drop(['CategoricalAge', 'CategoricalFare'], axis = 1)
test  = test.drop(drop_elements, axis = 1)
Visualisations
前処理を終えて初めの3行を見て見ると、全て数値データになっていることが確認できます。
train.head(3)

Pearson Correlation Heatmap
特徴量同士の相関をヒートマップにて確認します。
colormap = plt.cm.RdBu
plt.figure(figsize=(14,12))
plt.title('Pearson Correlation of Features', y=1.05, size=15)
sns.heatmap(train.astype(float).corr(),linewidths=0.1,vmax=1.0,
            square=True, cmap=colormap, linecolor='white', annot=True)

Takeaway from the Plots
このプロットから、そこまで特徴量が互いに強く相関していないことが分かります。
特徴量が互いに独立であるということは、無駄な特徴がないということであり、学習モデルを構築する上で重要です。
ここでは、ParchとFamilySizeが比較的相関が高めですが、そのまま残しておきます。
Pairplots
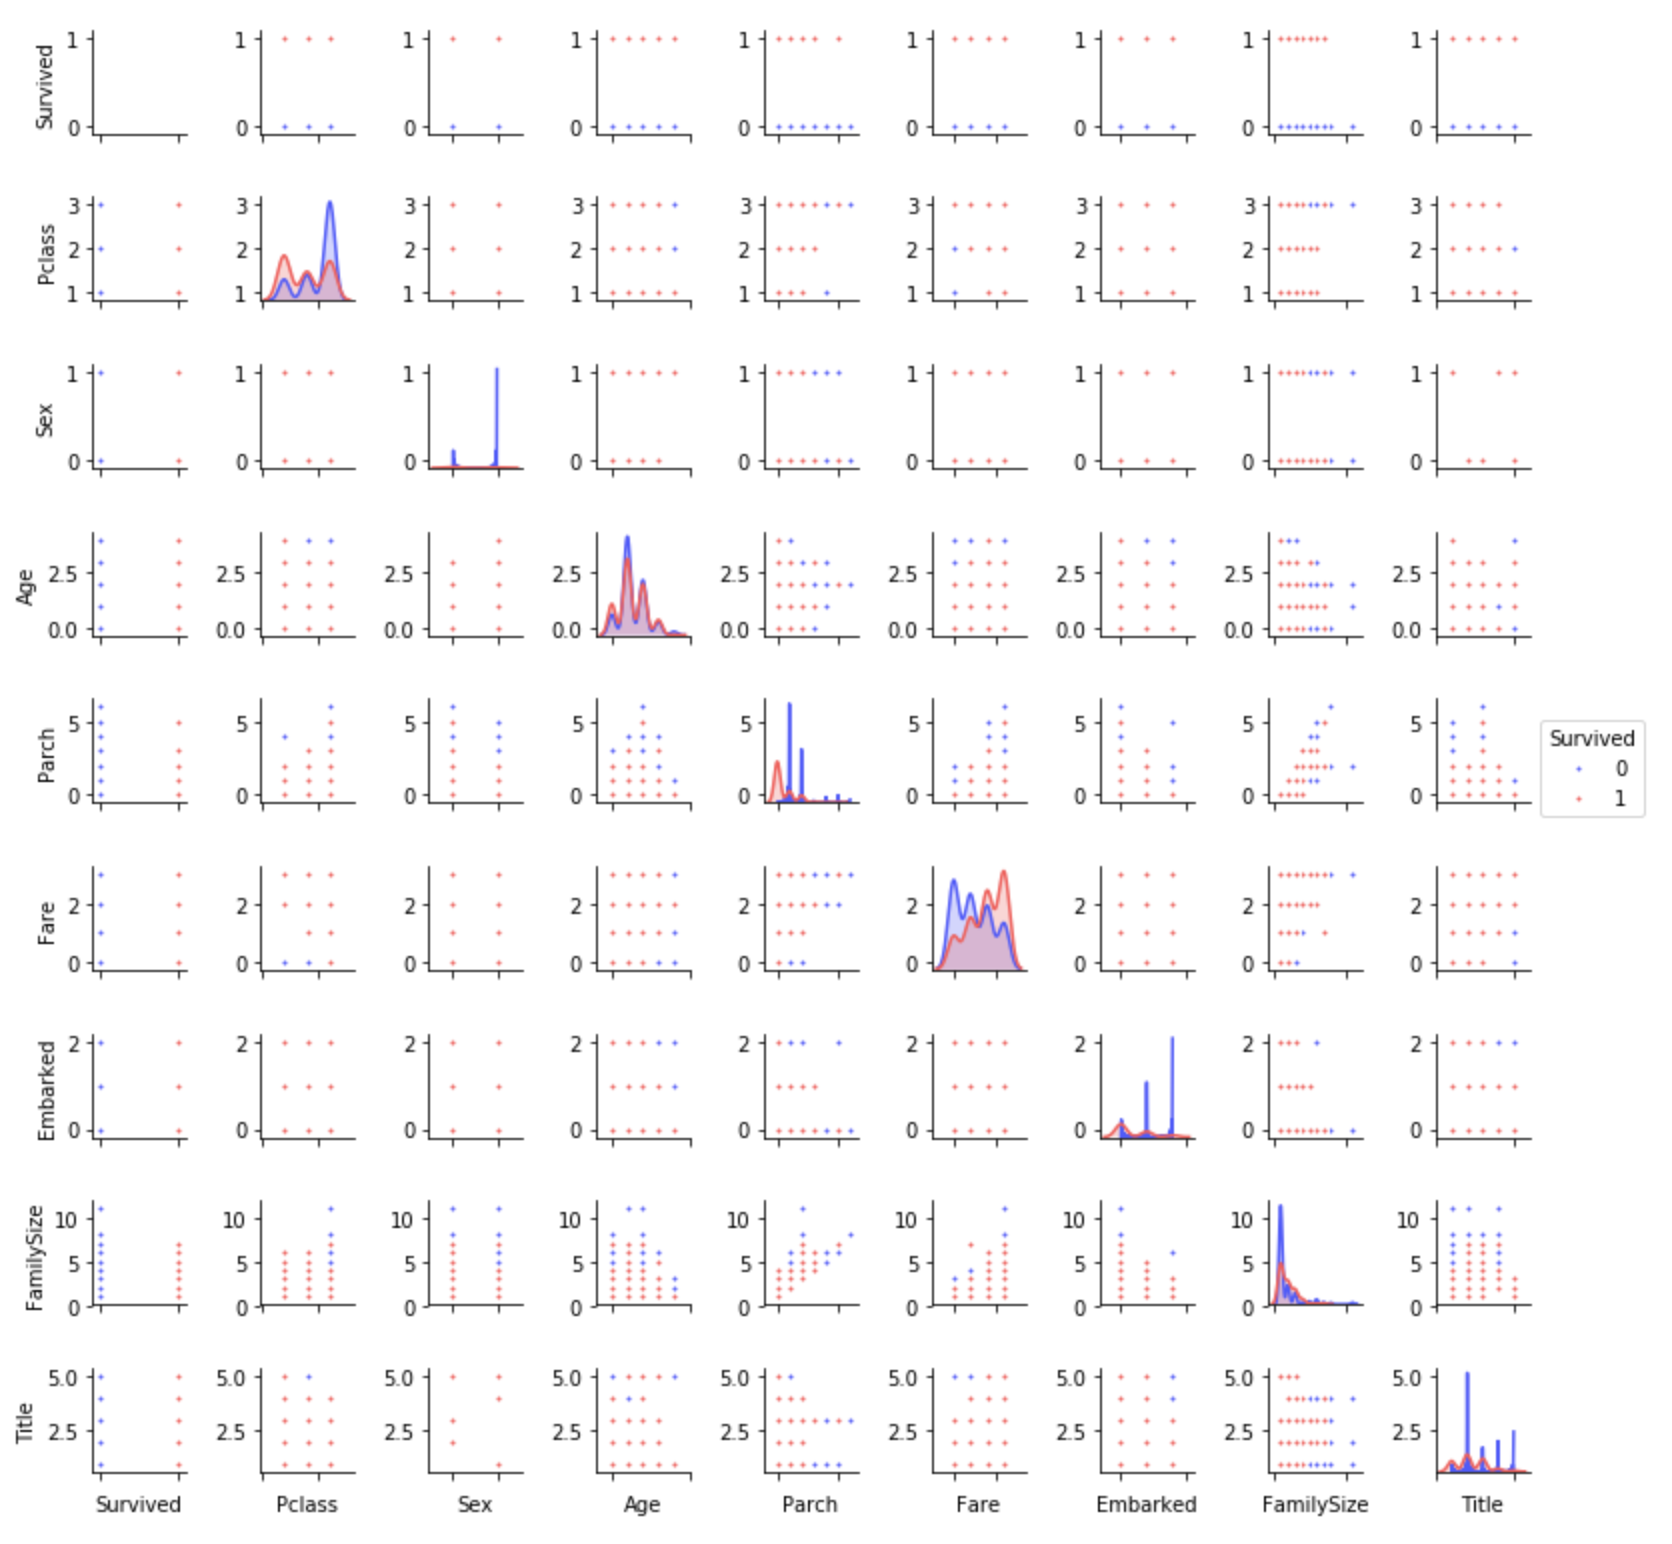
最後に、ある特徴から別の特徴へのデータの分布を見ておきます。
g = sns.pairplot(train[[u'Survived', u'Pclass', u'Sex', u'Age', u'Parch', u'Fare', u'Embarked',
       u'FamilySize', u'Title']], hue='Survived', palette = 'seismic',size=1.2,diag_kind = 'kde',diag_kws=dict(shade=True),plot_kws=dict(s=10) )
g.set(xticklabels=[])
Ensembling & Stacking models
スタッキングアンサンブルモデルを作成します。
Helpers via Python Classes
Pythonで先に学習・予測するためのクラスを定義しておきます。
# パラメータ
ntrain = train.shape[0] # 891
ntest = test.shape[0] # 418
SEED = 0
NFOLDS = 5 # 5分割
kf = KFold(ntrain, n_folds= NFOLDS, random_state=SEED)

# Sclearn分類機を拡張
class SklearnHelper(object):
    def __init__(self, clf, seed=0, params=None):
        params['random_state'] = seed
        self.clf = clf(**params)

    def train(self, x_train, y_train):
        self.clf.fit(x_train, y_train)

    def predict(self, x):
        return self.clf.predict(x)

    def fit(self,x,y):
        return self.clf.fit(x,y)

    def feature_importances(self,x,y):
        print(self.clf.fit(x,y).feature_importances_)
Out-of-Fold Predictions
スタッキングでは、第二モデルの学習データに、第一のベースモデルの予測が使用されます。
しかし、全ての学習・テストデータを一度に使ってしまうと、ベースモデルが既にテストデータを見た状態にあるため、第二モデルでオーバーフィットするリスクがあります。
そのため、交差検証を施します。
def get_oof(clf, x_train, y_train, x_test):
    oof_train = np.zeros((ntrain,))
    oof_test = np.zeros((ntest,))
    oof_test_skf = np.empty((NFOLDS, ntest))

    for i, (train_index, test_index) in enumerate(kf): # NFOLDS回まわる
        x_tr = x_train[train_index]
        y_tr = y_train[train_index]
        x_te = x_train[test_index]

        clf.train(x_tr, y_tr)

        oof_train[test_index] = clf.predict(x_te)
        oof_test_skf[i, :] = clf.predict(x_test)

    oof_test[:] = oof_test_skf.mean(axis=0)
    return oof_train.reshape(-1, 1), oof_test.reshape(-1, 1)
Generating our Base First-Level Models
第一のベースモデルとして、5つのモデルを準備します。
- Random Forest classifier
- Extra Trees classifier
- AdaBoost classifer
- Gradient Boosting classifer
- Support Vector Machine
参考:Random Forest とその派生アルゴリズム(Extra Trees classifier)
参考:機械学習⑤ アダブースト (AdaBoost) まとめ
参考:勾配ブースティングについてざっくりと説明する
Parameters
パラメータの一部をリストアップします。
- n_jobs:コア数。-1にすると全てのコア。
- n_estimators:学習モデルの分類木の数。デフォルトは10。
- max_depth:木の最大深度。あまりに大きすぎるとオーバーフィットする。
- verbose:学習プロセス中にテキストを出力するか。0なら出力しない。3なら繰り返し出力する。
その他の詳細は、Sklearnの公式ウェブサイトをご覧ください。
# 各モデルのパラメータ
# Random Forest
rf_params = {
    'n_jobs': -1,
    'n_estimators': 500,
     'warm_start': True,
     #'max_features': 0.2,
    'max_depth': 6,
    'min_samples_leaf': 2,
    'max_features' : 'sqrt',
    'verbose': 0
}

# Extra Trees
et_params = {
    'n_jobs': -1,
    'n_estimators':500,
    #'max_features': 0.5,
    'max_depth': 8,
    'min_samples_leaf': 2,
    'verbose': 0
}

# AdaBoost
ada_params = {
    'n_estimators': 500,
    'learning_rate' : 0.75
}

# Gradient Boosting
gb_params = {
    'n_estimators': 500,
     #'max_features': 0.2,
    'max_depth': 5,
    'min_samples_leaf': 2,
    'verbose': 0
}

# Support Vector Classifier
svc_params = {
    'kernel' : 'linear',
    'C' : 0.025
    }
さらに、Helpers via Python Classesで作成したクラスを用いて、5つの学習モデルのオブジェクトを作成します。
# 5つの学習モデルのオブジェクトを作成
rf = SklearnHelper(clf=RandomForestClassifier, seed=SEED, params=rf_params)
et = SklearnHelper(clf=ExtraTreesClassifier, seed=SEED, params=et_params)
ada = SklearnHelper(clf=AdaBoostClassifier, seed=SEED, params=ada_params)
gb = SklearnHelper(clf=GradientBoostingClassifier, seed=SEED, params=gb_params)
svc = SklearnHelper(clf=SVC, seed=SEED, params=svc_params)
Creating NumPy arrays out of our train and test sets
ベースモデルへの入力用データをNumPy配列で準備します。
# 入力データの作成
y_train = train['Survived'].ravel()
train = train.drop(['Survived'], axis=1)
x_train = train.values # 学習データ
x_test = test.values # テストデータ
Output of the First level Predictions
学習データとテストデータを5つのベースモデルに送り、交差検証(get_oof関数)を行い、予測を行います。
以下のプログラムの実行には、数分を要します。
# 5つのベースモデルで予測
et_oof_train, et_oof_test = get_oof(et, x_train, y_train, x_test) # Extra Trees Classifier
rf_oof_train, rf_oof_test = get_oof(rf,x_train, y_train, x_test) # Random Forest Classifier
ada_oof_train, ada_oof_test = get_oof(ada, x_train, y_train, x_test) # AdaBoost Classifier
gb_oof_train, gb_oof_test = get_oof(gb,x_train, y_train, x_test) # Gradient Boost Classifier
svc_oof_train, svc_oof_test = get_oof(svc,x_train, y_train, x_test) # Support Vector Classifier

print("Training is complete")
Training is complete
Feature importances generated from the different classifiers
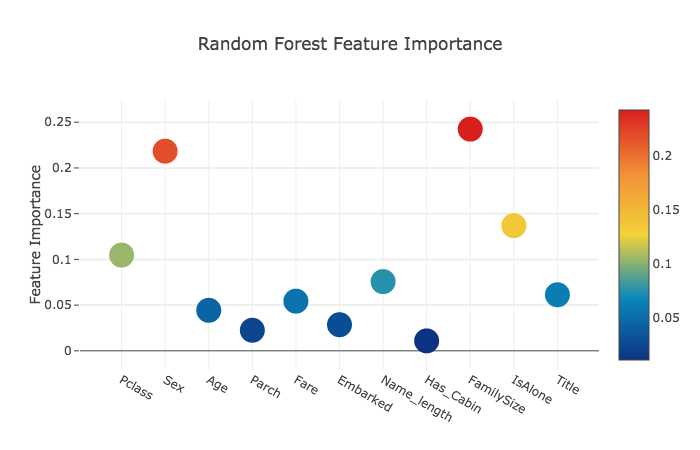
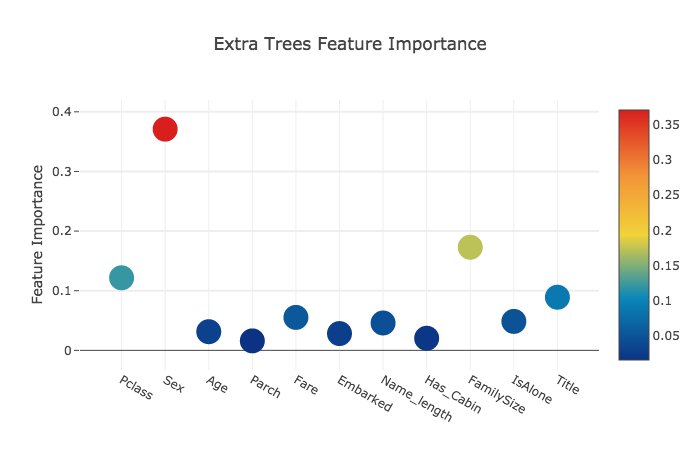
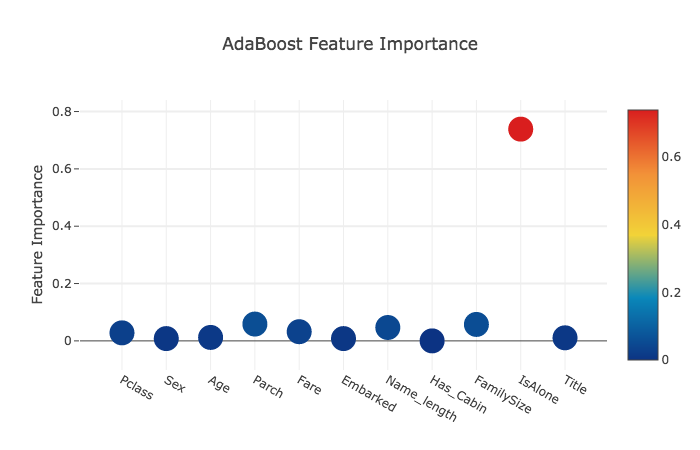
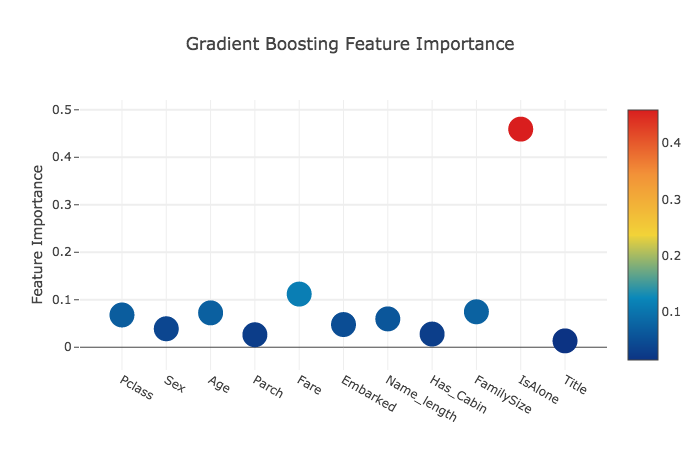
予測に関わる特徴の重要度を見ます。
rf_feature = rf.feature_importances(x_train,y_train)
et_feature = et.feature_importances(x_train, y_train)
ada_feature = ada.feature_importances(x_train, y_train)
gb_feature = gb.feature_importances(x_train,y_train)
[ 0.10474135 0.21837029 0.04432652 0.02249159 0.05432591 0.02854371
 0.07570305 0.01088129 0.24247496 0.13685733 0.06128402]
[ 0.12165657 0.37098307 0.03129623 0.01591611 0.05525811 0.028157
 0.04589793 0.02030357 0.17289562 0.04853517 0.08910063 ]
[ 0.028 0.008 0.012 0.05866667 0.032 0.008
 0.04666667 0.001 0.05733333 0.73866667 0.01066667 ]
[ 0.06796144 0.03889349 0.07237845 0.02628645 0.11194395 0.04778854
 0.05965792 0.02774745 0.07462718 0.4593142 0.01340093]
数値はそれぞれ、
[Pclass Sex Age Parch Fare Embarked Name_length Has_Cabin FmilySize IsAlone Title]
に値する。
その後、得られた特徴の重要度のリストを作成する。
rf_features = [0.10474135, 0.21837029, 0.04432652, 0.02249159, 0.05432591, 0.02854371,
 0.07570305, 0.01088129, 0.24247496, 0.13685733, 0.06128402]
et_features = [ 0.12165657, 0.37098307, 0.03129623, 0.01591611, 0.05525811, 0.028157,
 0.04589793, 0.02030357, 0.17289562, 0.04853517, 0.08910063]
ada_features = [0.028, 0.008, 0.012, 0.05866667, 0.032, 0.008,
 0.04666667, 0.001, 0.05733333, 0.73866667, 0.01066667]
gb_features = [ 0.06796144, 0.03889349, 0.07237845, 0.02628645, 0.11194395, 0.04778854,
 0.05965792, 0.02774745, 0.07462718, 0.4593142, 0.01340093]
特徴の重要度データフレームを作成する。
cols = train.columns.values
# 特徴の重要度データフレームを作成
feature_dataframe = pd.DataFrame( {'features': cols,
     'Random Forest feature importances': rf_features,
     'Extra Trees  feature importances': et_features,
      'AdaBoost feature importances': ada_features,
    'Gradient Boost feature importances': gb_features
    })

feature_dataframe

Interactive feature importances via Plotly scatterplots
特徴の重要度データフレームをプロットします。
# Random Forest 散布図
trace = go.Scatter(
    y = feature_dataframe['Random Forest feature importances'].values,
    x = feature_dataframe['features'].values,
    mode='markers',
    marker=dict(
        sizemode = 'diameter',
        sizeref = 1,
        size = 25,
#       size= feature_dataframe['AdaBoost feature importances'].values,
        #color = np.random.randn(500), #set color equal to a variable
        color = feature_dataframe['Random Forest feature importances'].values,
        colorscale='Portland',
        showscale=True
    ),
    text = feature_dataframe['features'].values
)
data = [trace]

layout= go.Layout(
    autosize= True,
    title= 'Random Forest Feature Importance',
    hovermode= 'closest',
#     xaxis= dict(
#         title= 'Pop',
#         ticklen= 5,
#         zeroline= False,
#         gridwidth= 2,
#     ),
    yaxis=dict(
        title= 'Feature Importance',
        ticklen= 5,
        gridwidth= 2
    ),
    showlegend= False
)
fig = go.Figure(data=data, layout=layout)
py.iplot(fig,filename='scatter2010')

# Extra Trees 散布図
trace = go.Scatter(
    y = feature_dataframe['Extra Trees  feature importances'].values,
    x = feature_dataframe['features'].values,
    mode='markers',
    marker=dict(
        sizemode = 'diameter',
        sizeref = 1,
        size = 25,
#       size= feature_dataframe['AdaBoost feature importances'].values,
        #color = np.random.randn(500), #set color equal to a variable
        color = feature_dataframe['Extra Trees  feature importances'].values,
        colorscale='Portland',
        showscale=True
    ),
    text = feature_dataframe['features'].values
)
data = [trace]

layout= go.Layout(
    autosize= True,
    title= 'Extra Trees Feature Importance',
    hovermode= 'closest',
#     xaxis= dict(
#         title= 'Pop',
#         ticklen= 5,
#         zeroline= False,
#         gridwidth= 2,
#     ),
    yaxis=dict(
        title= 'Feature Importance',
        ticklen= 5,
        gridwidth= 2
    ),
    showlegend= False
)
fig = go.Figure(data=data, layout=layout)
py.iplot(fig,filename='scatter2010')

# AdaBoost 散布図
trace = go.Scatter(
    y = feature_dataframe['AdaBoost feature importances'].values,
    x = feature_dataframe['features'].values,
    mode='markers',
    marker=dict(
        sizemode = 'diameter',
        sizeref = 1,
        size = 25,
#       size= feature_dataframe['AdaBoost feature importances'].values,
        #color = np.random.randn(500), #set color equal to a variable
        color = feature_dataframe['AdaBoost feature importances'].values,
        colorscale='Portland',
        showscale=True
    ),
    text = feature_dataframe['features'].values
)
data = [trace]

layout= go.Layout(
    autosize= True,
    title= 'AdaBoost Feature Importance',
    hovermode= 'closest',
#     xaxis= dict(
#         title= 'Pop',
#         ticklen= 5,
#         zeroline= False,
#         gridwidth= 2,
#     ),
    yaxis=dict(
        title= 'Feature Importance',
        ticklen= 5,
        gridwidth= 2
    ),
    showlegend= False
)
fig = go.Figure(data=data, layout=layout)
py.iplot(fig,filename='scatter2010')

# Gradient Boosting 散布図
trace = go.Scatter(
    y = feature_dataframe['Gradient Boost feature importances'].values,
    x = feature_dataframe['features'].values,
    mode='markers',
    marker=dict(
        sizemode = 'diameter',
        sizeref = 1,
        size = 25,
#       size= feature_dataframe['AdaBoost feature importances'].values,
        #color = np.random.randn(500), #set color equal to a variable
        color = feature_dataframe['Gradient Boost feature importances'].values,
        colorscale='Portland',
        showscale=True
    ),
    text = feature_dataframe['features'].values
)
data = [trace]

layout= go.Layout(
    autosize= True,
    title= 'Gradient Boosting Feature Importance',
    hovermode= 'closest',
#     xaxis= dict(
#         title= 'Pop',
#         ticklen= 5,
#         zeroline= False,
#         gridwidth= 2,
#     ),
    yaxis=dict(
        title= 'Feature Importance',
        ticklen= 5,
        gridwidth= 2
    ),
    showlegend= False
)
fig = go.Figure(data=data, layout=layout)
py.iplot(fig,filename='scatter2010')
次に、特徴の重要度の平均を計算して、データフレームを作成します。
# 特徴の重要度の平均を計算

feature_dataframe['mean'] = feature_dataframe.mean(axis= 1) # axis = 1:行
feature_dataframe.head(3)

Plotly Barplot of Average Feature Importances
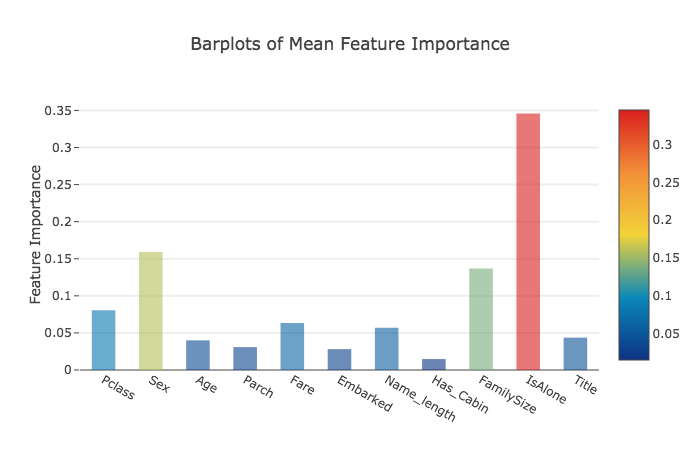
全ての分類器で特徴の重要度の平均が得られたら、次のように棒グラフで表すことができます。
y = feature_dataframe['mean'].values
x = feature_dataframe['features'].values
data = [go.Bar(
            x= x,
             y= y,
            width = 0.5,
            marker=dict(
               color = feature_dataframe['mean'].values,
            colorscale='Portland',
            showscale=True,
            reversescale = False
            ),
            opacity=0.6
        )]

layout= go.Layout(
    autosize= True,
    title= 'Barplots of Mean Feature Importance',
    hovermode= 'closest',
#     xaxis= dict(
#         title= 'Pop',
#         ticklen= 5,
#         zeroline= False,
#         gridwidth= 2,
#     ),
    yaxis=dict(
        title= 'Feature Importance',
        ticklen= 5,
        gridwidth= 2
    ),
    showlegend= False
)
fig = go.Figure(data=data, layout=layout)
py.iplot(fig, filename='bar-direct-labels')
Second-Level Predictions from the First-level Output
First-level output as new features
ベースモデルの予測値を使って、第二モデルを学習します。
まずは、ベースモデルの予測値データフレームを作成します。
base_predictions_train = pd.DataFrame( {'RandomForest': rf_oof_train.ravel(),
     'ExtraTrees': et_oof_train.ravel(),
     'AdaBoost': ada_oof_train.ravel(),
      'GradientBoost': gb_oof_train.ravel()
    })
print('base_predictions_train.shape : ', base_predictions_train.shape)
base_predictions_train.head(5)
base_predictions_train.shape : (891, 4)

Correlation Heatmap of the Second Level Training set
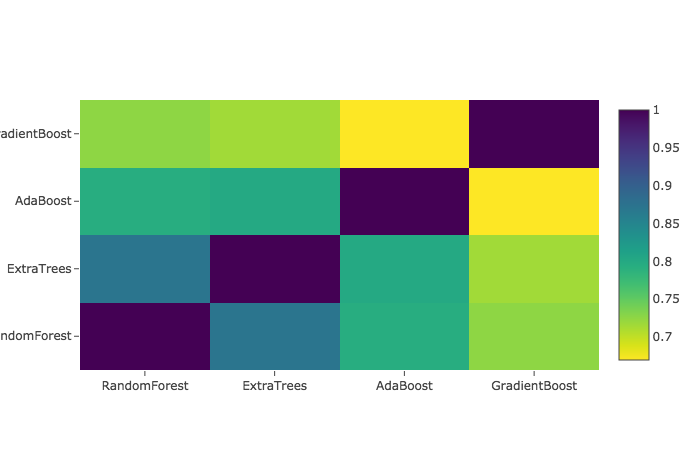
ベースモデルの予測値の相関を見ます。
data = [
    go.Heatmap(
        z= base_predictions_train.astype(float).corr().values ,
        x=base_predictions_train.columns.values,
        y= base_predictions_train.columns.values,
          colorscale='Viridis',
            showscale=True,
            reversescale = True
    )
]
py.iplot(data, filename='labelled-heatmap')
ベースモデルの予測値を結合して、第二モデルの学習データとテストデータを作成します。
x_train = np.concatenate(( et_oof_train, rf_oof_train, ada_oof_train, gb_oof_train, svc_oof_train), axis=1)
x_test = np.concatenate(( et_oof_test, rf_oof_test, ada_oof_test, gb_oof_test, svc_oof_test), axis=1)
print('x_train.shape : ', x_train.shape)
print('x_test.shape : ', x_test.shape)
x_train.shape :  (891, 5)
x_test.shape :  (418, 5)
ここまでで、第二モデル用の学習データ(x_train)とテストデータ(x_test)をベースモデルより作成することができました。
Second level learning model via XGBoost
第二モデルにはXGBoostモデルを使用します。
アルゴリズムの詳細は公式のドキュメントをご覧ください。
とにかく、ベースモデルで作った学習・テストデータを、XGBoostモデルを使って学習・予測します。
gbm = xgb.XGBClassifier(
    #learning_rate = 0.02,
 n_estimators= 2000,
 max_depth= 4,
 min_child_weight= 2,
 #gamma=1,
 gamma=0.9,
 subsample=0.8,
 colsample_bytree=0.8,
 objective= 'binary:logistic',
 nthread= -1,
 scale_pos_weight=1).fit(x_train, y_train)
predictions = gbm.predict(x_test)
Parameters
- max_depth:木の最大深度。あまりに大きすぎるとオーバーフィットする。
- gamma:最適化パラメータ。大きくすると控えめなアルゴリズムになる。
- eta:オーバーフィットを防止するためのパラメータ。
Producing the Submission file
Kaggleに提出するためのCSVフォーマットに書き出します。
# CSVファイルの作成
StackingSubmission = pd.DataFrame({ 'PassengerId': PassengerId,
                            'Survived': predictions })
StackingSubmission.to_csv("StackingSubmission.csv", index=False)
Steps for Further Improvement
紹介したのは、非常に簡単なスタッキングアンサンブル学習の方法なので、まだまだ改善点はあることに注意してください。
Kaggleの上位者になると、2段以上のモデルを組み合わせたアンサンブル学習を使っていることもあるようです。
まだまだスコアを向上させるために以下のようなステップが考えられます。
- 最適なパラメータを見つけるために、交差検証を工夫する。
- 他のベースモデルを使用する。互いのベースモデルに相関がないほど最終スコアは高くなる。
Conclusion
スタッキングやアンサンブル学習に関するその他の資料については、「KAGGLE ENSEMBLING GUIDE」を参照してください。
最後に
参考程度に、Producing the Submission fileで書き出した予測結果は、79.904%で、Kaggleでの順位は1618位でした。

