1
0

Delete article

Deleted articles cannot be recovered.

Draft of this article would be also deleted.

Are you sure you want to delete this article?

More than 3 years have passed since last update.

Azureでデータ活用してみる(データ可視化編)

Posted at

概要

Azure Databricks notebooks上でもデータの可視化が可能でしたが、Azureでデータ可視化と言えば、言わずもがなPower BIが候補に挙がってくるのではないでしょうか。
そこで、Power BIを利用してみたいと思います。

Azure DatabricksとPower BIの連携

アクセス情報の確認

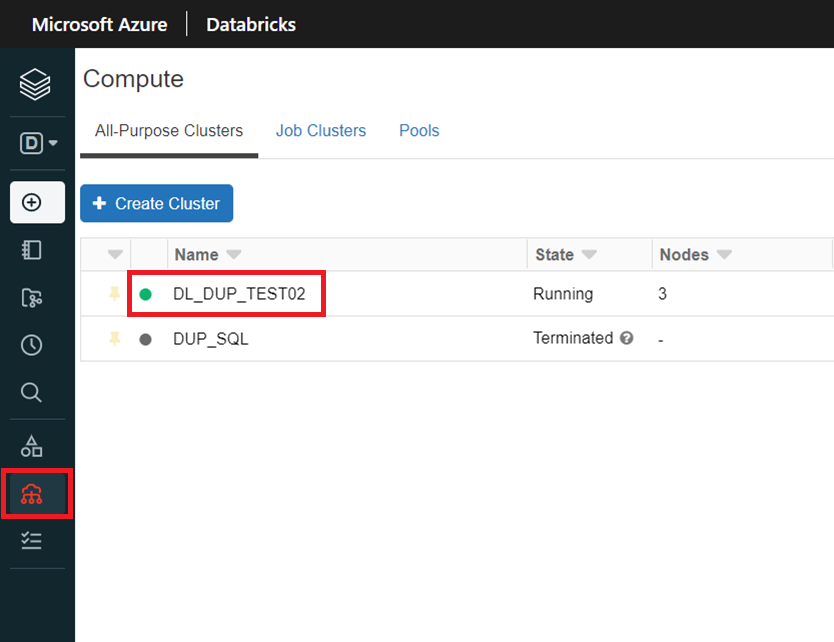
[Compute]から使用するクラスタを選択
Databricks_クラスタ選択.png

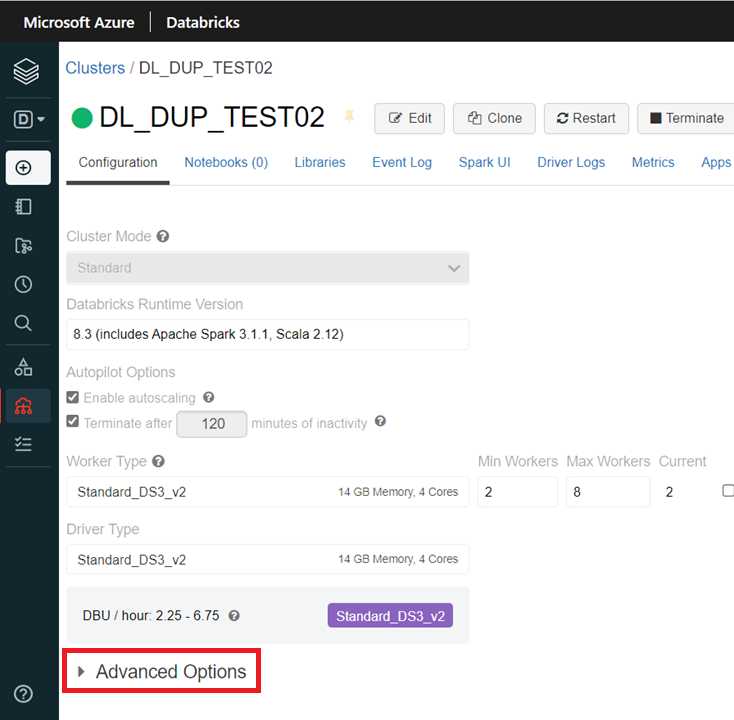
[Advanced Option]をクリック
Databricks_AdvancedOptions.png

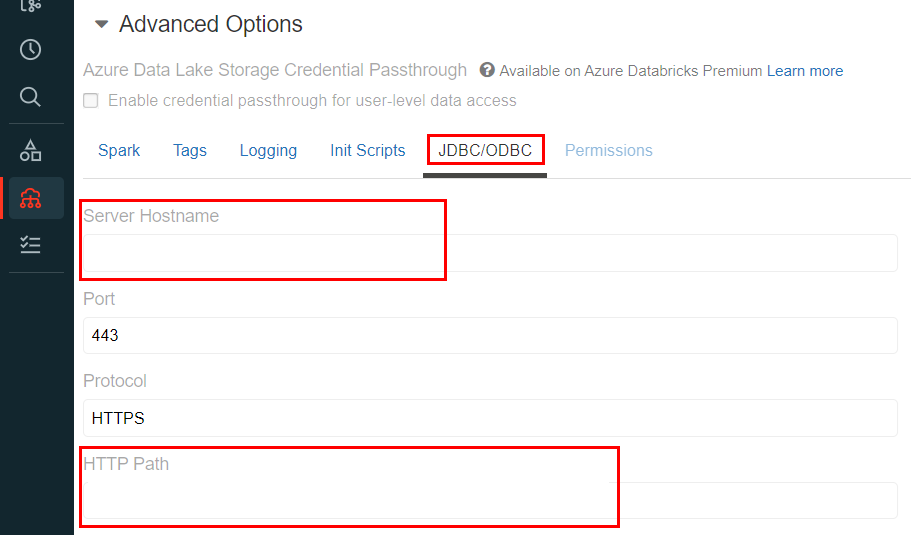
[JDBC/ODBC]を選択し、[Server Hostname]と[HTTP Path]をメモ
Databricks_JDBC.png

アクセストークン発行
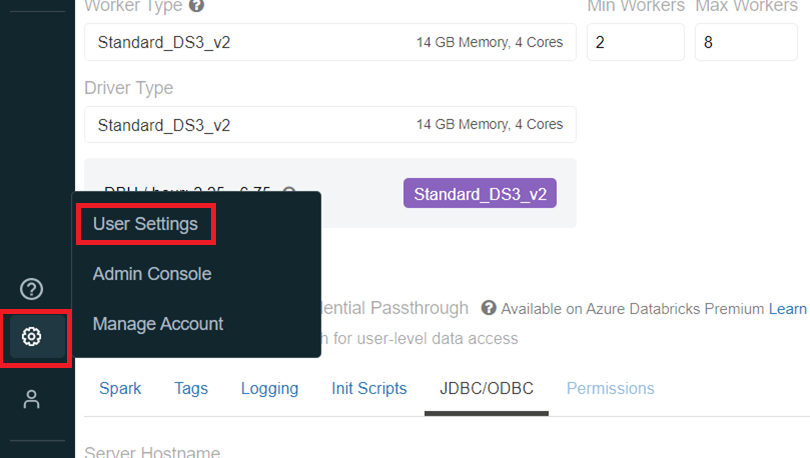
左下の歯車アイコンから、[User Setting]をクリック
Databricks_User Settings.png

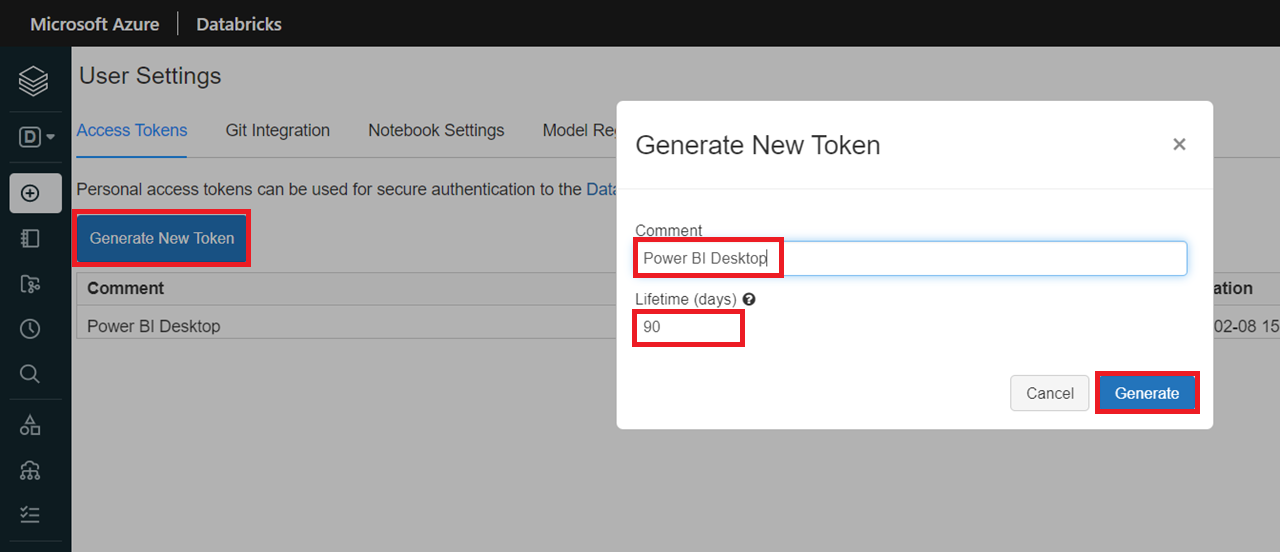
[Generate New Token]を選択。トークンの名称と有効期限を任意で入力し、[Generate]をクリック
Databricks_GenerateToken.png

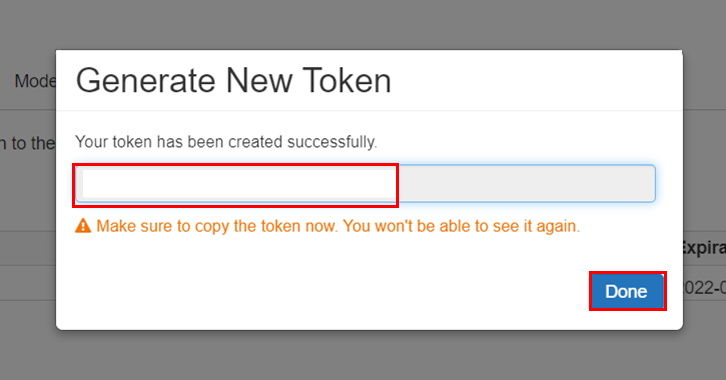
アクセストークンキーが発行されるので、これもメモしておき[Done]をクリック
※紛失するとトークンの使用が不可能になるので注意が必要
Databricks_Token.png

Power BI DesktopにAzure Databricksを接続

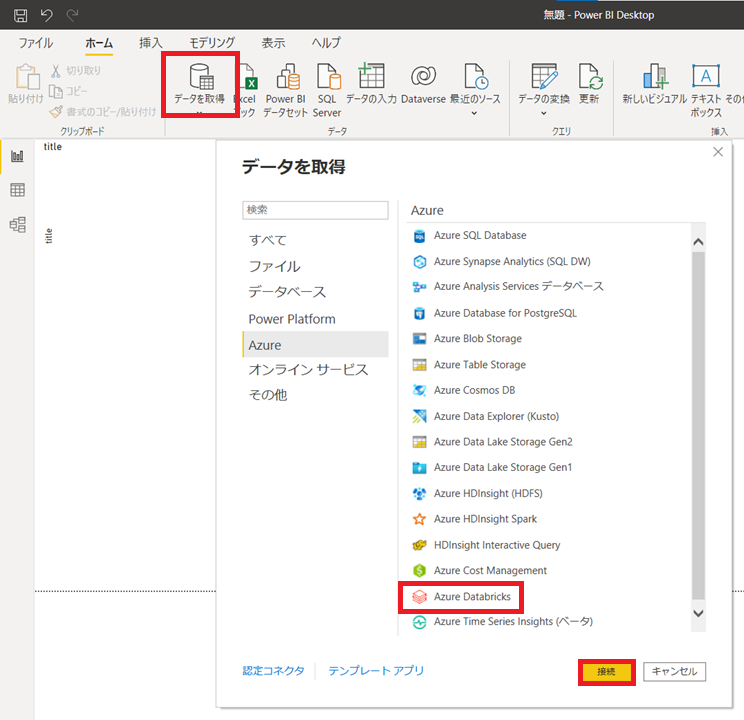
Power BI Desktopをインストールし起動後、左上のデータの取得をクリック。[Azure Databricks]を選択し、[接続]をクリック
PowerBI_GetData.png

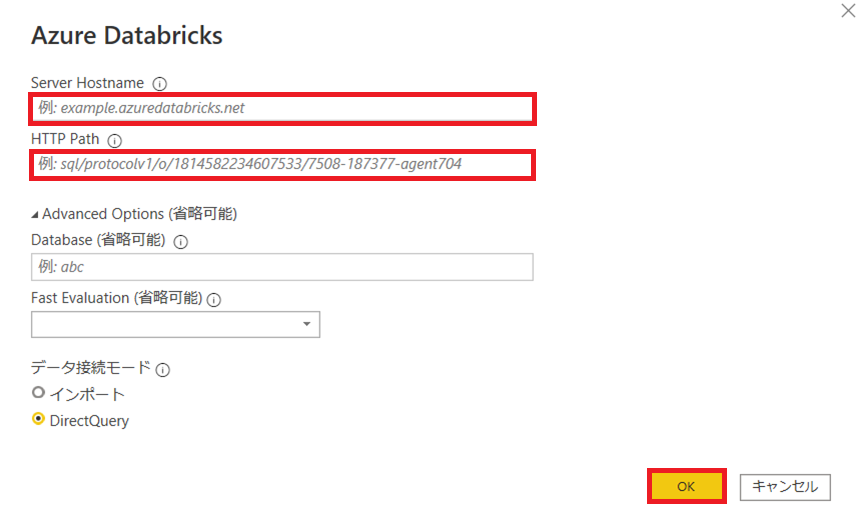
メモしておいた[[Server Hostname]と[HTTP Path]を入力して[OK]をクリック
PowerBI_Path.png

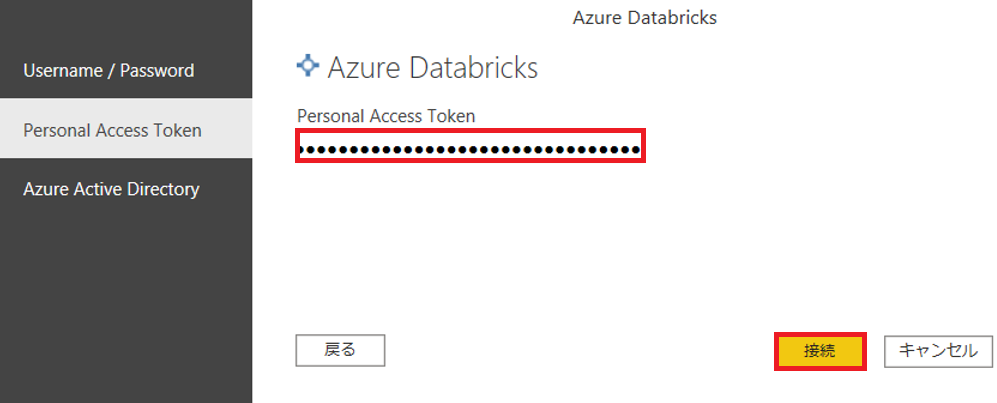
[Personal Access Token]を選択。メモしておいたトークンIDを入力し、接続をクリック
PowerBI_PersonalAccessToken.png

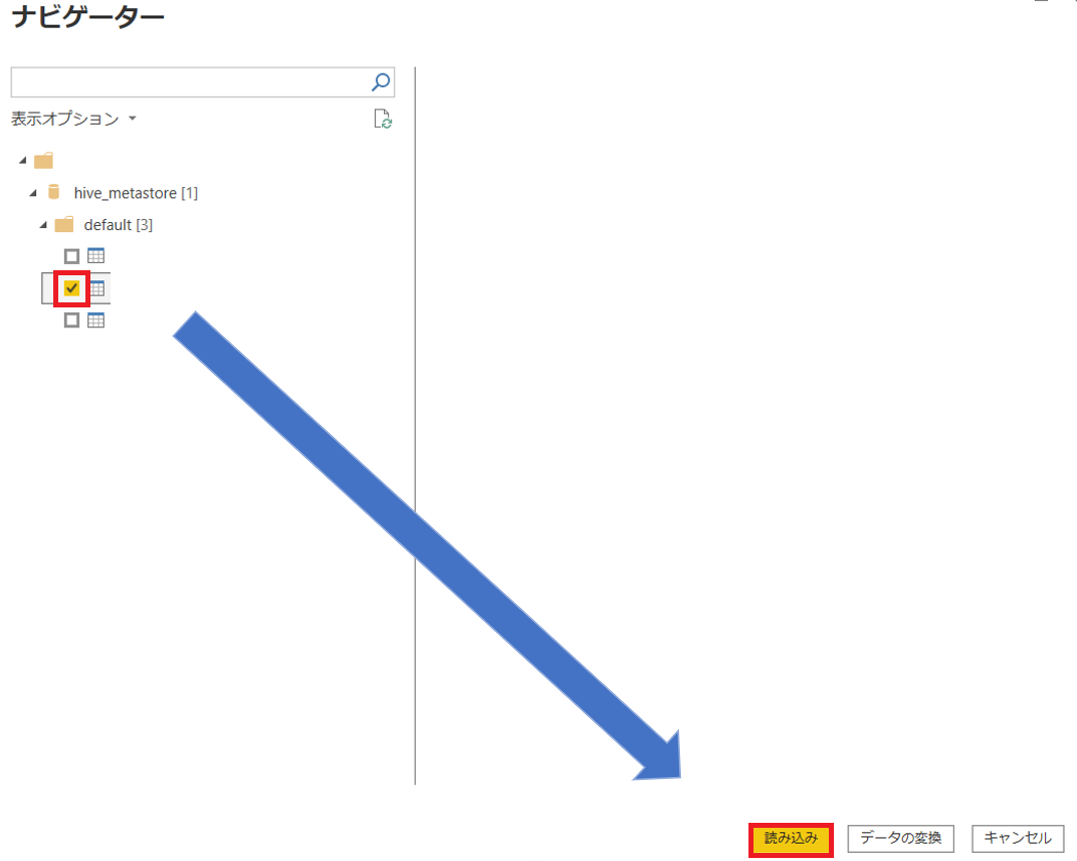
これで Databricksで作成されたテーブルを取り込むことができます。
PowerBI_Data.png

まとめ

Azure Databricksで作成したテーブルの情報を可視化する事が出来ました。
Power BIの他に、Azure Data Explorerのダッシュボードやworkbookも試しておりましたが、可視化データの共有も考慮したところ、Power BIを利用することで進めます。

1
0
0

Register as a new user and use Qiita more conveniently

  1. You get articles that match your needs
  2. You can efficiently read back useful information
  3. You can use dark theme
What you can do with signing up
1
0

Delete article

Deleted articles cannot be recovered.

Draft of this article would be also deleted.

Are you sure you want to delete this article?