はじめに
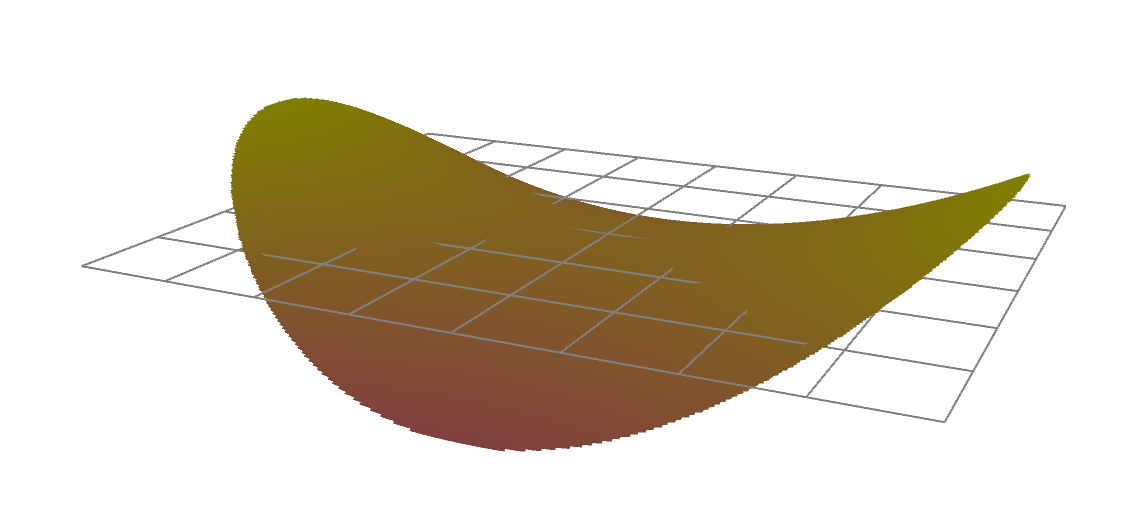
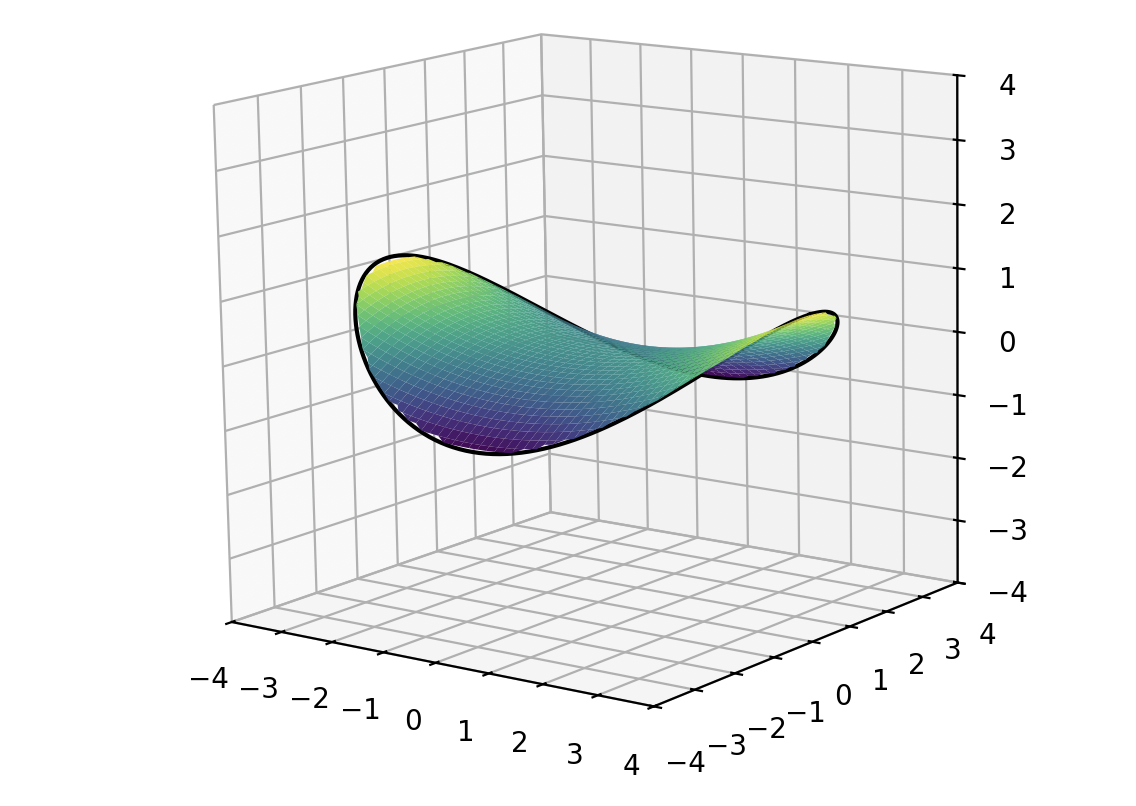
プリングルス形状を数式で表現しました。
実測してないので、不正確です。
双曲放物面(hyperbolic paraboloid)の一部です。
スタックしやすく、割れにくい構造だそうです。
チップスターは円柱の一部に近いので、似た形だけれど、数学的には異なります。
環境
Processing 4.4.10
python 3.10.8
方程式
z(x,y)=
\left( \frac{x}{4} \right)^{2}
-
\left( \frac{y}{3} \right)^{2}
\qquad
for
\left( \frac{x}{4} \right)^{2}
+
\left( \frac{y}{3} \right)^{2}
\le 1
Processing
// プリングルス曲面(a=4, b=3)
// z = (x/4)^2 - (y/3)^2
// (x/4)^2 + (y/3)^2 <= 1 の範囲のみ描画
float a = 4.0;
float b = 3.0;

float angleX = 0;
float angleZ = 0;

void setup() {
  size(800, 800, P3D);
}

void draw() {
  background(255);
  lights();

  translate(width/2, height/2);

  // マウスで回転
  if (mousePressed) {
    angleX += (mouseY - pmouseY) * 0.01;
    angleZ += (mouseX - pmouseX) * 0.01;
  }

  rotateX(-angleX);
  rotateZ(-angleZ);

  float s = 50;
  scale(s, -s, s);

  float xmin = -a;
  float xmax =  a;
  float ymin = -b;
  float ymax =  b;

  float step = 0.02;

  // === XY平面グリッド ===
  stroke(128);
  strokeWeight(1.0/s);
  for (float gx = xmin; gx <= xmax; gx += 1.0) {
    line(gx, ymin, 0, gx, ymax, 0);
  }
  for (float gy = ymin; gy <= ymax; gy += 1.0) {
    line(xmin, gy, 0, xmax, gy, 0);
  }

  // === 曲面 ===
  noStroke();
  for (float y = ymin; y < ymax; y += step) {
    beginShape(TRIANGLE_STRIP);

    for (float x = xmin; x <= xmax; x += step) {
      if (sq(x/a) + sq(y/b) <= 1.0) {
        float z1 = sq(x/a) - sq(y/b);
        float z2 = sq(x/a) - sq((y+step)/b);

        float c = map(z1, -1, 1, 128, 255);
        fill(255, c, 255-c);

        vertex(x, y, z1);
        vertex(x, y+step, z2);
      }
    }

    endShape();
  }
}
Python + matplot
import numpy as np
import matplotlib.pyplot as plt
from matplotlib.widgets import Slider

# ---------------------------------
# 初期パラメータ
# ---------------------------------
initial_a = 4.0
initial_b = 3.0
num = 100

# メッシュ座標
xmin, xmax = -4, 4
ymin, ymax = -4, 4
x = np.linspace(xmin, xmax, num)
y = np.linspace(ymin, ymax, num)
X, Y = np.meshgrid(x, y)

def calc_Z(a, b):
    Z = (X**2)/(a*a) - (Y**2)/(b*b)
    ellipse = (X**2)/(a*a) + (Y**2)/(b*b)
    return np.where(ellipse <= 1.0, Z, np.nan)

# ---------------------------------
# Figure
# ---------------------------------
fig = plt.figure(figsize=(8, 7))
plt.subplots_adjust(bottom=0.25)
ax = fig.add_subplot(111, projection='3d')

# ---- 初回描画 ----
Z0 = calc_Z(initial_a, initial_b)
surf = ax.plot_surface(X, Y, Z0, cmap='viridis', linewidth=0)

# ---- 外周の楕円(滑らか境界用)----
theta = np.linspace(0, 2*np.pi, 400)
ellipse_x = np.cos(theta) * initial_a
ellipse_y = np.sin(theta) * initial_b
ellipse_z = (ellipse_x**2)/(initial_a**2) - (ellipse_y**2)/(initial_b**2)
line = ax.plot(ellipse_x, ellipse_y, ellipse_z, color="k", linewidth=1.5)[0]

# ---- 軸設定 ----
ax.set_xlim(-4, 4)
ax.set_ylim(-4, 4)
ax.set_zlim(-4, 4)

# ★★ 等倍率(ここが重要) ★★
ax.set_box_aspect([1, 1, 1])

ax.view_init(30, -45)

# ---------------------------------
# スライダー
# ---------------------------------
ax_a = fig.add_axes([0.2, 0.10, 0.60, 0.03])
ax_b = fig.add_axes([0.2, 0.05, 0.60, 0.03])
slider_a = Slider(ax_a, 'a', 0.3, 4.0, valinit=initial_a, valstep=0.05)
slider_b = Slider(ax_b, 'b', 0.3, 4.0, valinit=initial_b, valstep=0.05)

# ---------------------------------
# 更新関数
# ---------------------------------
def update(val):
    a = slider_a.val
    b = slider_b.val

    ax.clear()

    # Z再計算
    Z = calc_Z(a, b)
    ax.plot_surface(X, Y, Z, cmap='viridis', linewidth=0)

    # 外周の滑らかな楕円
    ex = np.cos(theta) * a
    ey = np.sin(theta) * b
    ez = (ex*ex)/(a*a) - (ey*ey)/(b*b)
    ax.plot(ex, ey, ez, color="k", linewidth=1.5)

    # 軸設定
    ax.set_xlim(-4, 4)
    ax.set_ylim(-4, 4)
    ax.set_zlim(-4, 4)
    ax.set_box_aspect([1, 1, 1])
    ax.view_init(30, -45)

    fig.canvas.draw_idle()

slider_a.on_changed(update)
slider_b.on_changed(update)

plt.show()