#2、Overlay表示
(注)2025年7月xdomainサーバーの提供停止に伴い、本記事のサンプル(リンク)は使用できなくなりました。
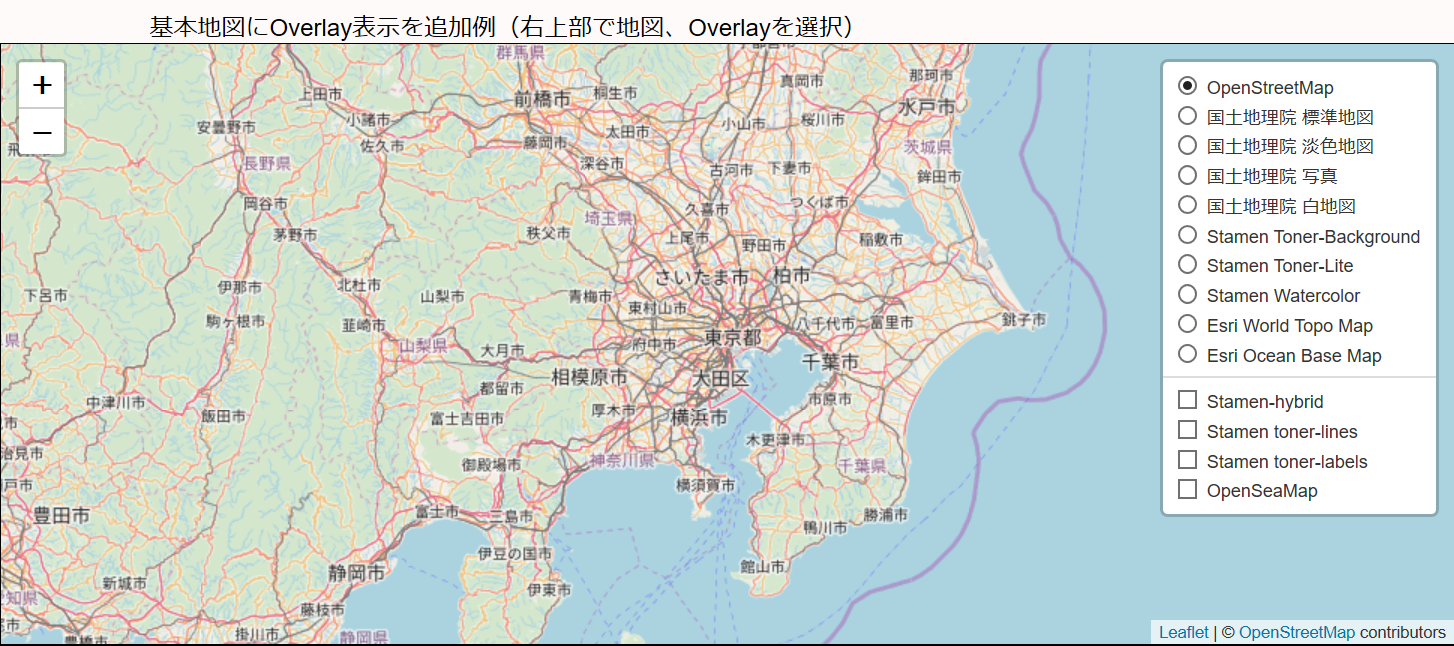
##2-1、基本地図にOverlay表示を追加
次に基本地図上に別のデータを重ねてみましょう。 次の例では、地図上に地名や境界線等を重ね書きする場合について示します。 HTML部分とJAVA Script部における基本地図を表示する部分は、『Leaflet_Tutrial_104.html』の内容とほぼ同じです。 地図の表示例とソースファイル内容を示します。 但し、初期状態ではOverLay部を表示しない設定ですので、右上のマークにマウスを合わせて下段の四角(□)マークにチェックを入れると選択された表示がされます。 なお、『OpenSeaMark』については、ある程度地図が拡大された場合に表示されます。 実際の表示を確認したい方は、こちらをクリックしてください。
ソースファイルの内容
<!DOCTYPE html>
<html>
<head>
<title>Leaflet_Tutrial_201.html 2019/4/26 by T. Fujita</title>
<meta charset = "utf-8" />
<link rel = "stylesheet" href = "https://unpkg.com/leaflet@1.4.0/dist/leaflet.css" />
<script src = "https://unpkg.com/leaflet@1.4.0/dist/leaflet.js"></script>
<script>
function init() {
var Basic_Map = new Array();
Basic_Map[ 0 ] = L.tileLayer('https://{s}.tile.openstreetmap.org/{z}/{x}/{y}.png', {
attribution: '© <a href="https://www.openstreetmap.org/copyright">OpenStreetMap</a> contributors',
continuousWorld: false
});
Basic_Map[ 1 ] = L.tileLayer('https://cyberjapandata.gsi.go.jp/xyz/std/{z}/{x}/{y}.png', {
attribution: "<a href='https://maps.gsi.go.jp/development/ichiran.html' target='_blank'>地理院タイル</a>"
});
Basic_Map[ 2 ] = L.tileLayer('https://cyberjapandata.gsi.go.jp/xyz/pale/{z}/{x}/{y}.png', {
attribution: "<a href='https://maps.gsi.go.jp/development/ichiran.html' target='_blank'>地理院タイル</a>"
});
Basic_Map[ 3 ] = L.tileLayer('https://cyberjapandata.gsi.go.jp/xyz/seamlessphoto/{z}/{x}/{y}.jpg', {
attribution: "<a href='https://maps.gsi.go.jp/development/ichiran.html' target='_blank'>地理院タイル</a>"
});
Basic_Map[ 4 ] = L.tileLayer('https://cyberjapandata.gsi.go.jp/xyz/blank/{z}/{x}/{y}.png', {
attribution: "<a href='https://maps.gsi.go.jp/development/ichiran.html' target='_blank'>地理院タイル</a>"
});
Basic_Map[ 5 ] = L.tileLayer('http://{s}.tile.stamen.com/{variant}/{z}/{x}/{y}.png', {
attribution: 'Map tiles by <a href="http://stamen.com">Stamen Design</a>, ',
variant: 'toner-background'
});
Basic_Map[ 6 ] = L.tileLayer('http://{s}.tile.stamen.com/{variant}/{z}/{x}/{y}.png', {
attribution: 'Map tiles by <a href="http://stamen.com">Stamen Design</a>, ',
variant: 'toner-lite'
});
Basic_Map[ 7 ] = L.tileLayer('http://{s}.tile.stamen.com/{variant}/{z}/{x}/{y}.png', {
minZoom: 1,
maxZoom: 16,
attribution: 'Map tiles by <a href="http://stamen.com">Stamen Design</a>, ',
variant: 'watercolor'
});
Basic_Map[ 8 ] = L.tileLayer('http://server.arcgisonline.com/ArcGIS/rest/services/World_Topo_Map/MapServer/tile/{z}/{y}/{x}', {
attribution: 'Tiles © <a href="http://www.esrij.com/"> Esri Japan </a>'
});
Basic_Map[ 9 ] = L.tileLayer('http://server.arcgisonline.com/ArcGIS/rest/services/Ocean_Basemap/MapServer/tile/{z}/{y}/{x}', {
maxZoom: 13,
attribution: 'Tiles by <a href="http://www.esrij.com/"> Esri Japan </a>'
});
var map_201 = L.map('map_201').setView([35.65809922, 139.74135747], 10);
map_201.addLayer( Basic_Map[ 0 ] );
var baseMap = {
"OpenStreetMap": Basic_Map[ 0 ],
"国土地理院 標準地図": Basic_Map[ 1 ],
"国土地理院 淡色地図": Basic_Map[ 2 ],
"国土地理院 写真": Basic_Map[ 3 ],
"国土地理院 白地図": Basic_Map[ 4 ],
"Stamen Toner-Background": Basic_Map[ 5 ],
"Stamen Toner-Lite": Basic_Map[ 6 ],
"Stamen Watercolor": Basic_Map[ 7 ],
"Esri World Topo Map": Basic_Map[ 8 ],
"Esri Ocean Base Map": Basic_Map[ 9 ],
};
var Over_Layer = new Array();
Over_Layer[ 0 ] = L.tileLayer('http://{s}.tile.stamen.com/{variant}/{z}/{x}/{y}.png', {
attribution: 'Map tiles by <a href="http://stamen.com">Stamen Design</a>, ' +
'<a href="http://creativecommons.org/licenses/by/3.0">CC BY 3.0</a> — ' +
'Map data {attribution.OpenStreetMap}',
variant: 'toner-hybrid'
});
Over_Layer[ 1 ] = L.tileLayer('http://{s}.tile.stamen.com/{variant}/{z}/{x}/{y}.png', {
attribution: 'Map tiles by <a href="http://stamen.com">Stamen Design</a>, ' +
'<a href="http://creativecommons.org/licenses/by/3.0">CC BY 3.0</a> — ' +
'Map data {attribution.OpenStreetMap}',
variant: 'toner-lines'
});
Over_Layer[ 2 ] = L.tileLayer('http://{s}.tile.stamen.com/{variant}/{z}/{x}/{y}.png', {
attribution: 'Map tiles by <a href="http://stamen.com">Stamen Design</a>, ' +
'<a href="http://creativecommons.org/licenses/by/3.0">CC BY 3.0</a> — ' +
'Map data {attribution.OpenStreetMap}',
variant: 'toner-labels'
});
Over_Layer[ 3 ] = L.tileLayer('http://tiles.openseamap.org/seamark/{z}/{x}/{y}.png', {
attribution: "<a href='http://www.openseamap.org' target='_blank'>OpenSeaMap</a> contributors"
});
var overLay_201 = {
"Stamen-hybrid": Over_Layer[ 0 ],
"Stamen toner-lines": Over_Layer[ 1 ],
"Stamen toner-labels": Over_Layer[ 2 ],
"OpenSeaMap": Over_Layer[ 3 ],
};
L.control.layers(baseMap, overLay_201).addTo(map_201);
}
</script>
</head>
<body onload="init()">
<div id="map_201" style="width: 100%; height: 400px; border: solid 1px"></div>
</body>
</html>
29行目から49行目までの部分でOverlay用データをそれぞれの配列に収容後、57行目の『L.control』で基本地図とOverlayデータを選択するようにしています。
##2-2、Pluginを使用したOverlay表示
次にPluginを使用したOverLayを追加してみましょう。 Pluginを使用して地図を表示する場合には、Leafletのホームページ等で公開されているPluginが必要です。 今回は、NASAの地形データならびにUSGSの地震データを表示させますので次のPluginを使用します。
・Leaflet.GIBS: NASAの地形データ表示用
・Leaflet Ajax: USGSの地震データJSON版表示用
地図の表示例とHTML及びJAVA Scriptのソースファイル内容を以下に示します。 実際の表示を確認したい方は、こちらをクリックしてください。
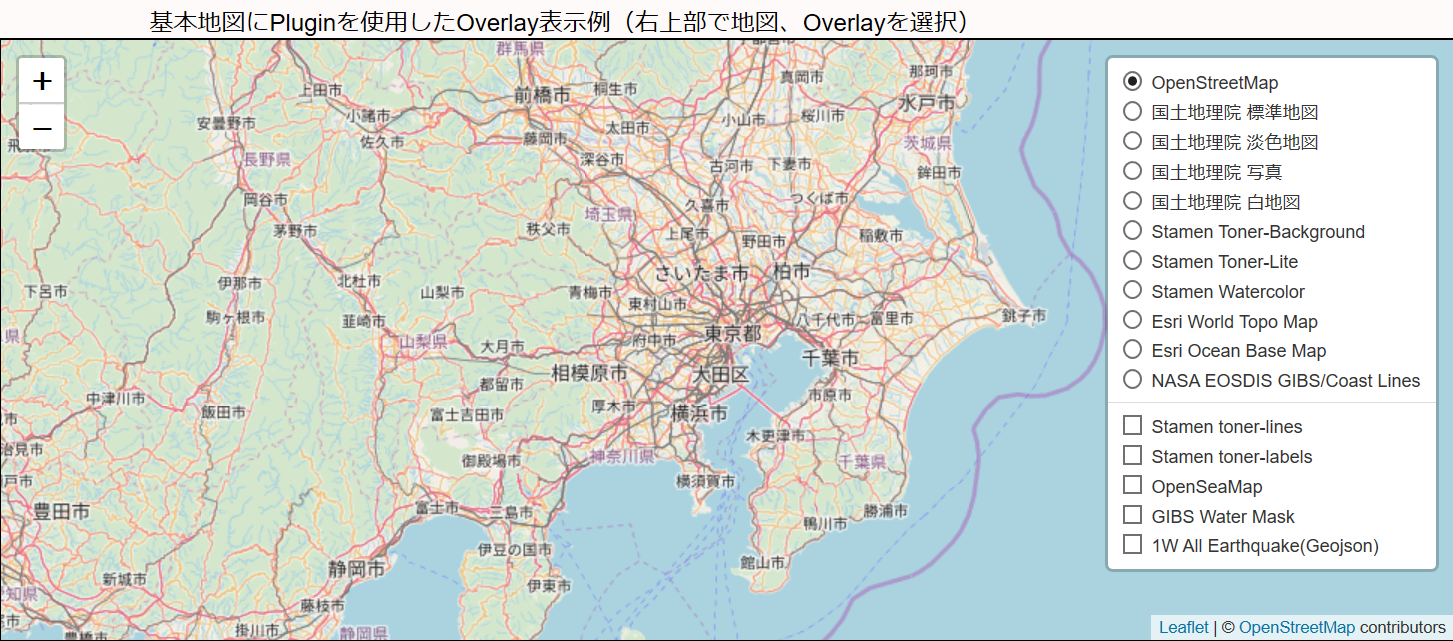
NASAの地形データでは、基本地図としてCost Line(白地図)をOverLayとしてWater Maskが選択できるように追加しました。 ソースファイル内容で8・9行目と52~55行目、68行目、93~96行目、125行目が追記箇所です。 他にどのようなデータが利用できるかは、NASA GIBSのデモを参照下さい。
さらに地震情報のOverLayを追加(10行目、97~119行目、126行目)してみました。 地震データは『 USGS 』 からGeojsonフォーマットで受領しており、 Leaflet 用プラグイン『 Leaflet Ajax 』を追加することで表示させています。 なお、USGSから受領できるデータ・フォーマットには、「Geojson」以外にも 「KML」があります。 また、USGSから受領できる地震データは、1日分/1週間分/1ケ月分と各種ありますのが、ここでは1週間分のデータを表示させています。 他の地震データの使用例は、コメント文として記載していますので参考にしてください。
ソースファイル内容
<!DOCTYPE html>
<html>
<head>
<title>Leaflet_Tutrial_202.html 2019/4/26 by T. Fujita</title>
<meta charset = "utf-8" />
<link rel = "stylesheet" href = "https://unpkg.com/leaflet@1.4.0/dist/leaflet.css" />
<script src = "https://unpkg.com/leaflet@1.4.0/dist/leaflet.js"></script>
<script src = "./Plugins\leaflet-GIBS-master\src/GIBSMetadata.js" ></script>
<script src = "./Plugins\leaflet-GIBS-master\src/GIBSLayer.js" ></script>
<script src = "./Plugins/leaflet-ajax-master/dist/leaflet.ajax.js" ></script>
<script>
function init() {
var Basic_Map = new Array();
Basic_Map[ 0 ] = L.tileLayer('https://{s}.tile.openstreetmap.org/{z}/{x}/{y}.png', {
attribution: '© <a href="https://www.openstreetmap.org/copyright">OpenStreetMap</a> contributors',
continuousWorld: false
});
Basic_Map[ 1 ] = L.tileLayer('https://cyberjapandata.gsi.go.jp/xyz/std/{z}/{x}/{y}.png', {
attribution: "<a href='https://maps.gsi.go.jp/development/ichiran.html' target='_blank'>地理院タイル</a>"
});
Basic_Map[ 2 ] = L.tileLayer('https://cyberjapandata.gsi.go.jp/xyz/pale/{z}/{x}/{y}.png', {
attribution: "<a href='https://maps.gsi.go.jp/development/ichiran.html' target='_blank'>地理院タイル</a>"
});
Basic_Map[ 3 ] = L.tileLayer('https://cyberjapandata.gsi.go.jp/xyz/seamlessphoto/{z}/{x}/{y}.jpg', {
attribution: "<a href='https://maps.gsi.go.jp/development/ichiran.html' target='_blank'>地理院タイル</a>"
});
Basic_Map[ 4 ] = L.tileLayer('https://cyberjapandata.gsi.go.jp/xyz/blank/{z}/{x}/{y}.png', {
attribution: "<a href='https://maps.gsi.go.jp/development/ichiran.html' target='_blank'>地理院タイル</a>"
});
Basic_Map[ 5 ] = L.tileLayer('http://{s}.tile.stamen.com/{variant}/{z}/{x}/{y}.png', {
attribution: 'Map tiles by <a href="http://stamen.com">Stamen Design</a>, ',
variant: 'toner-background'
});
Basic_Map[ 6 ] = L.tileLayer('http://{s}.tile.stamen.com/{variant}/{z}/{x}/{y}.png', {
attribution: 'Map tiles by <a href="http://stamen.com">Stamen Design</a>, ',
variant: 'toner-lite'
});
Basic_Map[ 7 ] = L.tileLayer('http://{s}.tile.stamen.com/{variant}/{z}/{x}/{y}.png', {
minZoom: 1,
maxZoom: 16,
attribution: 'Map tiles by <a href="http://stamen.com">Stamen Design</a>, ',
variant: 'watercolor'
});
Basic_Map[ 8 ] = L.tileLayer('http://server.arcgisonline.com/ArcGIS/rest/services/World_Topo_Map/MapServer/tile/{z}/{y}/{x}', {
attribution: 'Tiles © <a href="http://www.esrij.com/"> Esri Japan </a>'
});
Basic_Map[ 9 ] = L.tileLayer('http://server.arcgisonline.com/ArcGIS/rest/services/Ocean_Basemap/MapServer/tile/{z}/{y}/{x}', {
maxZoom: 13,
attribution: 'Tiles by <a href="http://www.esrij.com/"> Esri Japan </a>'
});
Basic_Map[ 10 ] = new L.GIBSLayer('Coastlines', {
date: new Date('2015/04/01'),
transparent: true
});
var baseMap = {
"OpenStreetMap": Basic_Map[ 0 ],
"国土地理院 標準地図": Basic_Map[ 1 ],
"国土地理院 淡色地図": Basic_Map[ 2 ],
"国土地理院 写真": Basic_Map[ 3 ],
"国土地理院 白地図": Basic_Map[ 4 ],
"Stamen Toner-Background": Basic_Map[ 5 ],
"Stamen Toner-Lite": Basic_Map[ 6 ],
"Stamen Watercolor": Basic_Map[ 7 ],
"Esri World Topo Map": Basic_Map[ 8 ],
"Esri Ocean Base Map": Basic_Map[ 9 ],
"NASA EOSDIS GIBS/Coast Lines": Basic_Map[ 10 ],
};
var Over_Layer = new Array();
Over_Layer[ 0 ] = L.tileLayer('http://{s}.tile.stamen.com/{variant}/{z}/{x}/{y}.png', {
attribution: 'Map tiles by <a href="http://stamen.com">Stamen Design</a>, ' +
'<a href="http://creativecommons.org/licenses/by/3.0">CC BY 3.0</a> — ' +
'Map data {attribution.OpenStreetMap}',
variant: 'toner-hybrid'
});
Over_Layer[ 1 ] = L.tileLayer('http://{s}.tile.stamen.com/{variant}/{z}/{x}/{y}.png', {
attribution: 'Map tiles by <a href="http://stamen.com">Stamen Design</a>, ' +
'<a href="http://creativecommons.org/licenses/by/3.0">CC BY 3.0</a> — ' +
'Map data {attribution.OpenStreetMap}',
variant: 'toner-lines'
});
Over_Layer[ 2 ] = L.tileLayer('http://{s}.tile.stamen.com/{variant}/{z}/{x}/{y}.png', {
attribution: 'Map tiles by <a href="http://stamen.com">Stamen Design</a>, ' +
'<a href="http://creativecommons.org/licenses/by/3.0">CC BY 3.0</a> — ' +
'Map data {attribution.OpenStreetMap}',
variant: 'toner-labels'
});
Over_Layer[ 3 ] = L.tileLayer('http://tiles.openseamap.org/seamark/{z}/{x}/{y}.png', {
attribution: "<a href='http://www.openseamap.org' target='_blank'>OpenSeaMap</a> contributors"
});
Over_Layer[ 4 ] = new L.GIBSLayer('MODIS_Water_Mask', {
date: new Date('2018/11/15'),
transparent: true
});
Over_Layer[ 5 ] = new L.GeoJSON.AJAX(
// "https://earthquake.usgs.gov/earthquakes/feed/v1.0/summary/all_day.geojson",
// "https://earthquake.usgs.gov/earthquakes/feed/v1.0/summary/4.5_week.geojson",
// "https://earthquake.usgs.gov/earthquakes/feed/v1.0/summary/2.5_week.geojson",
// "https://earthquake.usgs.gov/earthquakes/feed/v1.0/summary/1.0_week.geojson",
"https://earthquake.usgs.gov/earthquakes/feed/v1.0/summary/all_week.geojson",
// "https://earthquake.usgs.gov/earthquakes/feed/v1.0/summary/4.5_month.geojson",
// "https://earthquake.usgs.gov/earthquakes/feed/v1.0/summary/2.5_month.geojson",
// "https://earthquake.usgs.gov/earthquakes/feed/v1.0/summary/1.0_month.geojson",
// "https://earthquake.usgs.gov/earthquakes/feed/v1.0/summary/all_month.geojson",
{pointToLayer: function (feature, latlng) {
return L.circleMarker(latlng, {
radius: feature.properties.mag * feature.properties.mag / 3,
fillcolor: "#FF7800",
color: "#FF7800",
weight: 1,
opacity: 0.5,
fillOpacity: 0.5
}); },
onEachFeature: function (feature, layer) {
layer.bindPopup(new Date(feature.properties.time).toUTCString() + " / " + feature.properties.title);
}
});
var overLay = {
"Stamen toner-lines": Over_Layer[ 1 ],
"Stamen toner-labels": Over_Layer[ 2 ],
"OpenSeaMap": Over_Layer[ 3 ],
"GIBS Water Mask": Over_Layer[ 4 ],
"1W All Earthquake(Geojson)": Over_Layer[ 5 ]
};
var map_202 = L.map('map_202').setView([35.65809922, 139.74135747], 8);
map_202.addLayer( Basic_Map[ 0 ] );
L.control.layers(baseMap, overLay).addTo(map_202);
}
</script>
</head>
<body onload="init()">
<div id="map_202" style="width: 100%; height: 400px; background-color:#ffffff; border: solid 1px"></div>
</body>
</html>
##2-3、その他のOverlay表示
上記の他にもOpen Weather Map等 Overlay可能なデータを配信しているサイトがあります。 Open Weather Mapを使用するためには、当該ホームページでAPI keyを入手する必要がありますので、ここで使用方法の紹介はしませんが、 次のURL等が参考になると思います。
・GitHub - buche/leaflet-openweathermap
・あらふぉ ぁ らいふ 2018年12月29日
###Leafletで色々な地図を表示する記事内容
1、Leafletで色々な地図を表示する
2、Overlay表示
3、色々な表示
4、マーカーの表示
5、色々な図形の表示
6、おまけ
追加-1、デバイスの位置を地図上に表示する
追加ー2、写真の撮影地を地図上に表示する
ここに記載したHTML/JavaScriptの動作を確認したい方は、「https://github.com/To-Fujita/Leaflet.JS_Tutorial」 あるいは 「http://hal322.html.xdomain.jp/」を参照ください。