1.Leafletで色々な地図を表示する
地図を表示するために使われているオープンソース・ソフトウェア・ライブラリのひとつである『Leaflet.js』を使用してオープンストリートマップや他の地図を表示する方法を記載します。 使用する地図によっては、使用条件等がありますので、それぞれの利用規約を参照するようにして下さい。 なお、以下のプログラムは Windows 10 において次のブラウザで動作を確認しました。
・ Internet Explorer 11 / Ver. 11.379.17763.0
・ Microsoft Edge / Ver. 11.0.17763.379
・ Firefox / Ver. 65.0.2 (64ビット)
・ Google Chrome / Ver. 73.0.3683.86 (64ビット)
・ Safari / Ver. 5.1.7 (7534.57.2) :一部制限あり
以下のHTML/JavaScriptの動作を確認したい方は、6「https://github.com/To-Fujita/Leaflet.JS_Tutorial」あるいは「http://hal322.html.xdomain.jp/」を参照ください。
また、本記事により作成した「日本の各種名所100選(クリックすると表示されます)」を楽しんでみて下さい。
(注)2025年7月xdomainサーバーの提供停止に伴い、本記事のサンプル(リンク)は使用できなくなりました。
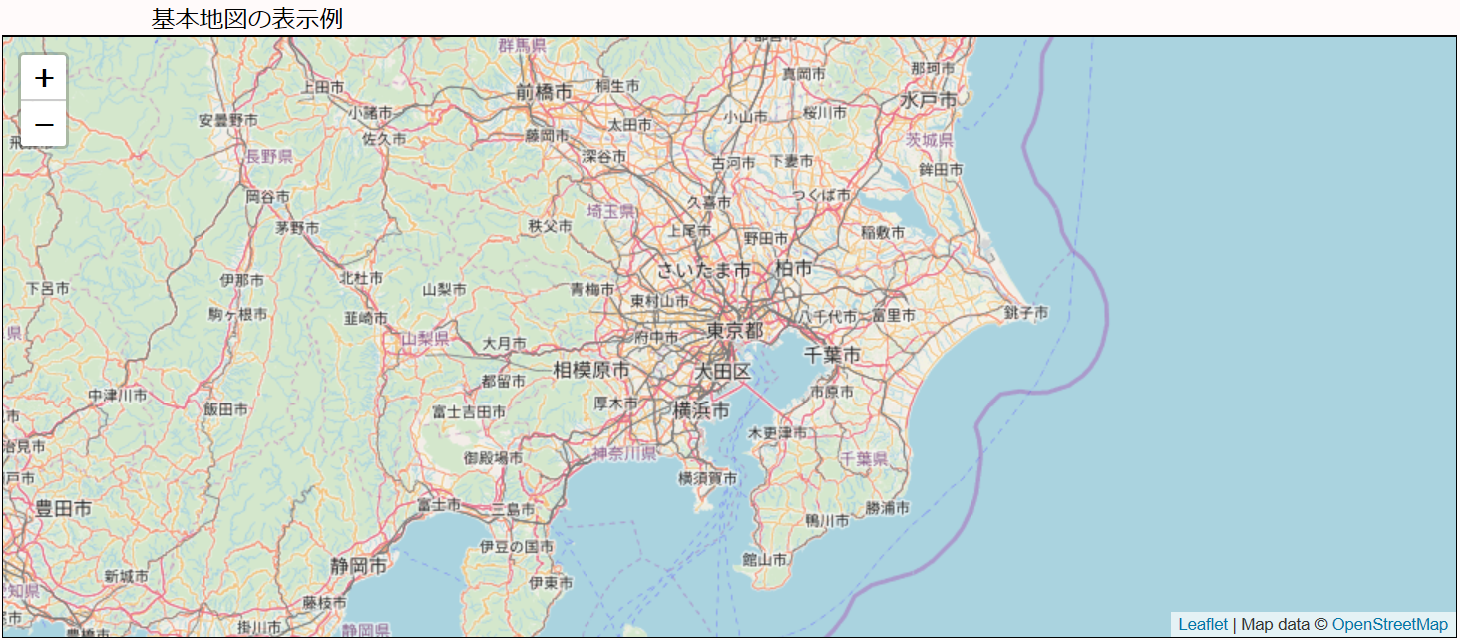
##1-1、基本地図の表示
Leaflet を使用して地図を表示する場合には、HTMLとJAVA Scriptによる記述が必要です。 以下に 表示例と基本地図を表示するソースファイル内容を示します。 実際の表示を確認したい方は、こちらをクリックしてください。
次にソースファイルの内容を示します。
<!DOCTYPE html>
<html>
<head>
<title>Leaflet_Tutrial_101.html 2019/4/26 by T. Fujita</title>
<meta charset="utf-8" />
<link rel = "stylesheet" href = "https://unpkg.com/leaflet@1.4.0/dist/leaflet.css" />
<script src = "https://unpkg.com/leaflet@1.4.0/dist/leaflet.js"></script>
<script>
function init() {
var map_101 = L.map('map_101').setView([35.65809922, 139.74135747], 8);
mapLink = '<a href="https://openstreetmap.org">OpenStreetMap</a>';
L.tileLayer(
'https://{s}.tile.openstreetmap.org/{z}/{x}/{y}.png', {
attribution: 'Map data © ' + mapLink,
maxZoom: 18
}).addTo(map_101);
}
</script>
</head>
<body onload="init()">
<div id="map_101" style="width: 100%; height: 400px; border: solid 1px"></div>
</body>
</html>
HTML部分の説明
4~5行目でタイトルの記述と使用する文字コード(utf-8)の指定し、 6行目でLeaflet の標準スタイルシートを読み込んでいます。 なお、帰属表示については標準スタイルシート内で指定されており、表示例の右下にある Attribution をクリックすることで関連するウエブ・サイトが表示されます。
21行目で最初に実行する関数『 init() 』の指定と地図表示のID、表示サイズ(横100%×縦400ピクセル)を指定しています。
JAVA Script部分の説明
7行目で Leaflet 本体『leaflet@1.4.0』を当該ウェブ・サイトから読み込みます。 9行目からは、上記HTMLで指定した最初に実行する関数『 init() 』が記述されています。 『 init() 』では、オープンストリートマップ『 openstreetmap.org 』から地図画像(png形式)を読み込み表示させます。 なお、地図の中心点の座標は『setView』で緯度(北緯が+、南緯が- )、経度(東経が+、西経が- )の順に指定しています。
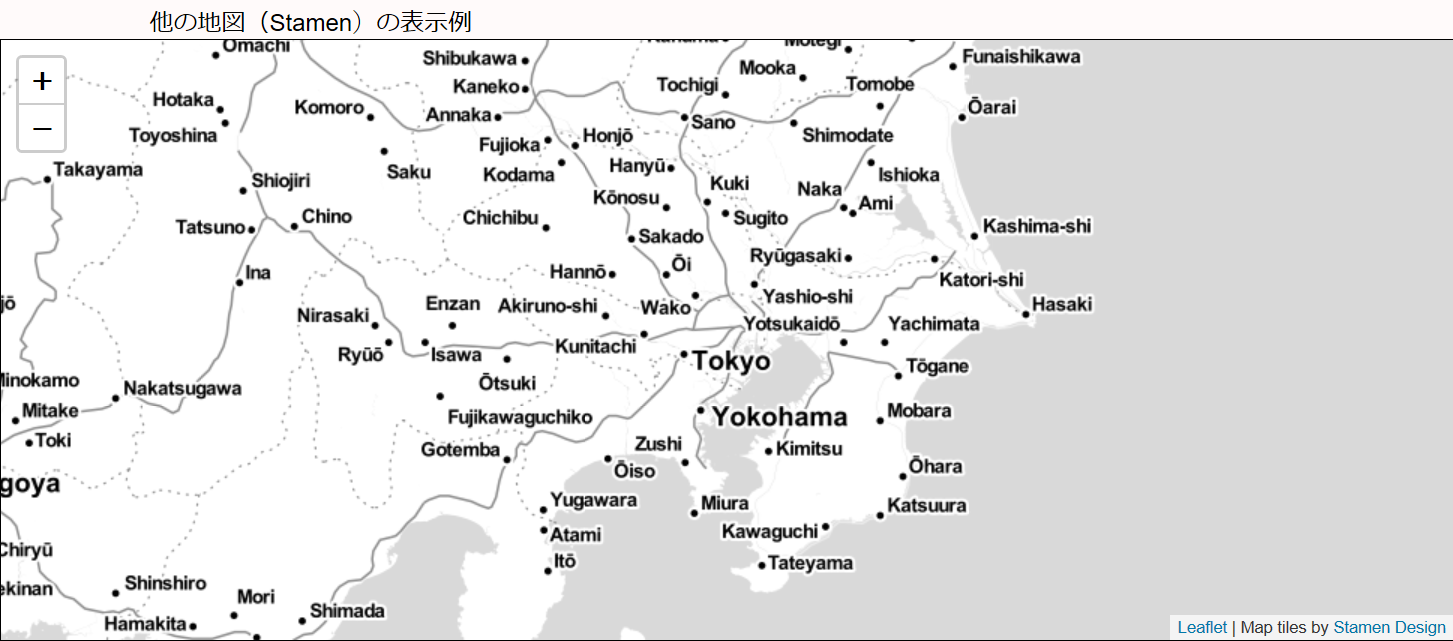
1-2、他の地図の表示
次に別の地図を表示させてみましょう。 地図の表示例とソースファイルの内容を示します。 HTMLの部分は基本地図の例とほぼ同一で、JAVA Scriptは11行目から13行目の箇所が異なっています。 実際の表示を確認したい方は、こちらをクリックしてください。
ソースファイル内容
<!DOCTYPE html>
<html>
<head>
    <title>Leaflet_Tutrial_102.html	2019/4/26	by T. Fujita</title>
    <meta charset="utf-8" />
    <link rel = "stylesheet" href = "https://unpkg.com/leaflet@1.4.0/dist/leaflet.css" />
    <script src = "https://unpkg.com/leaflet@1.4.0/dist/leaflet.js"></script>
    <script>
    function init() {
	var map_102 = L.map('map_102').setView([35.65809922, 139.74135747], 8);
	L.tileLayer('http://{s}.tile.stamen.com/{variant}/{z}/{x}/{y}.png', {
		attribution: 'Map tiles by <a href="http://stamen.com">Stamen Design</a>',
		variant: 'toner-lite'
	}).addTo(map_102);
    }
    </script>
</head>
<body onload="init()">
    <div id="map_102" style="width: 100%; height: 400px; border: solid 1px"></div>
</body>
</html>
11行目で『 Stamen 』の地図を読み込み12行目で Attribution を13行目で地図の種類を指定しています。 地図の種類については、『Stamenのホームページ』を参照して下さい。
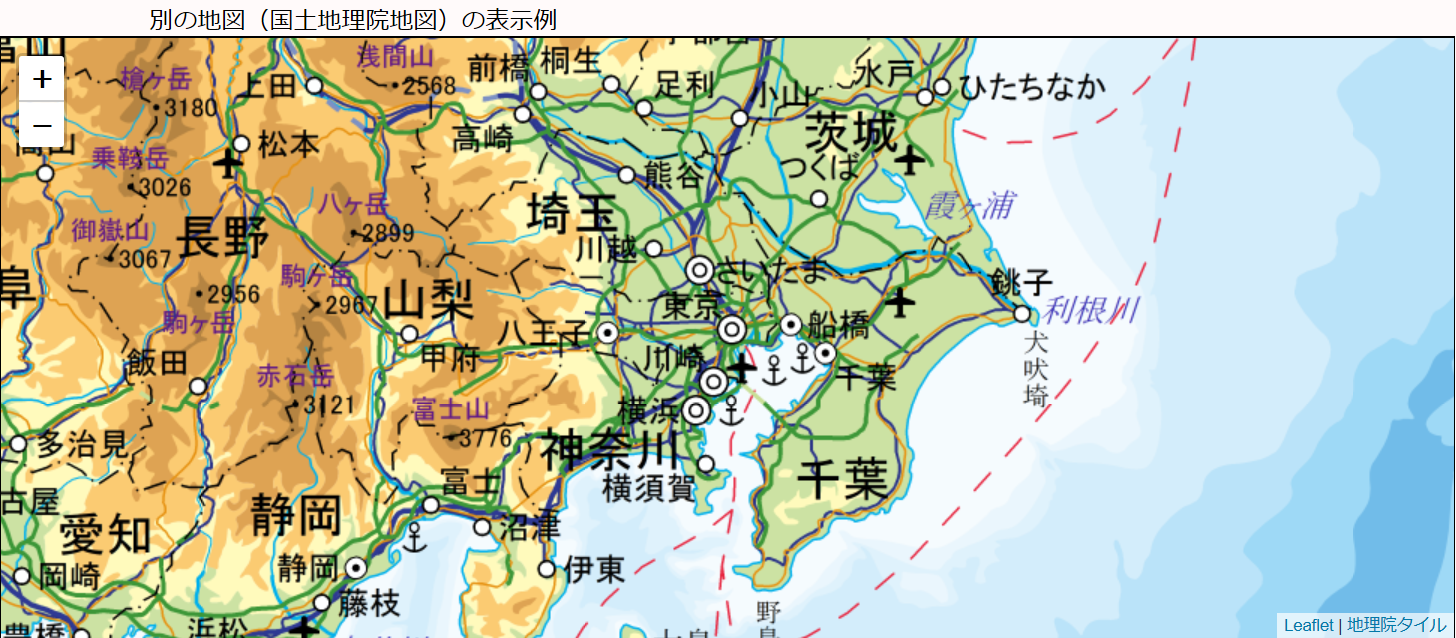
もうひとつ別の地図を表示させてみましょう。 同様に地図の表示例とソースファイルの内容(異なる箇所は11行目から12行目です)を示します。 実際の表示を確認したい方は、こちらをクリックしてください。
ソースファイル内容
<!DOCTYPE html>
<html>
<head>
    <title>Leaflet_Tutrial_103.html	2019/4/26	by T. Fujita</title>
    <meta charset = "utf-8" />
    <link rel = "stylesheet" href = "https://unpkg.com/leaflet@1.4.0/dist/leaflet.css" />
    <script src = "https://unpkg.com/leaflet@1.4.0/dist/leaflet.js"></script>
    <script>
    function init() {
        var map_103 = L.map('map_103').setView([35.65809922, 139.74135747], 8);
	L.tileLayer('https://cyberjapandata.gsi.go.jp/xyz/std/{z}/{x}/{y}.png', {
		attribution: "<a href='https://maps.gsi.go.jp/development/ichiran.html' target='_blank'>地理院タイル</a>"
	}).addTo(map_103);
    }
    </script>
</head>
<body onload="init()">
    <div id="map_103" style="width: 100%; height: 400px; border: solid 1px"></div>
    出典は、<A HREF = "https://maps.gsi.go.jp/development/ichiran.html" target="_blank">「国土地理院」</A>です。
</body>
</html>
上記と同様に11行目で『 国土地理院 』の地図を読み込み、地図の種類『std』を指定しています。 また、12行目で Attribution を指定しています。 地図の種類については、『国土地理院地図のホームページ』を参照して下さい。
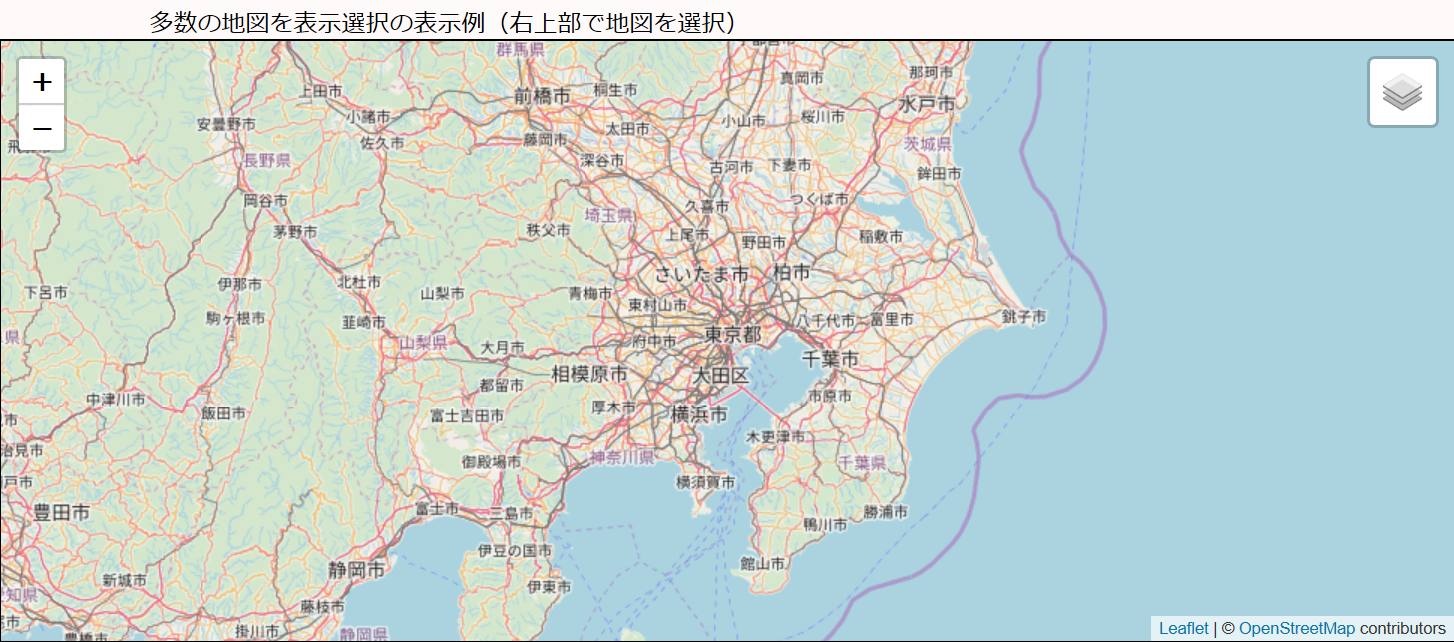
##1-3、多数の地図を表示選択
上記地図を含む多数の地図を選択して表示させてみます。 選択可能な地図の表示例とそのソースファイル(追加修正箇所は10行目から67行目です)を示します。 なお、HTML部分の変更はありません。 実際の表示を確認したい方は、こちらをクリックしてください。
さらに、同じ地図をダイアログ・ボックス内に表示する場合は、こちらをクリックしてください。(ダイアログ・ボックスの表示は、2021年6月現在、「Chrome」、「Edge」、「Opera」等一部のブラウザでのサポートです。)
JAVA Script部の説明
【10行目から50行目】 地図を登録する部分で、次の10種類の地図を登録してみました。
(1) OpenStreetMap
(2) 国土地理院(標準地図)
(3) 国土地理院(淡色地図)
(4) 国土地理院(写真)
(5) 国土地理院(白地図)
(6) Stamen地図(toner)
(7) Stamen地図(toner-lite)
(8) Stamen地図(watercolor)
(9) ESRI World Topo Map
(10)ESRI Ocean Basemap
【55行目から67行目】 登録された地図を選択表示する部分です。
ソースファイル内容
<!DOCTYPE html>
<html>
<head>
<title>Leaflet_Tutrial_104.html 2019/4/26 by T. Fujita</title>
<meta charset = "utf-8" />
<link rel = "stylesheet" href = "https://unpkg.com/leaflet@1.4.0/dist/leaflet.css" />
<script src = "https://unpkg.com/leaflet@1.4.0/dist/leaflet.js"></script>
<script>
function init() {
var Basic_Map = new Array();
Basic_Map[ 0 ] = L.tileLayer('https://{s}.tile.openstreetmap.org/{z}/{x}/{y}.png', {
attribution: '© <a href="https://www.openstreetmap.org/copyright">OpenStreetMap</a> contributors',
continuousWorld: false
});
Basic_Map[ 1 ] = L.tileLayer('https://cyberjapandata.gsi.go.jp/xyz/std/{z}/{x}/{y}.png', {
attribution: "<a href='https://maps.gsi.go.jp/development/ichiran.html' target='_blank'>地理院タイル</a>"
});
Basic_Map[ 2 ] = L.tileLayer('https://cyberjapandata.gsi.go.jp/xyz/pale/{z}/{x}/{y}.png', {
attribution: "<a href='https://maps.gsi.go.jp/development/ichiran.html' target='_blank'>地理院タイル</a>"
});
Basic_Map[ 3 ] = L.tileLayer('https://cyberjapandata.gsi.go.jp/xyz/seamlessphoto/{z}/{x}/{y}.jpg', {
attribution: "<a href='https://maps.gsi.go.jp/development/ichiran.html' target='_blank'>地理院タイル</a>"
});
Basic_Map[ 4 ] = L.tileLayer('https://cyberjapandata.gsi.go.jp/xyz/blank/{z}/{x}/{y}.png', {
attribution: "<a href='https://maps.gsi.go.jp/development/ichiran.html' target='_blank'>地理院タイル</a>"
});
Basic_Map[ 5 ] = L.tileLayer('http://{s}.tile.stamen.com/{variant}/{z}/{x}/{y}.png', {
attribution: 'Map tiles by <a href="http://stamen.com">Stamen Design</a>, ',
variant: 'toner-background'
});
Basic_Map[ 6 ] = L.tileLayer('http://{s}.tile.stamen.com/{variant}/{z}/{x}/{y}.png', {
attribution: 'Map tiles by <a href="http://stamen.com">Stamen Design</a>, ',
variant: 'toner-lite'
});
Basic_Map[ 7 ] = L.tileLayer('http://{s}.tile.stamen.com/{variant}/{z}/{x}/{y}.png', {
minZoom: 1,
maxZoom: 16,
attribution: 'Map tiles by <a href="http://stamen.com">Stamen Design</a>, ',
variant: 'watercolor'
});
Basic_Map[ 8 ] = L.tileLayer('http://server.arcgisonline.com/ArcGIS/rest/services/World_Topo_Map/MapServer/tile/{z}/{y}/{x}', {
attribution: 'Tiles © <a href="http://www.esrij.com/"> Esri Japan </a>'
});
Basic_Map[ 9 ] = L.tileLayer('http://server.arcgisonline.com/ArcGIS/rest/services/Ocean_Basemap/MapServer/tile/{z}/{y}/{x}', {
maxZoom: 13,
attribution: 'Tiles by <a href="http://www.esrij.com/"> Esri Japan </a>'
});
var map_104 = L.map('map_104').setView([35.65809922, 139.74135747], 8);
map_104.addLayer( Basic_Map[ 0 ] );
var baseMap = {
"OpenStreetMap": Basic_Map[ 0 ],
"国土地理院 標準地図": Basic_Map[ 1 ],
"国土地理院 淡色地図": Basic_Map[ 2 ],
"国土地理院 写真": Basic_Map[ 3 ],
"国土地理院 白地図": Basic_Map[ 4 ],
"Stamen Toner-Background": Basic_Map[ 5 ],
"Stamen Toner-Lite": Basic_Map[ 6 ],
"Stamen Watercolor": Basic_Map[ 7 ],
"Esri World Topo Map": Basic_Map[ 8 ],
"Esri Ocean Base Map": Basic_Map[ 9 ],
};
L.control.layers(baseMap).addTo(map_104);
}
</script>
</head>
<body onload="init()">
<div id="map_104" style="width: 100%; height: 400px; border: solid 1px"></div>
</body>
</html>
この他のLeafletで使用できる地図サンプルについては、次のURLを参照下さい。
・ Leaflet 地図サンプル
・ 国土地理院 地理院タイル一覧
###Leafletで色々な地図を表示する記事内容
1、Leafletで色々な地図を表示する
2、Overlay表示
3、色々な表示
4、マーカーの表示
5、色々な図形の表示
6、おまけ
追加-1、デバイスの位置を地図上に表示する
追加ー2、写真の撮影地を地図上に表示する
ここに記載したHTML/JavaScriptの動作を確認したい方は、「https://github.com/To-Fujita/Leaflet.JS_Tutorial」 あるいは「http://hal322.html.xdomain.jp/」を参照ください。