bolte
@bolte (BOLTE)

Are you sure you want to delete the question?

If your question is resolved, you may close it.

Leaving a resolved question undeleted may help others!

We hope you find it useful!

Pythonで多次元のリストから2次元ヒストグラムを作りたい

Pythonで、多次元のリストからある2つの次元を指定(他の次元を固定)して、2次元ヒストグラム(離散的なヒートマップ)を作りたいです。

例えば次のような3次元のリストがあるとします。

test = [
   [
       [10, 11, 12, 13, 14],
       [11, 12, 13, 14, 15],
       [12, 13, 14, 15, 16],
       [13, 14, 15, 16, 17]
   ],
   [
       [17, 16, 15, 14, 13],
       [16, 15, 14, 13, 12],
       [15, 14, 13, 12, 11],
       [14, 13, 12, 11, 10]
   ],
   [
       [10, 11, 12, 13, 14],
       [10, 11, 12, 13, 14],
       [10, 11, 12, 13, 14],
       [10, 11, 12, 13, 14]
   ]
]

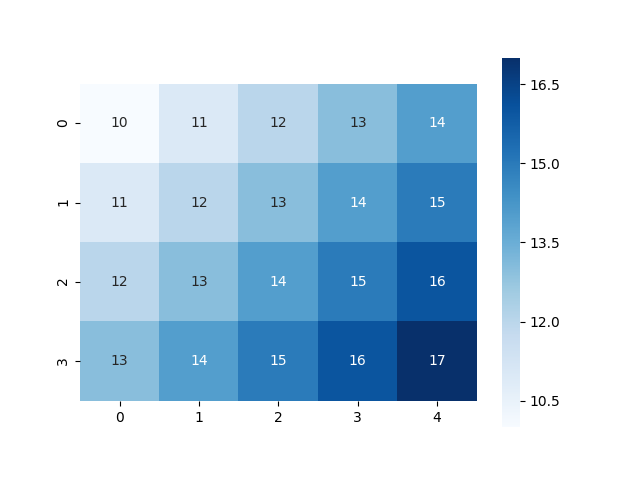
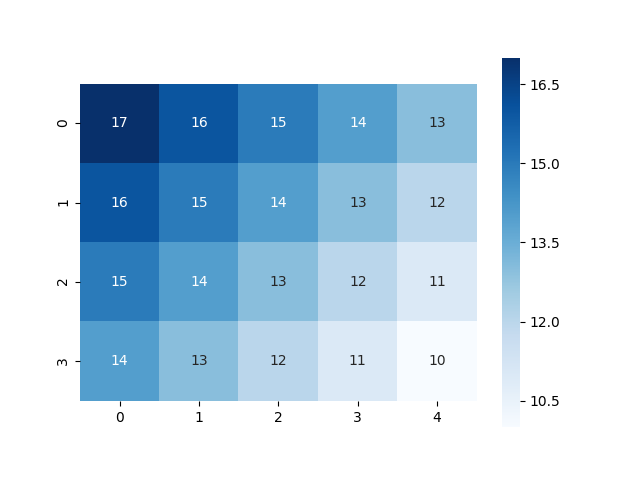
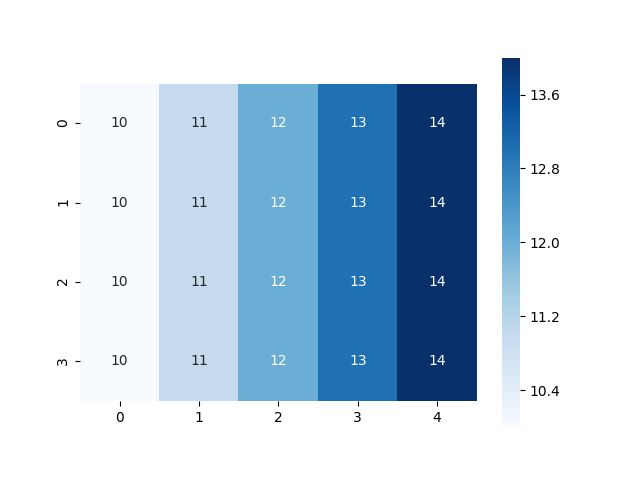
test[0][:][:], test[1][:][:], test[2][:][:]をヒストグラムとして可視化すると順に次のようになります。

test_0.png
test_1.png
test_2.png

これらを出力したPythonのコードは以下の通りです。

test.py
import seaborn as sns
import matplotlib.pyplot as plt
test = [
   [
       [10, 11, 12, 13, 14],
       [11, 12, 13, 14, 15],
       [12, 13, 14, 15, 16],
       [13, 14, 15, 16, 17]
   ],
   [
       [17, 16, 15, 14, 13],
       [16, 15, 14, 13, 12],
       [15, 14, 13, 12, 11],
       [14, 13, 12, 11, 10]
   ],
   [
       [10, 11, 12, 13, 14],
       [10, 11, 12, 13, 14],
       [10, 11, 12, 13, 14],
       [10, 11, 12, 13, 14]
   ]
]
plt.figure()
sns.heatmap(test[0][:][:], cmap='Blues', square=True, annot=True)
plt.savefig('./test_0.png')
plt.show()
plt.close('all')

質問

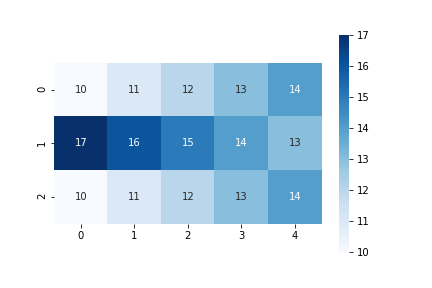
ここで3つの行列のうち、例えばそれぞれの一番上の行を取り出したもののヒストグラムを作りたいです。つまりイメージとしては

[
 [10, 11, 12, 13, 14],
 [17, 16, 15, 14, 13],
 [10, 11, 12, 13, 14]
]

をそのまま可視化したようなヒストグラムを作りたいです。これをやろうとソースコードのtest[0][:][:]test[:][0][:]に変えてみたのですが、ヒストグラムはtest[0][:][:]と同じものでした。同様にtest[:][1][:]test[1][:][:]と同じヒストグラム、test[:][2][:]test[2][:][:]と同じヒストグラムとなってしまいます。
どうしたらtest[:][0][:]とかtest[:][:][0]のヒストグラムを作れるでしょうか? よろしくお願いします。

0

1Answer

numpyを使ってよければ投稿者様のやりたいことが素直にできますよ。

import seaborn as sns
import matplotlib.pyplot as plt
import numpy as np

test = [
   [
       [10, 11, 12, 13, 14],
       [11, 12, 13, 14, 15],
       [12, 13, 14, 15, 16],
       [13, 14, 15, 16, 17]
   ],
   [
       [17, 16, 15, 14, 13],
       [16, 15, 14, 13, 12],
       [15, 14, 13, 12, 11],
       [14, 13, 12, 11, 10]
   ],
   [
       [10, 11, 12, 13, 14],
       [10, 11, 12, 13, 14],
       [10, 11, 12, 13, 14],
       [10, 11, 12, 13, 14]
   ]
]

test_np = numpy.array(test)
head_of_mat = test_np[:, 0, :]

plt.figure()
sns.heatmap(head_of_mat, cmap='Blues', square=True, annot=True)
plt.savefig('./test_0.png')
plt.show()
plt.close('all')

test_0.png

1Like

Comments

  1. Pythonの配列では[]を左から順番に適用するだけなので、Numpyのような多次元配列のスライシングが出来ません。

    test[:][0][:] = test[0][:] = (test[0])[:] = test[0]
  2. @bolte

    Questioner

    ``` python
    test_np = numpy.array(test)
    head_of_mat = test_np[:, 0, :]
    ```

    こうゆうことがやりたかったです! ありがとうございます

Your answer might help someone💌