初めに
今回はPythonで共起ネットワーク図を作成するコードを実装しました.
分析対象として,News APIで取得したデータを用いています.
実装
以下の手順で実装しました.
- NewsAPIでデータの取得
- 取得したデータに対して形態素解析
- Jaccard係数の算出
- 共起ネットワーク図の作成
NewsAPIでデータの取得
News APIのサイトにアクセスし,APIを取得します.
今回はテスラに関する2023年11月8日から2023年12月8日のニュースを取得しました.
リクエストパラメータで取得したい記事の言語を指定できますが,日本は含まれていません.そのため,日本語のニュースを取得したい場合は,キーワードを日本語にしてください.
get_news.py
import requests
import pandas as pd

url = "https://newsapi.org/v2/everything"
params = {
    'q': 'テスラ', #ここにキーワードを入力
    'from': '2023-11-08',
    'to': '2023-12-08',
    'sortBy': 'popularity',
    'apiKey': # ここに実際のAPIキーを入力してください
}

response = requests.get(url, params=params)

if response.status_code == 200:
    data = response.json()
    df = pd.DataFrame(data['articles'])
    df.to_csv('news.csv')
else:
    print(f"Error: {response.status_code}")
    print(response.text)
形態素解析
今回はMecabを使用して形態素解析を行いました.
辞書はmecab-ipadic-neologdを使用しています.
morphological.py
import MeCab

path = "-d /opt/homebrew/lib/mecab/dic/mecab-ipadic-neologd"
mecab = MeCab.Tagger(path)

def morphological_analysis(text):
    nouns = []
    node = mecab.parse(text)
    lines = node.split('\n')
    for line in lines:
        if line == 'EOS':
            break
        parts = line.split('\t')
        if len(parts) > 1:
            part = parts[1].split(',')
            if part[0] in ["名詞", "動詞", "形容詞"]:
                nouns.append(part[6])
    return nouns
jaccard係数の算出
Jaccard係数は、2つの集合AとBの共通の要素の割合を示します。数学的には、次のように表されます。
J(A, B) = \frac{|A \cap B|}{|A \cup B|} = \frac{|A \cap B|}{|A|+|B|-|A \cap B|}
今回は分析対象の単語数が膨大になったため,文章中に出現した回数が3回以上の単語の組み合わせのみJaccard係数を算出し,そこからjaccard係数が上位60件の組み合わせに絞ってあります.
generate_cooccurrence.py
from itertools import combinations

def generate_cooccurrence_dataframe(texts):
    # 形態素解析を行い,名詞リストを作成
    nouns_lists = [morphological_analysis(text) for text in texts]
    all_words = [word for sublist in nouns_lists for word in sublist]

    # 重複した単語を削除した配列を作成
    all_unique_words = list(set(sum(nouns_lists, [])))

    # 単語の組み合わせを取得
    word_combinations = combinations(all_unique_words, 2)

    # 同じ文章中に出現した回数を保存する辞書を作成し、カウント
    word_count_in_same_sentence = {combination: sum(1 for words in nouns_lists if all(w in words for w in combination)) for combination in word_combinations}

    # 出現回数が2回以下の組み合わせを削除
    word_count_in_same_sentence = {combination: count for combination, count in word_count_in_same_sentence.items() if count > 2}

    # jaccard係数の算出
    data = [{'A': combination[0], 'B': combination[1], 'count': count,
             'jaccard': count / (all_words.count(combination[0]) + all_words.count(combination[1]) - count) if (all_words.count(combination[0]) + all_words.count(combination[1]) - count) != 0 else 0.0}
            for combination, count in word_count_in_same_sentence.items()]

    # jaccard係数が上位60件のみを取得
    data = sorted(data, key=lambda x: x['jaccard'], reverse=True)[:60]

    return pd.DataFrame(data)
共起ネットワーク図の作成
NetworkXを使用して,共起ネットワーク図を作成しています.
import networkx as nx
import matplotlib.pyplot as plt

def network(df):
    # グラフの作成
    G = nx.Graph()

    # エッジの追加
    for row in df.itertuples(index=False):
        G.add_edge(row.A, row.B, weight=row.jaccard)

    # ノードの大きさを設定
    node_size = [val * 200 for val in dict(G.degree).values()]

    # エッジの太さをJaccard係数に応じて設定
    edge_widths = [max(0, row.jaccard) * 2 for row in df.itertuples(index=False)]

    # グラフの描画
    plt.figure(figsize=(15, 8))

    # Kamada-Kawaiアルゴリズムを使用してノードの位置を計算
    pos = nx.kamada_kawai_layout(G)

    nx.draw(G, pos, with_labels=True, node_size=node_size, node_color='lightblue',
            font_weight='bold', font_size=10, edge_color='grey', width=edge_widths, alpha=0.5, font_family='IPAexGothic')

    # エッジのラベルを小数点2桁までに制限
    edge_labels = {(u, v): '{:.2f}'.format(w) for u, v, w in G.edges(data='weight')}

    nx.draw_networkx_edge_labels(G, pos, edge_labels=edge_labels, font_color='red', font_family='IPAexGothic', font_size=7)

    plt.title('共起ネットワーク図')
    plt.show()

if __name__ == '__main__':
    texts = pd.read_csv('news.csv')['description'].tolist()
    df = generate_cooccurrence_dataframe(texts)
    network(df)
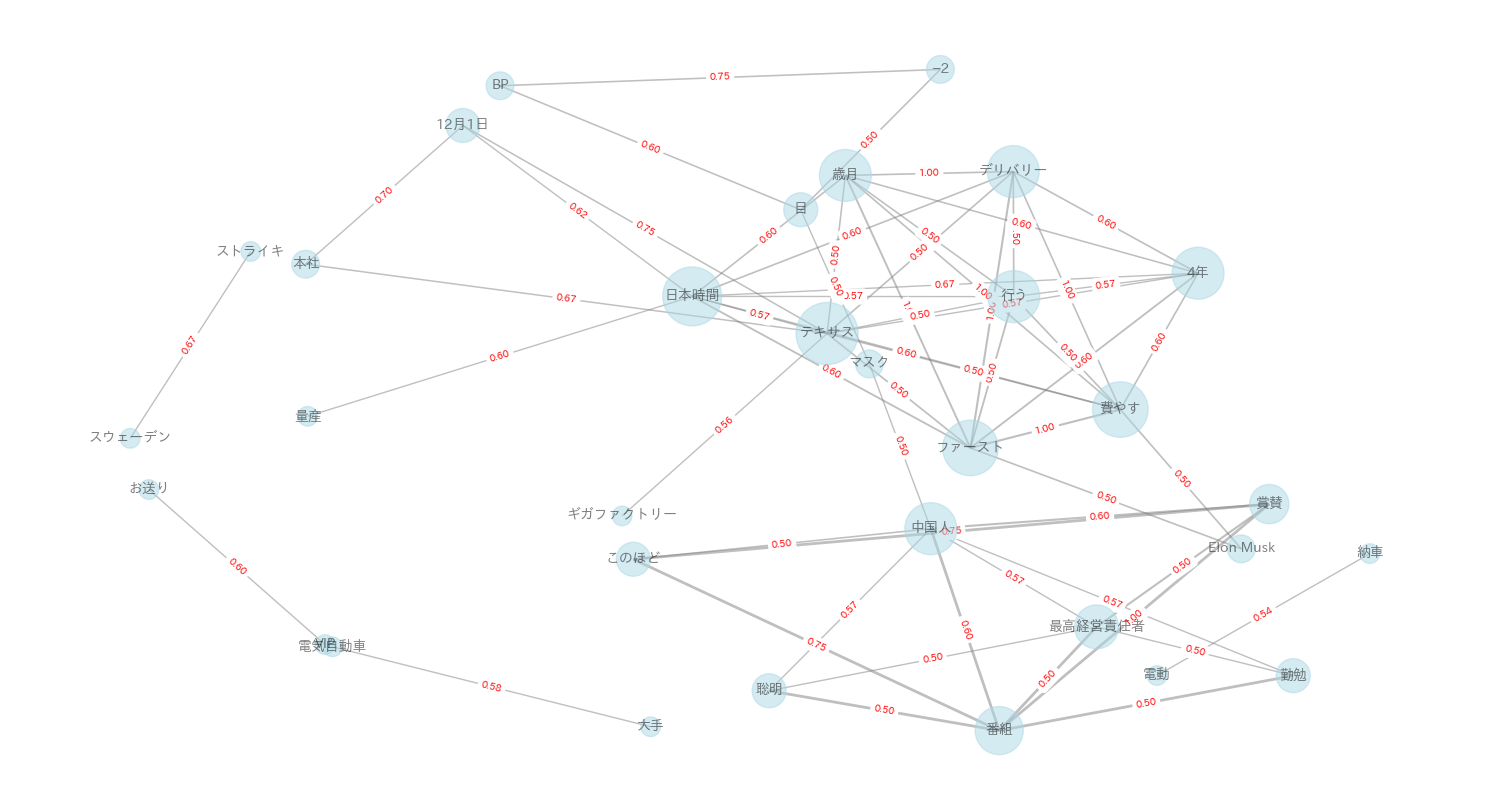
実際に作成した共起ネットワーク図になります.
最後に
今回はPythonで共起ネットワーク図を作成しましたが,レイアウトの自由度がかなり制限される印象を受けたので,次回はCytoscapeを使ってみたいと思います.
近日中に投稿するので,ぜひご覧ください.