はじめに
こちらは以前記入したこちらの続きの内容となります。
簡単にあらすじを紹介させて頂きます。
前回は概要とデータの確認、そして簡単な欠損値の穴埋めと特徴量生成を行いました。
今回はfeaturetoolsというモジュールを用いてさらに特徴量を生成していこうと思います。
開発環境は前頁を参照してください。
・featuretoolsとは
- 特徴量生成自動ツールです。説明変数の相互関係や時系列について、統計量の算出や新たな特徴量生成を行ってくれます。
- 公式サイト
実装
流れはこちらを参考にしました。
1.featuretoolsのインポート
!pip install featuretools
import featuretools as ft
まずはfeaturetoolsをインポートします。多少時間はかかります。
2.EntitySetの作成。
EntitySetの作成を行います。EntitySetに名前を付けることも可能ですが
今回は必要ないのでつけません。
es = ft.EntitySet()
3.そのEntitySetに内容を詰め込みます。
前処理をしたdata frameをEntitySetに格納し、dataframe_nameに名前を付けます。
今回はdatasの["datetime"]というカラムを元に特徴量を作成するので、
indexには"datetime"と記載します。
es = es.add_dataframe (
    dataframe_name="datas",      #dataframeに名前を付ける。
    dataframe=datas,             #参照するデータ変数名を記入。
    index="datetime",            #特徴量生成元のカラム。
)
4.特徴量を生成。
そして初めに生成する特徴量を指定します。
今回はdatetimeを元に下記の特徴量を生成します。
このような特徴量を作成してくれます。
trans_primitives = ["year", "month","day","weekday"]
  # 特徴量の生成
feature_matrix, features_defs = ft.dfs(
                                       entityset=es,
                                       target_dataframe_name="datas",
                                       trans_primitives= trans_primitives, #先ほど作成した変数

                                        )
なんとなくイメージはわかったでしょうか?
こちらがまとめです。
es = ft.EntitySet()
es = es.add_dataframe (
dataframe_name="datas", #dataframeに名前を付ける。
dataframe=datas, #参照するデータ変数名を記入。
index="datetime", #特徴量生成元のカラム。
)
trans_primitives = ["year", "month","day","weekday"]
feature_matrix, features_defs = ft.dfs(
entityset=es,
target_dataframe_name="datas",
trans_primitives= trans_primitives, #先ほど作成した変数
)
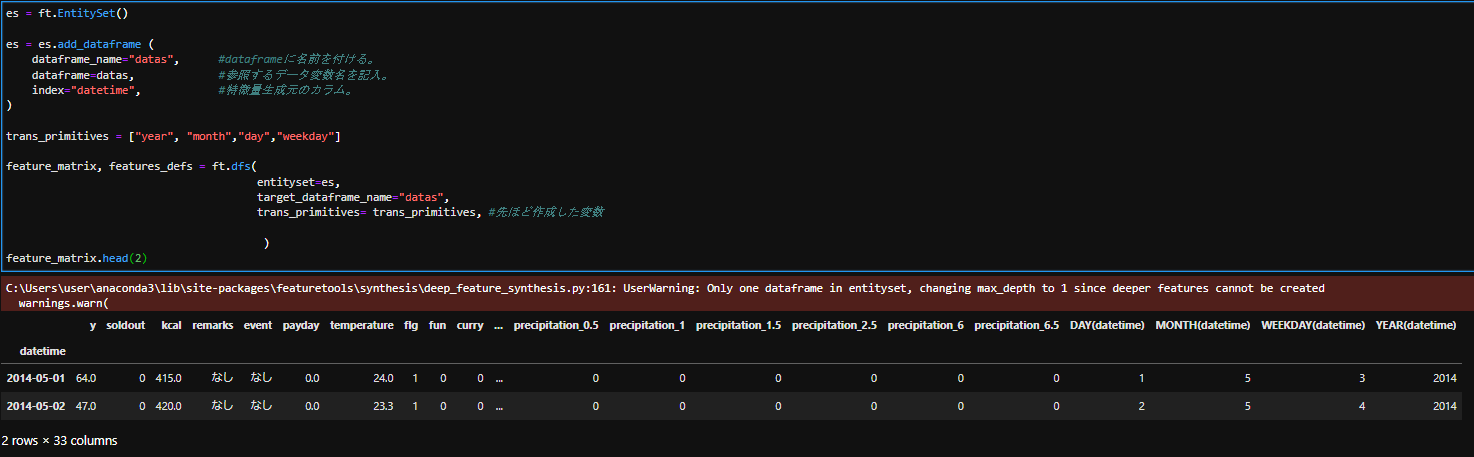
feature_matrix.head(2)
新たにカラムが追加されていることがわかります。
5.特徴量の説明。
作成した特徴量を見てみましょう。先ほど添付した公式マニュアルも併せて確認して頂ければと思います。
- "day" :日にちを返します。
- "weekday" :曜日を返します。月曜日が0で土曜日が6。
- "month" :月を返します。
- "year" :年月を返します。
基本的には名前の通りです。今回は["datetime"]を元として作成されました。
上記以外にも様々なカラムを["datetime"]を元に作成することができます。
今回の目的はfeaturetoolsを使用するという事が目的ですので、深入りはしませんが、
是非他のカラムも同じように作成してみてください。
以上がfeaturetoolsを駆使した新たな特徴量の作成でした。
作成したデータを確認して取り入れる。
データ確認
feature_matrix.info()

#結果
<class 'pandas.core.frame.DataFrame'>
DatetimeIndex: 141 entries, 2014-05-01 to 2014-11-28
Data columns (total 32 columns):
 #   Column             Non-Null Count  Dtype
---  ------             --------------  -----
 0   y                  101 non-null    float64
 1   soldout            141 non-null    int64
 2   kcal               141 non-null    float64
 3   event              141 non-null    category
 4   payday             141 non-null    float64
 5   temperature        141 non-null    float64
 6   flg                141 non-null    int64
 7   fun                141 non-null    int64
 8   curry              141 non-null    int64
 9   week_月             141 non-null    int64
 10  week_木             141 non-null    int64
 11  week_水             141 non-null    int64
 12  week_火             141 non-null    int64
 13  week_金             141 non-null    int64
 14  weather_快晴         141 non-null    int64
 15  weather_晴れ         141 non-null    int64
 16  weather_曇          141 non-null    int64
 17  weather_薄曇         141 non-null    int64
 18  weather_雨          141 non-null    int64
 19  weather_雷電         141 non-null    int64
 20  precipitation_--   141 non-null    int64
 21  precipitation_0    141 non-null    int64
 22  precipitation_0.5  141 non-null    int64
 23  precipitation_1    141 non-null    int64
 24  precipitation_1.5  141 non-null    int64
 25  precipitation_2.5  141 non-null    int64
 26  precipitation_6    141 non-null    int64
 27  precipitation_6.5  141 non-null    int64
 28  DAY(datetime)      141 non-null    category
 29  MONTH(datetime)    141 non-null    category
 30  WEEKDAY(datetime)  141 non-null    category
 31  YEAR(datetime)     141 non-null    category
dtypes: category(5), float64(4), int64(23)
memory usage: 121.8 KB
追加したデータがカテゴリになっていることがわかります。intに変換しましょう。
データ整形
bent = feature_matrix.copy() #データを複製。変数名は弁当なので"bent"にしました。
それではintに変換します。一応申し上げますと、intは整数、floatは少数点と捉えて頂ければ。
つまり追加したカラム属性をint(整数)に変換します。
for col in bent.columns:
  if col in ['DAY(datetime)', 'MONTH(datetime)',"WEEKDAY(datetime)","YEAR(datetime)"]:
    bent[col] = bent[col].astype(int)
bent.info()
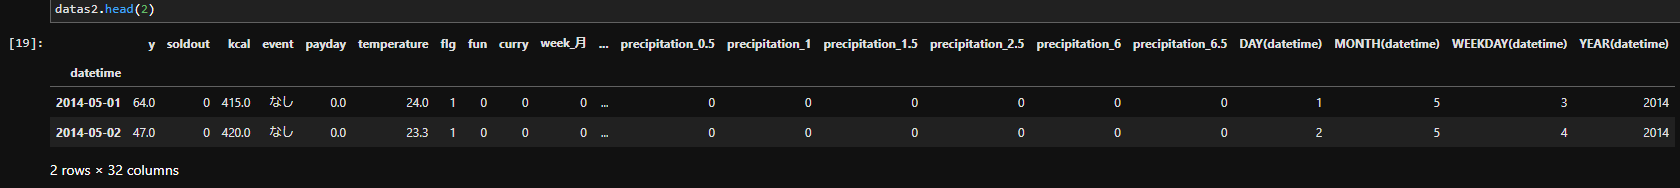
feturetoolsで追加したカラムがintになっている事が確認できます。
#結果
<class 'pandas.core.frame.DataFrame'>
DatetimeIndex: 141 entries, 2014-05-01 to 2014-11-28
Data columns (total 33 columns):
 #   Column             Non-Null Count  Dtype
---  ------             --------------  -----
 0   y                  101 non-null    float64
 1   soldout            141 non-null    int64
 2   kcal               127 non-null    float64
 3   remarks            141 non-null    category
 4   event              141 non-null    category
 5   payday             141 non-null    float64
 6   temperature        141 non-null    float64
 7   flg                141 non-null    int64
 8   fun                141 non-null    int64
 9   curry              141 non-null    int64
 10  week_月             141 non-null    int64
 11  week_木             141 non-null    int64
 12  week_水             141 non-null    int64
 13  week_火             141 non-null    int64
 14  week_金             141 non-null    int64
 15  weather_快晴         141 non-null    int64
 16  weather_晴れ         141 non-null    int64
 17  weather_曇          141 non-null    int64
 18  weather_薄曇         141 non-null    int64
 19  weather_雨          141 non-null    int64
 20  weather_雷電         141 non-null    int64
 21  precipitation_--   141 non-null    int64
 22  precipitation_0    141 non-null    int64
 23  precipitation_0.5  141 non-null    int64
 24  precipitation_1    141 non-null    int64
 25  precipitation_1.5  141 non-null    int64
 26  precipitation_2.5  141 non-null    int64
 27  precipitation_6    141 non-null    int64
 28  precipitation_6.5  141 non-null    int64
 29  DAY(datetime)      141 non-null    int32
 30  MONTH(datetime)    141 non-null    int32
 31  WEEKDAY(datetime)  141 non-null    int32
 32  YEAR(datetime)     141 non-null    int32
dtypes: category(2), float64(4), int32(4), int64(23)
memory usage: 33.7 KB
それでは次回はついに実際に実際に機械学習を行っていきます。
参考文献