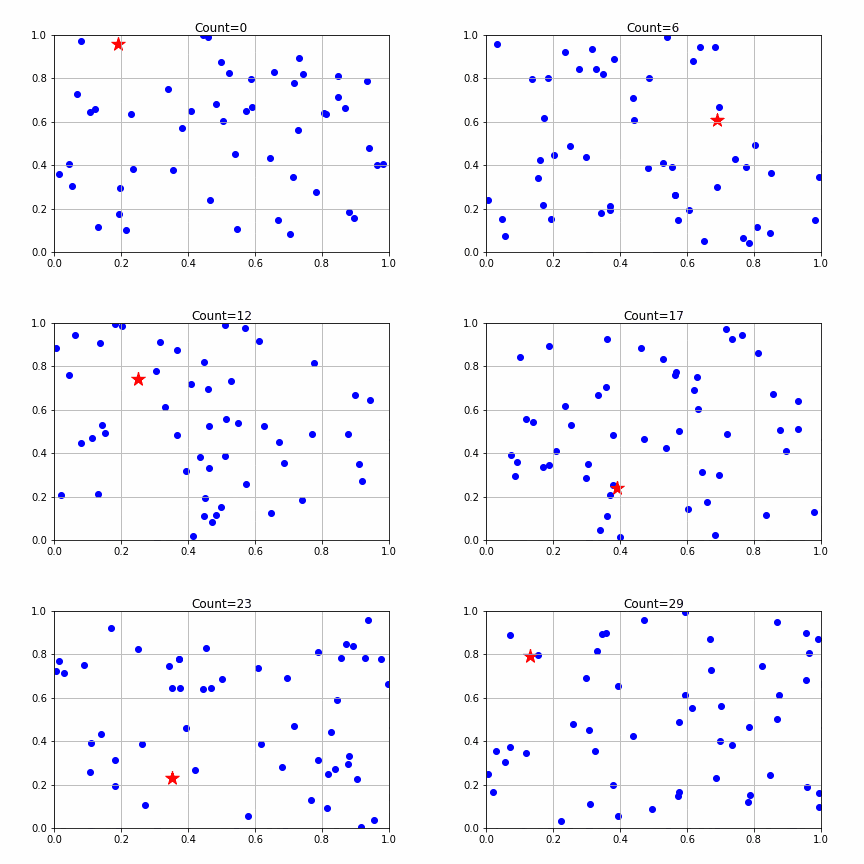
前回の投稿Pythonで実数値遺伝的アルゴリズムの性能を評価してみるの副産物で、matplotlibで散布図のアニメーションを作るときの情報があまりなかったのでまとめてみました。
実装
import numpy as np
from matplotlib import pyplot as plt
import matplotlib.animation as animation

# 軸の最小値、最大値
dRange = [0.0 , 1.0]

if __name__ == "__main__":
    #グラフ 散布図
    fig_scatter = plt.figure()
    plt_scatter = []

    # 実行
    for count  in  range(30):
        #グラフ 散布図
        x_1 = []
        x_2 = []
        for n in range(50):
            x_1.append(np.random.rand())
            x_2.append(np.random.rand())

        x_scatter = plt.scatter(x_1, x_2 , c="blue")

        x_scatter_red  = plt.scatter(np.random.rand(),
                                     np.random.rand(),
                                     c="red",
                                     marker="*",
                                     s=200)
        # タイトルテキスト
        title = plt.text((dRange[0]+dRange[1]) /2 , dRange[1],
                         'Count={:d}'.format(count),
                         ha='center', va='bottom',fontsize='large')

        plt_scatter.append([x_scatter,x_scatter_red,title])


    #散布図
    # アニメーション作成
    plt.xlim(dRange[0],dRange[1])
    plt.ylim(dRange[0],dRange[1])
    plt.grid(True)

    ani = animation.ArtistAnimation(fig_scatter, plt_scatter, interval=500)

    # 保存
    ani.save('sample.gif', writer="imagemagick")

    #表示
    #plt.show()
出力結果
説明
plt.scatter()で散布図のプロットを指定します。複数プロット表示する場合は、x軸とy軸それぞれの配列を渡します。
        for n in range(50):
            x_1.append(np.random.rand())
            x_2.append(np.random.rand())

        x_scatter = plt.scatter(x_1, x_2 , c="blue")
特定のプロットだけ、色・形・大きさを変えたい場合は、別途散布図のプロットを作成します。cで色を、markerで形を、sで大きさを指定できます。
        x_scatter_red  = plt.scatter(np.random.rand(),
                                     np.random.rand(),
                                     c="red",
                                     marker="*",
                                     s=200)
動的なタイトルを付けたい場合は、plt.text()を使います。第1、第2引数で座標を指定しますが、画像の左上からの絶対座標ではなく、プロットの軸上の座標になります。よって、各軸の最小値・最大値動的に変わる場合は、あらかじめ最小値、最大値を決めておいて、後でplt.xlim()とplt.ylim()で指定する必要があります。そうしないと、タイトルの位置がいろんなとこに飛びます。
        title = plt.text((dRange[0]+dRange[1]) /2 , dRange[1],
                         'Count={:d}'.format(count),
                         ha='center', va='bottom',fontsize='large')
plt_scatter.append()で、表示させたい内容を、配列形式で追加します。
plt_scatter.append([x_scatter,x_scatter_red,title])
アニメーションGIFを保存したい場合は、以下のようにします。
表示したい場合は、'ani.save()'の部分をplt.show()に変更すれば、いいはずですが、現状ColaboratoryやSpyderではうまく表示できませんでした。
    ani = animation.ArtistAnimation(fig_scatter, plt_scatter, interval=500)

    # 保存
    ani.save('sample.gif', writer="imagemagick")
