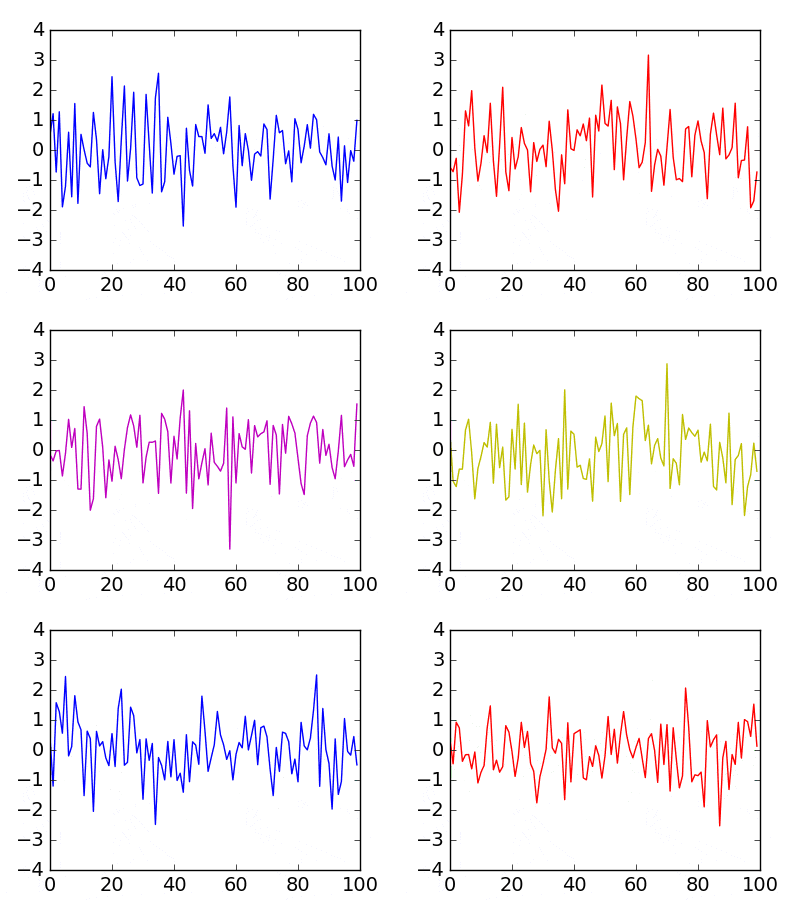
matplotlib とは python のグラフ描写モジュールであり、アニメーションも作れる。つまり深夜にアニメを見ないと死ぬ諸兄は matplotlib を覚えるというのも一案である。
というわけで極めて簡単なサンプルとして、numpy で生成した乱数を描写するだけのコードを書く。
公式ドキュメントはこちら。
http://matplotlib.org/api/animation_api.html
ArtistAnimation
matplotlib のアニメーションは ArtistAnimation と FuncAnimation の2種類がある。
ArtistAnimation は、あらかじめ全てのグラフを配列の形で用意しておき、それを1枚ずつ流すというものである。
import numpy as np
import matplotlib.pyplot as plt
import matplotlib.animation as animation

fig = plt.figure()

ims = []

for i in range(10):
        rand = np.random.randn(100)     # 100個の乱数を生成
        im = plt.plot(rand)             # 乱数をグラフにする
        ims.append(im)                  # グラフを配列 ims に追加

# 10枚のプロットを 100ms ごとに表示
ani = animation.ArtistAnimation(fig, ims, interval=100)
plt.show()
なかなか電波っぽいのが出来た。深夜残業でアニメが見たくなった時はこういうのをじっと眺めていると良いと思う。動画をGIFで保存する際は、末尾の
plt.show()
の部分を
ani.save("output.gif", writer="imagemagick")
に書き換えるとよい。(imagemagick というパッケージが必要)
MP4 とかに出力も出来るらしいが少々面倒なのでやってない。
FuncAnimation
こちらは予め完成したグラフを渡すのではなく、アニメーションの1フレームごとに関数を実行する。
データが巨大すぎる場合や潜在的に無限に続く場合に便利。
import numpy as np
import matplotlib.pyplot as plt
import matplotlib.animation as animation

fig = plt.figure()

def plot(data):
    plt.cla()                      # 現在描写されているグラフを消去
    rand = np.random.randn(100)    # 100個の乱数を生成
    im = plt.plot(rand)            # グラフを生成

ani = animation.FuncAnimation(fig, plot, interval=100)
plt.show()
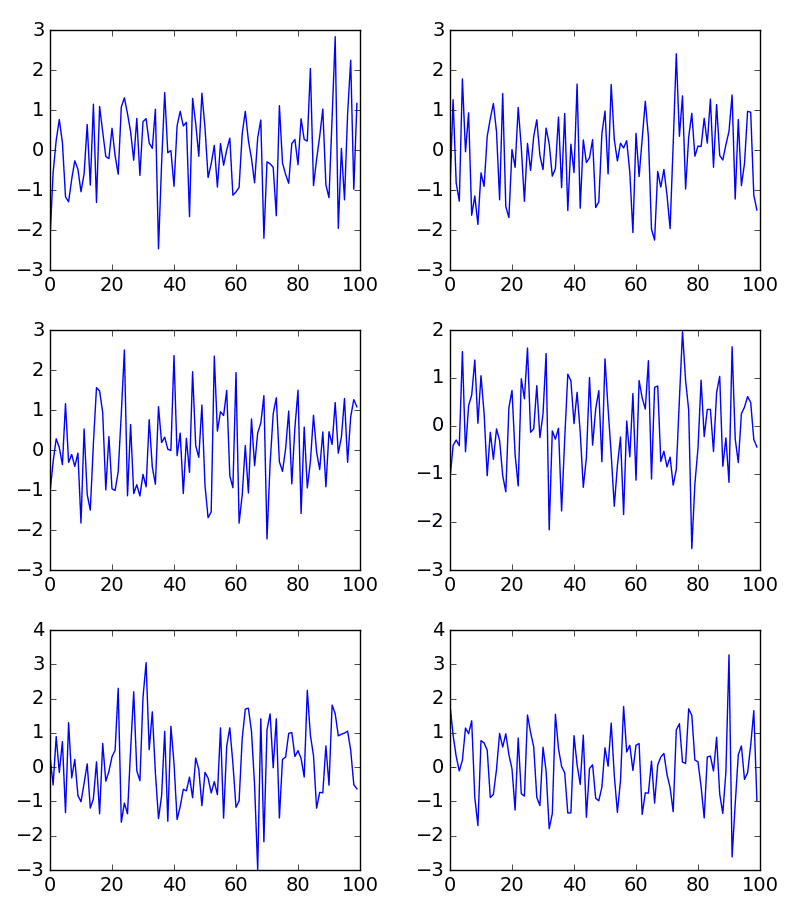
こちらは動的にグラフを作るため、縦軸の範囲が乱数に応じて毎回変わる。
GIFに出力する場合、ArtistAnimation と違って終わりが指定されていないので、
ani = animation.FuncAnimation(fig, plot, interval=100, frames=10)
ani.save("output.gif", writer="imagemagick")
という具合に frames=10 と予めフレーム数を指定してやる。

