C言語でグレースケールの入力画像の濃度ヒストグラムを計算し、gnuplotに出力したい。
解決したいこと
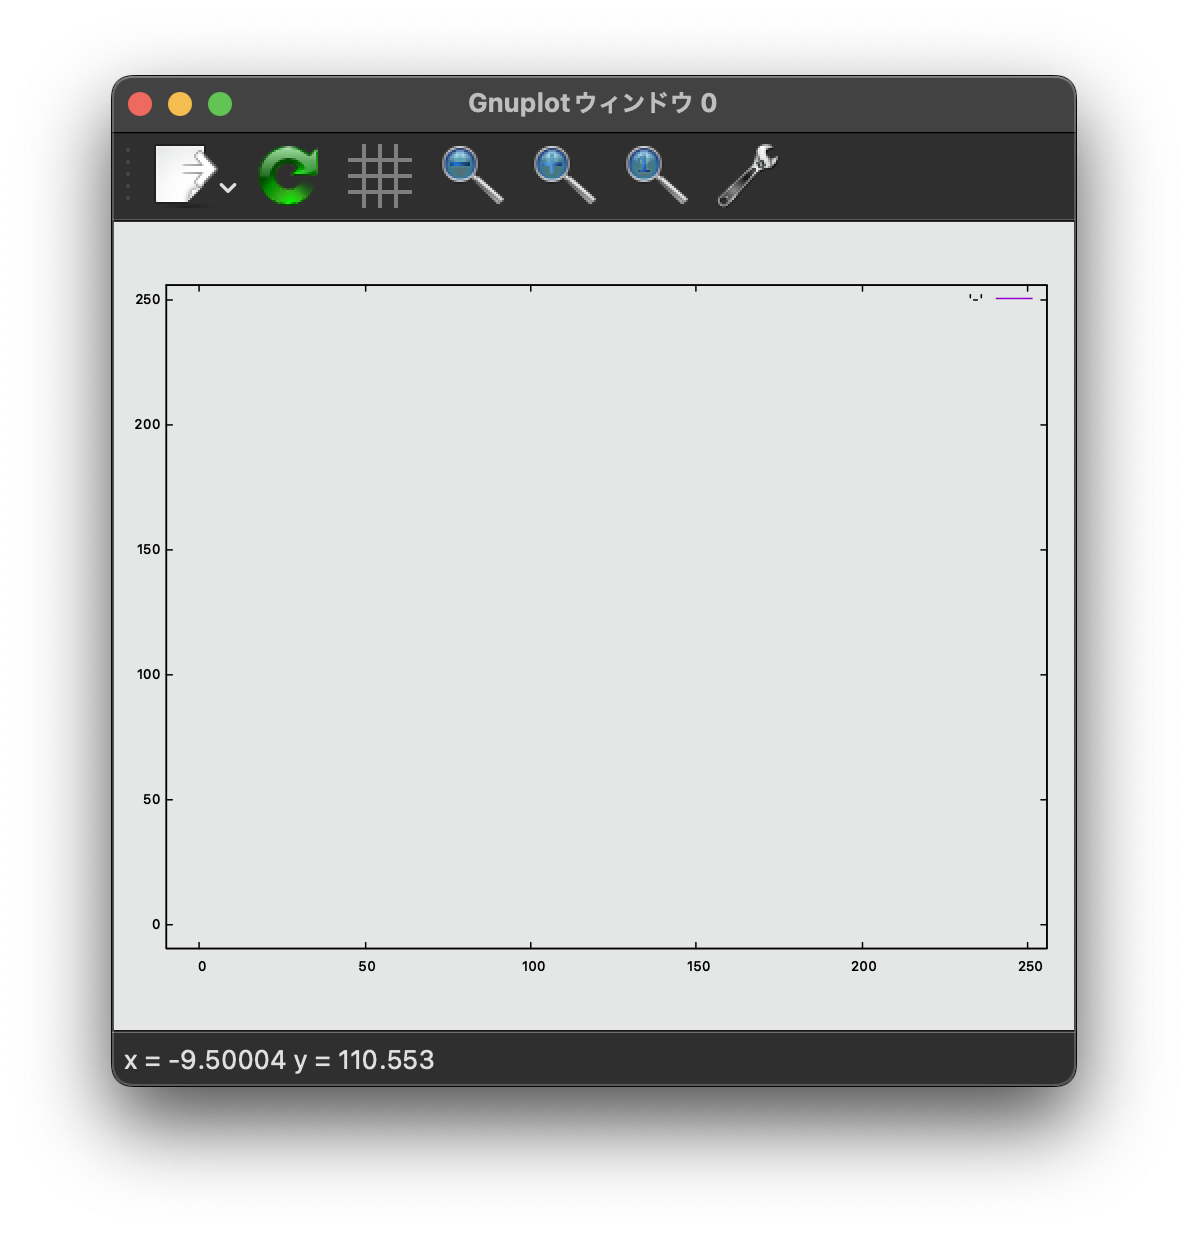
C言語で、グレースケールの入力画像の濃度ヒストグラムを計算し、gnuplotに出力するプログラムを作りたいです。実行するとコアダンプとなり、gnuplotの画面までは出るのですが、ヒストグラムが描画されません。解決方法を教えてください。
発生している問題・エラー
Segmentation fault: 11 (core dumped)
該当するソースコード
/****************
* ヒストグラム作成 *
*****************/

#include <stdio.h>
#include <stdlib.h>
#include "image.h"

void file_in(char *file_name, unsigned char **input, int size_x, int size_y);
void file_out(char *file_name, unsigned char **output, int size_x, int size_y);
//void Expansion(unsigned char **input, unsigned char **output, int size_f, int size_x, int size_y);
long int hist[256];

void histogram(){	//画像からヒストグラムを作る

		int i, ix, iy;// ループ用変数
		int	size_x, size_y;	// 入力画像の大きさ
		unsigned char	**input;	// 入力画像
	//ヒストグラムの初期化
        	for(i=0;i<256;i++) hist[i]=0;

	//ヒストグラムを作る
	        for(iy=0;iy<size_y;iy++){
        	     for(ix=0;ix<size_x;ix++){
         	         hist[input[iy][ix]]++;//累積を1追加
		    		}
      			}
}

int main(int argc, char *argv[])
{
	int		ix, iy;		// ループ用変数
	int		size_x, size_y;	// 入力画像の大きさ
	int		size_f;		// フィルタの大きさ
	unsigned char	**input;	// 入力画像
	unsigned char	**output;	// 出力画像
	FILE		*fp;		// ファイルポインタ
	FILE		*hoge;		//パイプを開く
	/*************
	* 引数の確認 *
	*************/
	if (argc!=2 && argc!=4) {
		printf("Usage: EXPANSION [in_file] [out_file] [size_filter] {size_x} {size_y}\n");
		exit(1);
	}

	if (argc == 2) {
		//size_f = atoi(argv[3]);
		size_x = SIZE_X;
		size_y = SIZE_Y;
	}

	if (argc == 4) {
		//size_f = atoi(argv[3]);
		size_x = atoi(argv[2]);
		size_y = atoi(argv[3]);
	}

	/*********************
	* 画像格納領域の確保 *
	*********************/
	input = (unsigned char **)malloc(size_y*sizeof(unsigned char *));
	if (input == NULL) {
		printf("MEMORY ERROR!\n");
		exit(1);
	}
	for (iy=0; iy<size_y; iy++) {
		input[iy] = (unsigned char *)malloc(size_x*sizeof(unsigned char));
		if (input[iy] == NULL) {
			printf("MEMORY ERROR!\n");
			exit(1);
		}
	}
	output = (unsigned char **)malloc(size_y*sizeof(unsigned char *));
	if (output == NULL) {
		printf("MEMORY ERROR!\n");
		exit(1);
	}
	for (iy=0; iy<size_y; iy++) {
		output[iy] = (unsigned char *)malloc(size_x*sizeof(unsigned char));
		if (output[iy] == NULL) {
			printf("MEMORY ERROR!\n");
			exit(1);
		}
	}

	/*******************************
	* ファイル入出力・フィルタ処理 *
	*******************************/
	file_in(argv[1], input, size_x, size_y);		// 画像ファイルの読込
	histogram();				//ヒストグラムを作成
	file_out(argv[2], output, size_x, size_y);		// 画像ファイルの出力

	hoge=popen("gnuplot -persist","w");	//gnuplot起動。-persistでずっと開いた状態にする
	//fprintf(hoge, "set xrange [0:256]\n");	//x軸の設定
	//fprintf(hoge, "set yrange [0:256]\n");	//y軸の設定
	fprintf(hoge, "plot '-' with lines\n");
	int i;
	for(i=0;i<256;i++){
		fprintf(hoge,"%d\t%ld\t",i,hist[i]);
	}
	fprintf(hoge, "e\n");
	pclose(hoge);
	fprintf(hoge, "pause -1\n");
	//return 0;
}
自分で試したこと
ヒストグラムの配列hist[256]の値を300や512など大きくしてみましたが、解決しませんでした。
0 likes

