Microsoft Power BI August 2020 Update (2.84.802.0 (2020年8月)) でAutomation Anywhereコネクタのベータ版が組み込まれました。これによりAutomation AnywhereでBot Insightに表示していたデータがPower BIにも取り込めるようになりました。Automation Anywhereの対応バージョンはv11.xおよびA2019です。
どのように接続するのか、やってみました。(今回はA2019でやってみました)
参考資料
- Microsoft Power BI Connectorがリリース - オートメーション道場
- Power BI Desktop August 2020 Feature Summary - Microsoft Power BI ブログ
- 【Automation Anywhere A2019】Bot Insightでロボットの状態や作業結果を簡単に可視化 - Bot Insightに対する理解をするには
- Data Connector for Power BI (v11)
- Data Connector for Power BI (A2019)
- Power Query: REST APIでListから取得したRecordをTableに変換するには
必要要件
- Automation Anywhere Control Room
- 使用するAutomation Anywhereユーザーアカウントで、ユーザーがAAE_Bot Insight AdminやAAE_Adminロールを持っていること
- Power BI Desktopをインストール済み
全体像
Automation Anywhere Control Room APIの中のBot Insight APIを使ってREST APIでデータをPower BI Desktopに読み込みます。

扱えるデータの種類
- Business Information: ビジネスデータ。Botの実行で記録されたビジネスデータを取得します。AAE_Bot Insight Admin権限が必要。
- Business Variable Profile: ビジネスデータ。Botで使われている変数名、変数型、最大値、最小値に関する情報を得ます。AAE_Bot Insight Admin権限が必要。
- Get Bot Run Data Detail: オペレーションデータ。過去のアクティビティに関する情報を取得します。AAE_Bot Insight Admin権限が必要。
- Get Audit Trail Data Detail: オペレーションデータ。他のユーザーも含めた監査データを取得します。AAE_Admin権限が必要。
Power BI DesktopでAutomation Anywhereをデータソースとして指定
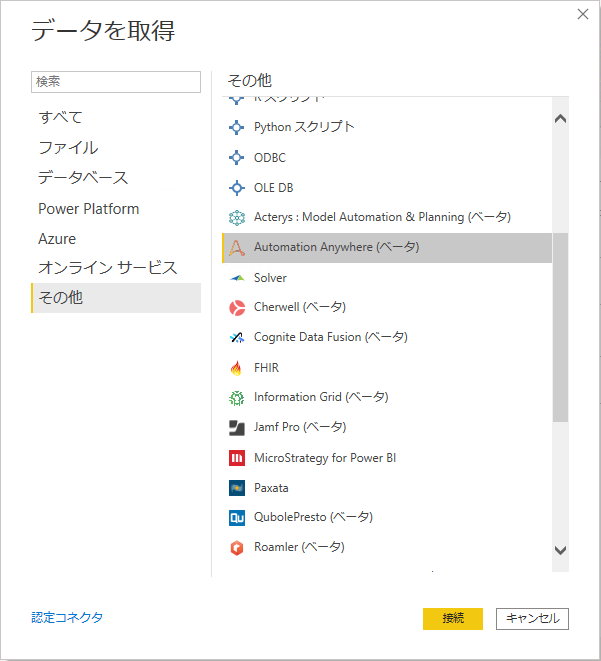
- Power BI Desktopで「データを取得」-「詳細」を選択します。

- 「データを取得」ダイアログボックスで「Automation Anywhere (ベータ)」を選択します。
以下のダイアログで「続行」ボタンをクリックします。
- Automation Anywhereのバージョン選択とControl Room URLを指定します。ここでは「A2019」を選択し、あらかじめ用意してあるControl Room URLを入力します。URLの最後に "/" は入れないようにしてください。

- ユーザー名とパスワードを入力して「接続」ボタンをクリックします。

- Power QueryでAPIの一覧がテーブルとして表示されます。

Get Bot Run Data Detailのデータを整形してPower BIに出力
以下では、APIの例としてGet Bot Run Data Detailを扱います。URLを指定するControl Roomではあらかじめある程度Botを実行していることで過去のアクティビティデータが溜まります。
- Get Bot Run Data Detailの右隣にあるFunctionをクリックします。

※2回目に実行すると、替わりに以下のダイアログになることもあります。その場合はGet Bot Run Data Detailを選択して「データの変換」ボタンをクリックすると同等の操作となります。
- パラメータの入力ダイアログボックスで「OK」ボタンをクリックします。

- Listで返ってきた結果をクリックします。
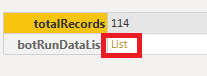
Listの中のRecordの一覧が表示されます。
- リボンの「テーブルへの変換」ボタンをクリックします。Listの中のRecord型のデータをTableに変換できます。
- List/Recordの内容がテーブルに展開された形のクエリが完成しました。リボンの一番左の「閉じて適用」ボタンをクリックすると、Power Queryが閉じてデータがPower BIにテーブル形式で読み込まれます。

Power BI Desktop上でレポートを仕上げる
Power BIにGet Bot Run Data Detailテーブルが読み込まれました。これからレポートを作成していきます。
- 視覚化パネルから「テーブル」と「円グラフ」を選択してキャンバス上に置きます。

- テーブルは表示したい列を選択します。
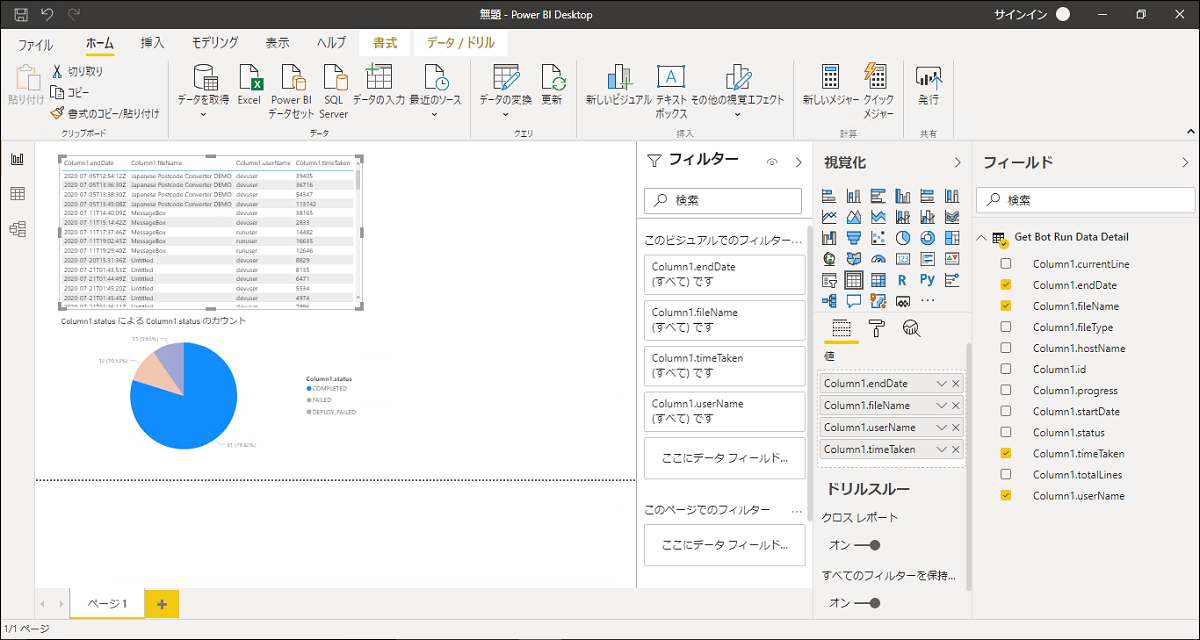
- 円グラフの方は「Cloumn1.status」を凡例と値にセットします。
このように、Automation AnywhereのBot Insight API経由でPower BIにも同じデータが表示できます。