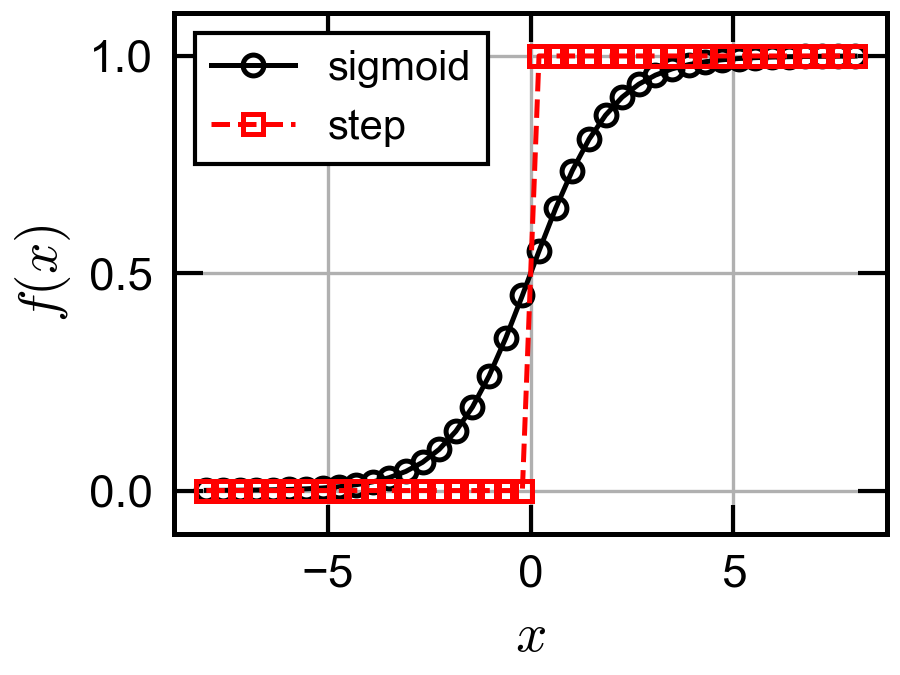
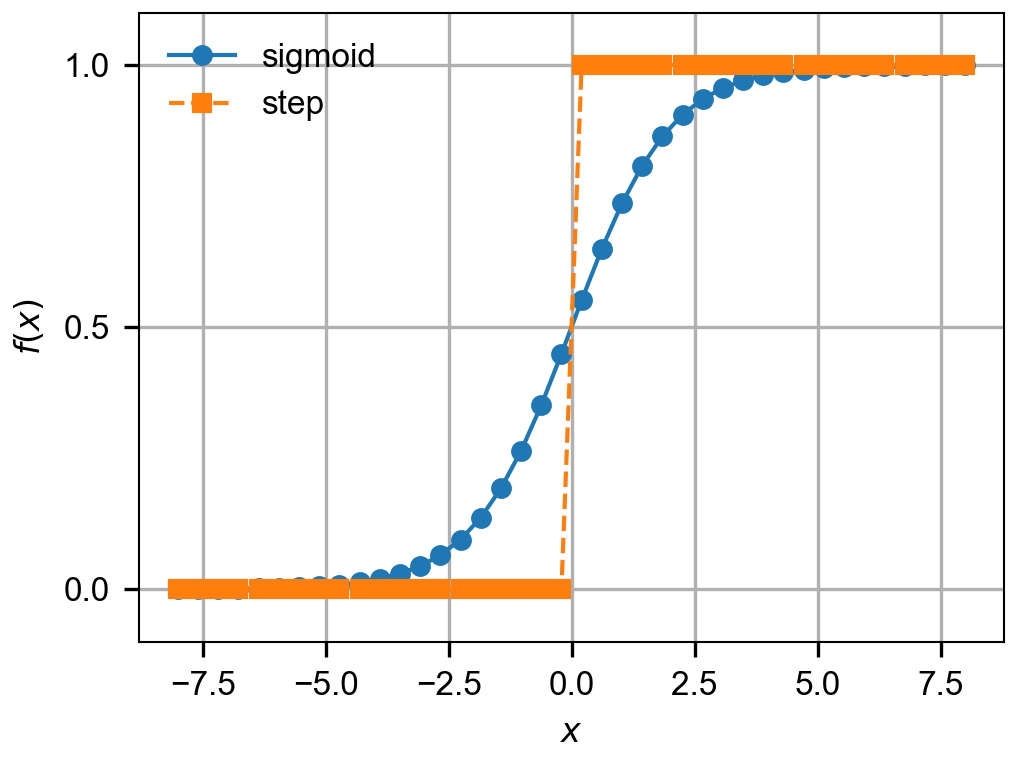
matplotlibの設定値をいじって,下のような自分好みのグラフを作ったメモです.
設定方法
メモ書きみたいなものなので,詳しくは解説しません.
他の親切な記事や,
公式のページなど見てください.
最低限の説明としては,
コード中でplt.rcParams["キー"]から直接設定するか,
設定値が書かれたmatplotlibrcというファイルを,
Macなら~/.matplotlib/matplotlibrc,linuxだと~/.config/matplotlib/matplotlibrcに置くとデフォルト値として反映されます.
または,style.mplみたいなstyle fileとして保存しておいて,コード内でplt.style.use("style.mpl")とすると設定が反映されます.
設定
matplotlibのデフォルトのグラフは,
- 色が薄い
- 文字が小さい
ため,オンサイトの研究発表時に,スクリーンに投影して発表すると薄くて見づらいことが多いです.
そのため,例えば,下記のような設定をします.
## font:少し大きめ
font.family : arial unicode ms
mathtext.fontset : cm
font.size : 11
axes.labelsize : large

## figure:画像サイズは8cm以内にする.bitmapなら高解像度に
figure.figsize: 3.0,2.25
# figure.constrained_layout: True
figure.dpi: 300
savefig.format: pdf

## ticks:両側につけて内向きにする.少し太くする
xtick.direction : in
ytick.direction : in
xtick.top   : True
ytick.right : True
axes.linewidth   : 1.2

## 凡例:非透明の黒四角で囲う
legend.fancybox   : False
legend.framealpha : 1
legend.edgecolor  :  black
legend.fontsize : 10

## 目盛り線を太くする.
xtick.major.pad: 5.0
xtick.major.size: 7
xtick.major.width: 1.0
xtick.minor.pad: 5.0
xtick.minor.size: 3.5
xtick.minor.width: 1.0
ytick.major.pad: 5.0
ytick.major.size: 7
ytick.major.width: 1.0
ytick.minor.pad: 5.0
ytick.minor.size: 3.5
ytick.minor.width: 1.0

## プロット線は太く,マーカーは白抜き
lines.linewidth  : 1.2
lines.markersize : 5
markers.fillstyle: none
lines.markeredgewidth: 1.2

## 色を原色にする.
axes.prop_cycle: cycler("color",["k","r","b","g"])
例
上記の設定をstyle.mplとして保存します.
これを用いてグラフを作ります.
import numpy as np
import matplotlib.pyplot as plt

plt.style.use("style.mpl")

fig,ax = plt.subplots(layout="constrained")
x = np.linspace(-8,8,40)
plt.plot(x,1./(1.+np.exp(-x)),"o-",label="sigmoid")
plt.plot(x,x>0.0,"s--",label="step")

ax.set(**{
  "xlabel" : r"$x$",
  "ylabel" : r"$f(x)$",
  "xlim" : (-8.8,8.8),
  "ylim" : (-0.1,+1.1),
  "yticks" : [0.0,0.5,1.0],
})
ax.grid()
ax.legend()
plt.savefig("sample")
出力は,
となります.
最近はscience_plotとかのライブラリで設定するのもあるみたいですね.
本当は,3年前くらいに作ったレシピです.
追記
Chatgptにも聞いて見ました.
please make matplotlibrc satisfying the Springer Nature requirements.
こういうのがいいんでしょうかね?

