この記事は株式会社ナレッジコミュニケーションが運営する クラウドAI by ナレコム Advent Calendar 2021 の3日目にあたる記事になります。
こんにちは!
今回は前回作成したモデルをリモデルしていきたいと思います。
モデルというのは、時間がたち新たなデータが増えてくることで規則性などに変化が起こり、予測精度がだんだん落ちてしまいます。
それを解消するためにリモデルを行います。
今回は精度を上げるためにでデータの形式を変更するので、このデータに合わせてリモデルしていきたいと思います。
この記事は前回の続きなので、前回のものと合わせて実行してください。
精度向上のアプローチ
前回作成したモデルの精度を上げたいなと思いました。また、今回利用したデータは数10MBと小さいデータですが実際には大容量のデータを利用する機会があると思います。
それに対応するためにStarbucks がとったアプローチを参考に店舗ごと、アイテムごとに分散処理を行うようにリモデルしたいと思います。
データの作成
前回同様データを作成します。
多少の変更はありますがほとんど前回と同様になっています。
sql_statement = '''
  SELECT
    store,
    item,
    date as ds,
    sales as y
  FROM
    history
  '''

store_item_history = (
  spark
    .sql( sql_statement )
    .repartition(sc.defaultParallelism, ['store', 'item'])
  ).cache()

display(store_item_history)
予測結果のフォーマットも作成しておきましょう。
from pyspark.sql.types import *

result_schema =StructType([
  StructField('ds',DateType()),
  StructField('store',IntegerType()),
  StructField('item',IntegerType()),
  StructField('y',FloatType()),
  StructField('yhat',FloatType()),
  StructField('yhat_upper',FloatType()),
  StructField('yhat_lower',FloatType())
  ])
'''

## モデルの作成
こちらも前回同様モデルを作成します。
前回と異なる点としては欠損データを削除している点です。

また、予測結果の結合を行っています。
これは、店舗・アイテムごとでモデルの作成、予測を行うため分かれているデータを結合する必要があるためです。

```python:notebook
from pyspark.sql.functions import pandas_udf, PandasUDFType

@pandas_udf( result_schema, PandasUDFType.GROUPED_MAP )
def forecast_store_item( history_pd ):

  # #1と同じロジックでモデルを作成
  # --------------------------------------
  # 欠損値を落とす(サブセットのデータ数によっては欠損値保管する必要あり)
  history_pd = history_pd.dropna()

  # モデル作成
  model = Prophet(
    interval_width=0.95,
    growth='linear', # linear or logistic
    daily_seasonality=False,
    weekly_seasonality=True,
    yearly_seasonality=True,
    seasonality_mode='multiplicative'
    )

  # モデル学習
  model.fit( history_pd )
  # --------------------------------------

  # #1と同じロジックで予測
  # --------------------------------------
  future_pd = model.make_future_dataframe(
    periods=90,
    freq='d',
    include_history=True
    )
  forecast_pd = model.predict( future_pd )
  # --------------------------------------

  # サブセットを結合
  # --------------------------------------
  # 予測から関連フィールドを取得
  f_pd = forecast_pd[ ['ds','yhat', 'yhat_upper', 'yhat_lower'] ].set_index('ds')

  # 履歴から関連するフィールドを取得
  h_pd = history_pd[['ds','store','item','y']].set_index('ds')

  # 履歴と予測を結合
  results_pd = f_pd.join( h_pd, how='left' )
  results_pd.reset_index(level=0, inplace=True)

  # データセットから店舗と品番を取得
  results_pd['store'] = history_pd['store'].iloc[0]
  results_pd['item'] = history_pd['item'].iloc[0]
  # --------------------------------------

  # データセットを返す
  return results_pd[ ['ds', 'store', 'item', 'y', 'yhat', 'yhat_upper', 'yhat_lower'] ]
'''

実際に実行していきたいと思います。
groupByを利用することで分割して予測することができます。

```python:notebook
from pyspark.sql.functions import current_date

results = (
  store_item_history
    .groupBy('store', 'item') # 分割して予測したいカラムを定義
    .apply(forecast_store_item) # 先のセルで定義した関数を適用 (モデリングと予測)
    .withColumn('training_date', current_date() ) # 予測を実行した日付のカラムを追加
    )

results.createOrReplaceTempView('new_forecasts')
'''

以下のクエリを実行することでモデルの作成、予測が実行されます。

```sql:notebook
%sql
SELECT * FROM new_forecasts
予測結果はクエリできるようにテーブルとして保存しておこうと思います。
%sql
-- create forecast table
create table if not exists forecasts (
  date date,
  store integer,
  item integer,
  sales float,
  sales_predicted float,
  sales_predicted_upper float,
  sales_predicted_lower float,
  training_date date
  )
using delta
partitioned by (training_date);

-- load data to it
insert into forecasts
select
  ds as date,
  store,
  item,
  y as sales,
  yhat as sales_predicted,
  yhat_upper as sales_predicted_upper,
  yhat_lower as sales_predicted_lower,
  training_date
from new_forecasts;
モデルの評価
モデルを評価していきます。
pandasUDFを利用することで、店舗・アイテムごとに評価指標を算出できるので、それぞれで算出し出力したいと思います。
import pandas as pd

# 評価指標のカラム定義
eval_schema =StructType([
  StructField('training_date', DateType()),
  StructField('store', IntegerType()),
  StructField('item', IntegerType()),
  StructField('mae', FloatType()),
  StructField('mse', FloatType()),
  StructField('rmse', FloatType())
  ])

# 評価指標の算出
@pandas_udf( eval_schema, PandasUDFType.GROUPED_MAP )
def evaluate_forecast( evaluation_pd ):

  # データセットのストアとアイテムを取得
  training_date = evaluation_pd['training_date'].iloc[0]
  store = evaluation_pd['store'].iloc[0]
  item = evaluation_pd['item'].iloc[0]

  # 評価指標を算出
  mae = mean_absolute_error( evaluation_pd['y'], evaluation_pd['yhat'] )
  mse = mean_squared_error( evaluation_pd['y'], evaluation_pd['yhat'] )
  rmse = sqrt( mse )

  # 結果を結合
  results = {'training_date':[training_date], 'store':[store], 'item':[item], 'mae':[mae], 'mse':[mse], 'rmse':[rmse]}
  return pd.DataFrame.from_dict( results )

# calculate metrics
results = (
  spark
    .table('new_forecasts')
    .filter('ds < \'2018-01-01\'') # 評価を履歴データ(正解ラベル)がある期間に制限
    .select('training_date', 'store', 'item', 'y', 'yhat')
    .groupBy('training_date', 'store', 'item')
    .apply(evaluate_forecast)
    )
results.createOrReplaceTempView('new_forecast_evals')
こちらもクエリできるようにテーブルに出力しておきましょう。
%sql

create table if not exists forecast_evals (
  store integer,
  item integer,
  mae float,
  mse float,
  rmse float,
  training_date date
  )
using delta
partitioned by (training_date);

insert into forecast_evals
select
  store,
  item,
  mae,
  mse,
  rmse,
  training_date
from new_forecast_evals;
'''

それでは実際にどのような評価だったのか確認してみたいと思います。
まずは店舗1~10の製品1に限定して予測結果を確認してみます。

```sql:notebook
%sql

SELECT
  store,
  date,
  sales_predicted,
  sales_predicted_upper,
  sales_predicted_lower
FROM forecasts a
WHERE item = 1 AND
      --store IN (1, 2, 3, 4, 5) AND
      training_date=current_date() AND
      date >= '2018-01-01'
ORDER BY store
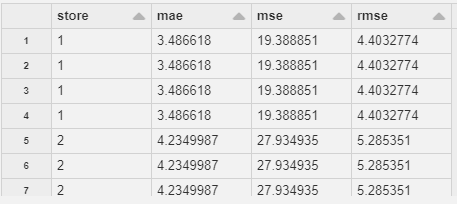
次に製品1について、店舗ごとの精度指標を確認してみましょう。
%sql

SELECT
  store,
  mae,
  mse,
  rmse
FROM forecast_evals a
WHERE --training_date=current_date() AND
  item = 1
ORDER BY store
このような結果になっています。
ここで前回の結果を合わせてみてみましょう。
-----------------------------
MSE: 1040.242690489999
RMSE: 32.25279353001844
MAE: 25.966749442943733
このような結果になっています。
すべての結果を確認しているわけではありませんが、どの指標もより良い数値になっていることがわかりますね。
リモデルに成功したようです!
まとめ
今回は前回作ったモデルに対して分散処理を取り入れるためにリモデルを行ってみました。
notebook上でデータを確認、生成しつつモデルを作成できるので、とても作成しやすい印象があります。
今回の記事はHow Starbucks Forecasts Demand at Scale with Databricksを参考にしています。

