はじめに
線形回帰を実施するとき、どのモデルが最も効率が良いのか試行する。データはscikit-learnのbreast_cancerを用いて実装する。このデータはウィスコンシン乳癌データセットと呼ばれるもので、腫瘍が良性であるか悪性であるかを判定したものである。データは569あり、そのうち良性は212、悪性は357、特徴量は30種類ある。これらのデータを用いて腫瘍が良性か悪性かを判定するモデルを作成し、最も決定係数が高くなるものを選択する。
線形重回帰による決定係数の算出とモデルの選択と線形重回帰による決定係数の算出とモデルの選択 part_2にて最も決定係数の高い線形回帰を選択した。しかし、決定係数は0.73とあまり高くない。そこで、影響力の高い特徴量を取捨選択するため、各特徴量における単回帰分析での寄与率を算出する。
シリーズ
- 線形重回帰による決定係数の算出とモデルの選択
- 線形重回帰による決定係数の算出とモデルの選択 part_2
- 単回帰分析による寄与率の算出
- 線形回帰と特徴量の絞り込み
- ロジスティック回帰(分類)とハイパーパラメータのチューニング
- 線形SVC(分類)とハイパーパラメータのチューニング
- 非線形SVC(分類)とハイパーパラメータのチューニング
- 決定木とハイパーパラメータのチューニング
- 決定木とハイパーパラメータのチューニング2
結果
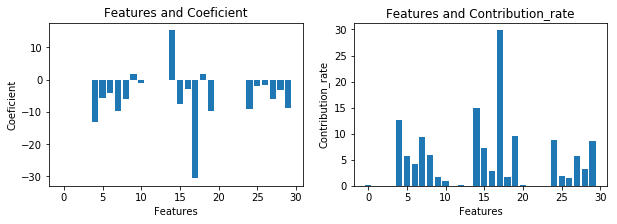
Coeficient(傾き)が大きいということは影響が強いということ。この値から寄与率を算出した。30ある特徴量のうちconcave points、smoothness、fractal dimensionの特徴量の値が特に影響している一方、perimeter、areaはほとんど影響していないことがわかった。(寄与率(降順)参照)。
寄与率(降順)
                   Features  Coeficient  Contribution_rate
17     concave points error  -30.652227          29.799896
14         smoothness error   15.376432          14.948867
4           mean smoothness  -13.084228          12.720401
19  fractal dimension error   -9.861306           9.587098
7       mean concave points   -9.675825           9.406775
24         worst smoothness   -9.118843           8.865280
29  worst fractal dimension   -8.794065           8.549533
15        compactness error   -7.549494           7.339569
8             mean symmetry   -5.993943           5.827272
27     worst concave points   -5.870000           5.706776
5          mean compactness   -5.826753           5.664731
6            mean concavity   -4.231503           4.113840
28           worst symmetry   -3.254645           3.164145
16          concavity error   -2.871775           2.791921
25        worst compactness   -1.924131           1.870627
18           symmetry error    1.750497           1.701822
9    mean fractal dimension    1.652794           1.606836
26          worst concavity   -1.607089           1.562401
10             radius error   -0.936652           0.910607
12          perimeter error   -0.127663           0.124113
0               mean radius   -0.098170           0.095440
20             worst radius   -0.076022           0.073908
1              mean texture   -0.046990           0.045683
21            worst texture   -0.035444           0.034459
11            texture error    0.029188           0.028376
2            mean perimeter   -0.014515           0.014111
22          worst perimeter   -0.011037           0.010730
13               area error   -0.005243           0.005097
3                 mean area   -0.000933           0.000907
23               worst area   -0.000596           0.000579
手順
- 乳癌データの読み込み
- Featureごとの単回帰分析の傾き(絶対値)の算出
- #データのプロット
- #寄与率の算出
- #寄与率を降順でソート
pythonによる実装
import numpy as np
import numpy as np
import pandas as pd
from sklearn.datasets import load_breast_cancer
from sklearn.linear_model import LinearRegression
from sklearn.model_selection import train_test_split
import matplotlib.pyplot as plt

# データの読み込み
cancer_data = load_breast_cancer()

feature = []
coef = []
abs_coef = []
contribution_rate = []

# Featureごとの単回帰分析の傾き(絶対値)
for i in range(0, 30):
    train_X, test_X, train_y, test_y = train_test_split(cancer_data.data[:,i], cancer_data.target, random_state=0)

    train_X = train_X.reshape((-1, 1))
    test_X = test_X.reshape((-1, 1))

    model = LinearRegression()
    model.fit(train_X, train_y)
    feature.append(i)
    coef.append(float(model.coef_))
    abs_coef.append(float(abs(model.coef_)))

# 寄与率の算出
for i in abs_coef:
    j = -i / sum(coef) *100
    contribution_rate.append(j)

# データのプロット
fig = plt.figure(figsize=(10, 3))
ax = fig.add_subplot(1, 2, 1)
ax.bar(feature, coef)
ax.set_title("Features and Coeficient")
ax.set_xlabel("Features")
ax.set_ylabel("Coeficient")

ax = fig.add_subplot(1, 2, 2)
ax.bar(feature, contribution_rate)
ax.set_title("Features and Contribution_rate")
ax.set_xlabel("Features")
ax.set_ylabel("Contribution_rate")
plt.show()

# 寄与率を降順でソート
df = pd.DataFrame(cancer_data.feature_names)
df.columns = ["Features"]
df["Coeficient"] = coef
df["Contribution_rate"] = contribution_rate
df = df.sort_values(by="Contribution_rate", ascending = False)
print(df)
おわりに
寄与率の高い特徴量を見積もることができた。これらを用いて決定係数がより高くなるモデルの作成を目指す。