はじめに
前回まで、時系列分析のARIMAモデル・ARIMAXモデルを用いて、将来の売上予測を行ってきました。
しかし、中々精度があがりません。
季節性の考慮が足りていないのではないかと想定し、次は季節性を含めたARIMAモデル=SARIMAモデルを適用していきたいと思います。
ただし、前回までに用いたPyFluxではSARIMAは使えなそうなので、「TV朝日の視聴率推移をSARIMAモデルで予測してみる」を参考にStatsModelsを用いていきます。
分析環境
Google Colaboratory
対象とするデータ
[前回]まで同様に、データは日別の売上と説明変数として気温(平均・最高・最低)を用います。
※今回はSARIMAなので、実際は気温は説明変数には使いません。
| 日付 | 売上金額 | 平均気温 | 最高気温 | 最低気温 |
|---|---|---|---|---|
| 2018-01-01 | 7,400,000 | 4.9 | 7.3 | 2.2 |
| 2018-01-02 | 6,800,000 | 4.0 | 8.0 | 0.0 |
| 2018-01-03 | 5,000,000 | 3.6 | 4.5 | 2.7 |
| 2018-01-04 | 7,800,000 | 5.6 | 10.0 | 2.6 |
季節性を考慮したARIMAモデル(SARIMA)
元データの作成は、前回までと同様です。
早速実際にモデルを作っていきますが、pyfluxと同じ様に使えます。
前回も採用した、パラメーターチューニングも実施していきます。SARIMAとして、季節性考慮のパラメータ(sp, sd, sq)が増えています。
あとは、次のパラメータも設定する必要があります。
- enforce_stationarity : ARの定常性を矯正するか否か
- enforce_invertibility : MAの反復可能性を強制するか否か
import pandas as pd
import statsmodels.api as sm

def optimisation_sarima(df, target):

  df_optimisations = pd.DataFrame(columns=['p','d','q','sp','sd','sq','aic'])

  max_p=4
  max_d=4
  max_q=4

  max_sp=2
  max_sd=2
  max_sq=2


  for p in range(0, max_p):
    for d in range(0, max_d):
      for q in range(0, max_q):
        for sp in range(0, max_sp):
          for sd in range(0, max_sd):
            for sq in range(0, max_sq):

              model = sm.tsa.SARIMAX(
                            df.kingaku, order=(p,d,q),
                            seasonal_order=(sp,sd,sq,4),
                            enforce_stationarity = False,
                            enforce_invertibility = False
                        )
              x = model.fit()

              print("AR:",p, " I:",d, " MA:",q, "SAR:",sp, "SI:",sd, "SMA:",sq," AIC:", x.aic)

              tmp = pd.Series([p,d,q,sp,sd,sq,x.aic],index=df_optimisations.columns)
              df_optimisations = df_optimisations.append( tmp, ignore_index=True )

  return df_optimisations

df_optimisations = optimisation_sarima(df, '売上金額')
df_optimisations[df_optimisations.aic == min(df_optimisations.aic)]
これでAICが最も小さくなるパラメータを表示します。
| p | d | q | sp | sd | sq | aic |
|---|---|---|---|---|---|---|
| 2.0 | 0.0 | 3.0 | 1.0 | 1.0 | 1.0 | 11056.356866 |
そのパラメータをモデルに指定して、改めてモデルを回して、モデルの評価を確認します。
sarima = sm.tsa.SARIMAX(
    df.kingaku, order=(3,0,3),
    seasonal_order=(1,1,1,4),
    enforce_stationarity = False,
    enforce_invertibility = False
).fit()

sarima.summary()
次のような結果が表示されます。
Statespace Model Results
Dep. Variable:	kingaku	No. Observations:	363
Model:	SARIMAX(3, 0, 3)x(1, 1, 1, 4)	Log Likelihood	-5416.395
Date:	Tue, 03 Mar 2020	AIC	10850.790
Time:	11:18:46	BIC	10885.537
Sample:	01-03-2018	HQIC	10864.619
- 12-31-2018
Covariance Type:	opg
coef	std err	z	P>|z|	[0.025	0.975]
ar.L1	0.7365	0.132	5.583	0.000	0.478	0.995
ar.L2	-0.3535	0.165	-2.145	0.032	-0.677	-0.031
ar.L3	-0.5178	0.132	-3.930	0.000	-0.776	-0.260
ma.L1	-0.4232	0.098	-4.315	0.000	-0.615	-0.231
ma.L2	-0.0282	0.096	-0.295	0.768	-0.216	0.159
ma.L3	0.6885	0.068	10.140	0.000	0.555	0.822
ar.S.L4	0.4449	0.091	4.903	0.000	0.267	0.623
ma.S.L4	-0.7696	0.057	-13.547	0.000	-0.881	-0.658
sigma2	1.489e+12	6.05e-14	2.46e+25	0.000	1.49e+12	1.49e+12
Ljung-Box (Q):	777.09	Jarque-Bera (JB):	44.86
Prob(Q):	0.00	Prob(JB):	0.00
Heteroskedasticity (H):	1.09	Skew:	0.60
Prob(H) (two-sided):	0.63	Kurtosis:	4.27


Warnings:
[1] Covariance matrix calculated using the outer product of gradients (complex-step).
[2] Covariance matrix is singular or near-singular, with condition number 3.14e+41. Standard errors may be unstable.
AICはそこまで変わっていないような。。。
グラフを見てみましょう。
# 予測
ts_pred = sarima.predict()

# 実データと予測結果の図示
plt.figure(figsize=(15, 10))
plt.plot(df.kingaku, label='DATA')
plt.plot(ts_pred, label='SARIMA', color='red')
plt.legend(loc='best')
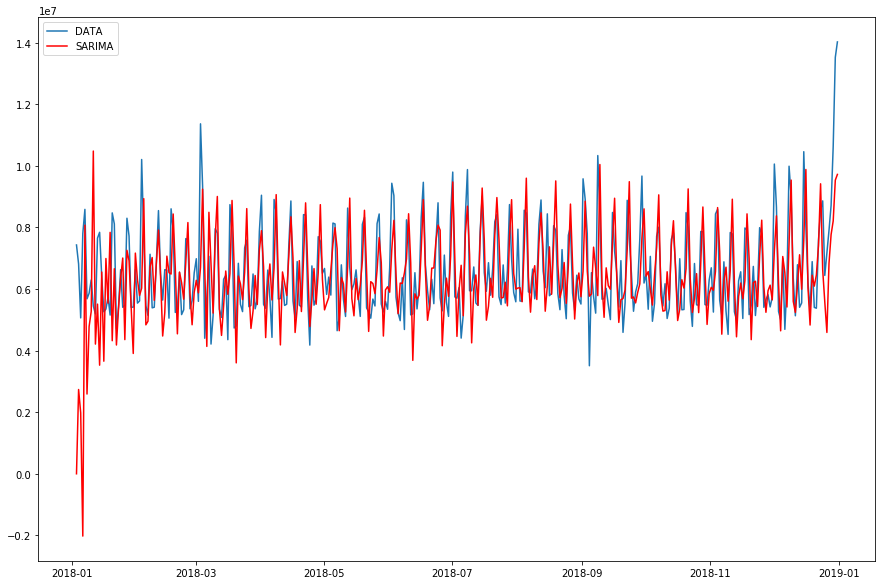
青が実数、赤がモデル値ですね。
平常時の上がり下がりはかなり予測できるようになってきましたが、年末などの極端に挙がる部分の予測はできていません。あと、年始が変な数値になってしまっています。
おわりに
3歩進んで2.5歩下がるという感じでしょうか。
次は、どういう形で改善していくのか検討中です。。。