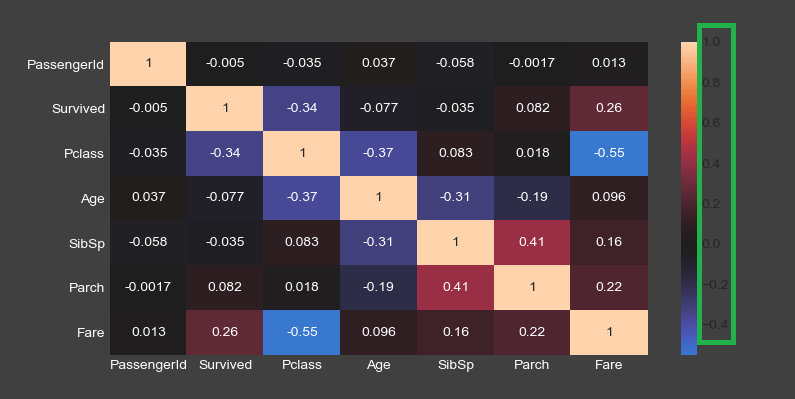
seabornのheatmapのカラーバーの目盛りの色を変更したい
Q&A
Closed
解決したいこと
seaborn.heatmap()のカラーバーについている目盛りの数値の色を変更したいのですが、やり方がわからないので教えていただきたいです。
画像の緑の四角で囲んだ中の数値です。
該当部分のコード
fig, ax = plt.subplots(
            figsize=(9.6, 5.4),
            facecolor="0.25")
        fig.subplots_adjust(
            left=0.2,
            bottom=0.3)
        ax.tick_params(colors="white")

        sns.heatmap(
            self.df_corr.iloc[index, column],
            ax=ax,
            annot=True,
            center=0)
よろしくおねがいします。
0 likes

