動作環境
Ubuntu 16.04.3 LTS desktop amd64
tmux 2.1-3build1
Python 2.7.12
Python 3.5.2
Jupyter Notebook v5.2.1-0d9838c
処理概要
- Cの関数内static変数と同等の処理を使う
- 折れ線データを作成する
- 前回のインデックスからの変化によるデータ作成
code v0.1
stacic_var_in_func_180830.ipynb
%matplotlib inline
import numpy as np
import matplotlib.pyplot as plt
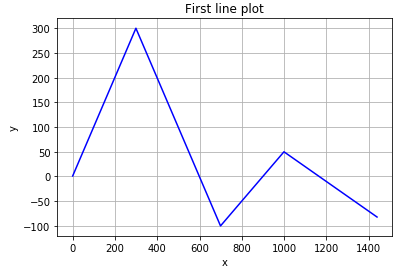
def calc_dummy_linear2(idx):
adder = 0.0
if idx < 300:
adder = 1.0
elif idx < 700:
adder = -1.0
elif idx < 1000:
adder = 0.5
else:
adder = -0.3
calc_dummy_linear2.pre += adder
return calc_dummy_linear2.pre
def calc_dummy_sin(idx):
arg = float(idx)/1440.0
wrk = np.sin(arg*np.pi)
wrk = wrk * np.sin(-arg*(np.pi*2.0)*2.0)
return wrk
# CONFIGURATION (selection of the function)
func = calc_dummy_linear2
#
NUM_DATA = 1440 # minutes in the day
input1 = range(NUM_DATA)
output = []
calc_dummy_linear2.pre = 0.0
for idx in range(NUM_DATA):
output += [func(idx)]
fig = plt.figure()
ax = fig.add_subplot(1, 1, 1)
x = np.linspace(-6, 6, 1000)
ax.plot(input1, output, color='blue', linestyle='solid')
ax.set_title('First line plot')
ax.set_xlabel('x')
ax.set_ylabel('y')
ax.grid(True)
# fig.show()
結果
注記
Pythonを扱う時間が減っているため、良い書き方ではないかもしれません。
より良い書き方は他のところを参考に。
関連
- python > array > 個数を決めて初期化する > mylist = [idx for idx in range(10)] / mylist = [0 for idx in range(10)] >> mylist = [0] * 10
- matplotlib > csvファイルを読み込んで折れ線グラフにする / 散布図にする
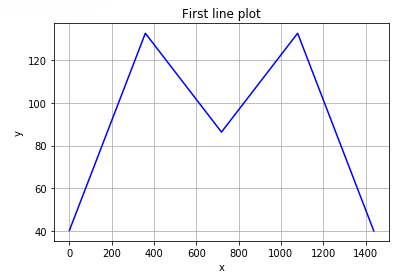
一つの関数内で完結させてみる
- 前提: idx=0が最初にコールされる
- 関数使用前の関数外での
calc_dummy_linear2.pre = 0.0は不要になる
def calc_dummy_linear2():
    MINVAL = 40.0
    MAXVAL = 130.0
    # assuming idx is used from 0
    if idx == 0:
        calc_dummy_linear2.pre = MINVAL

    adder = 0.0
    if idx < 1440*1/4:
        adder = 1.0
    elif idx < 1440*2/4:
        adder = -0.5
    elif idx < 1440*3/4:
        adder = 0.5
    else:
        adder = -1.0
    adder = adder / 350.0  # rescale from [0, 350] to [0, 1]
        # where 350 was obtained by checking the graph before the normalization
    adder = adder * (MAXVAL - MINVAL)
    calc_dummy_linear2.pre += adder  # as static variable
    return calc_dummy_linear2.pre
350.0という値は規格化する前に得られたグラフのおよその最大値。