動作環境
GeForce GTX 1070 (8GB)
ASRock Z170M Pro4S [Intel Z170chipset]
Ubuntu 14.04 LTS desktop amd64
TensorFlow v0.11
cuDNN v5.1 for Linux
CUDA v8.0
Python 2.7.6
IPython 5.1.0 -- An enhanced Interactive Python.
csvファイルを読み込んでmatplotlibで折れ線グラフにしてみた。
csvファイル生成
prep_data.py
import numpy as np
import random

numdata=100
x_data = np.random.rand(numdata)
y_data = np.sin(2*np.pi*x_data) + 0.3 * np.random.rand()

for xs, ys in zip(x_data, y_data):
	print '%.5f, %.5f' % (xs, ys)
csvファイル
$python prep_data.py > input.csv
input.csv
0.74597, -0.91122
0.33339, 0.95432
0.03281, 0.29314
0.49378, 0.12754
0.59515, -0.47443
0.19094, 1.02040
0.04446, 0.36420
0.02983, 0.27479
...
matplotlib描画 on Jupyter
参考 http://qiita.com/supersaiakujin/items/2719f4a1a2a1bce72a18
%matplotlib inline

import numpy as np
import matplotlib.pyplot as plt

data = np.loadtxt('input.csv', delimiter=',')
input1 = data[:,0]
output = data[:,1]

fig = plt.figure()
ax = fig.add_subplot(1,1,1)

x = np.linspace(-6,6,1000)

ax.plot(input1, output, color='black', linestyle='solid')

ax.set_title('First line plot')
ax.set_xlabel('x')
ax.set_ylabel('y')
ax.grid(True)
fig.show()
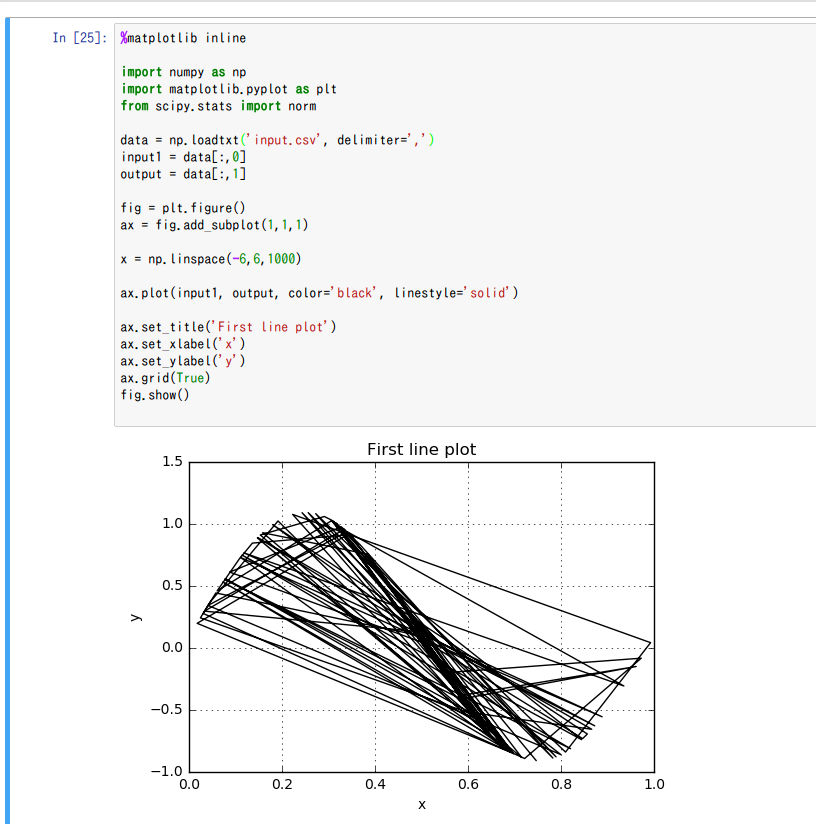
sine curveらしきものは見えた。
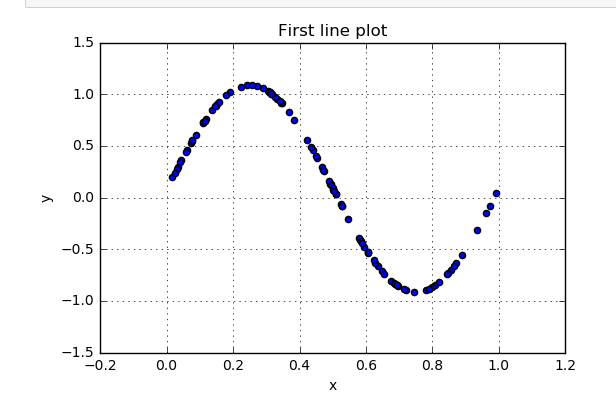
散布図
参考 http://qiita.com/supersaiakujin/items/ef85dd247cefdfbd2e2a
ax.plot(input1, output, color='black', linestyle='solid')
を以下にするだけ。
ax.scatter(input1, output)