APMを使ってみた。のメモ
アプリケーションの性能をモニタリングする
APM; Application Performance Monitoring
PythonとSQLiteの場合
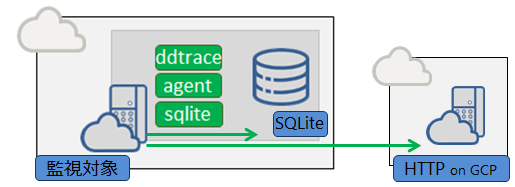
1台の仮想サーバー内に、テストプログラムとSQLデータベースを同居している。別のデータセンターのHTTPサーバーにもアクセスする。
コンフィグを設定:APMを有効にする。
/etc/datadog-agent/datadog.yaml
####################################
## Trace Collection Configuration ##
####################################

apm_config:
  enabled: true
  env: DD_TRACE_ANALYTICS_ENABLED=true
ddtrace-runがインストールされているか確認する
$ ddtrace-run -h

Execute the given Python program after configuring it to emit Datadog traces.
Append command line arguments to your program as usual.

Usage: [ENV_VARS] ddtrace-run <my_program>

<中略>
SQLデータベースを作る
$ sqlite3 kano.sqlite3
SQLite version 3.7.17 2013-05-20 00:56:22
Enter ".help" for instructions
Enter SQL statements terminated with a ";"
sqlite> create table heatrun(id integer, datetime text);
sqlite> insert into heatrun (id, datetime) values (1, '2020/02/02 22:13');
sqlite> select * from heatrun;
1|2020/02/02 22:13

sqlite> .table
heatrun
sqlite> .schema heatrun
CREATE TABLE heatrun (id integer, datetime text);

[ctrl]+[D]
テストプログラムを書く
データベースファイル名は[kano.sqlite3]、テーブル名は[heatrun]とした。データレコードは手動で作成済み。
~/readsql.py
# !/usr/bin/env python
# -*- coding: utf-8 -*-
import time
import datetime
import sqlite3
import commands
import requests

# cronで毎分実行。SQLite3データベースから時間を読み込むだけ。

dbname = 'kano.sqlite3'
conn = sqlite3.connect(dbname)
cursor = conn.cursor()

try:
    cursor.execute('SELECT * FROM heatrun')
    print(cursor.fetchone())

except KeyboardInterrupt:
    print('Keyboard Except')
    conn.close()

conn.close()

# Lambdaも実行する
cmd = 'curl -X POST https://3******wg.execute-api.ap-northeast-1.amazonaws.com/default/KanoLambdaMonitoring'
status, text = commands.getstatusoutput(cmd)
print(status)
print(text)

# GCPのサーバーにもHTTPアクセスする。index.htmlを返すだけ。
response = requests.get('http://**.**.**.**/index.html')
print(response)
テストプログラムからSQLiteにアクセスしてみる
ここが大事[ddtrace-run python プログラム.py]で実行する。
$ ddtrace-run python readsql.py
うまくSQLiteにアクセスできたらcrontabに自動スケジュールを設定する
crontabの設定を確認する↓
$ cat /etc/crontab
SHELL=/bin/bash
PATH=/sbin:/bin:/usr/sbin:/usr/bin
MAILTO=root

# For details see man 4 crontabs

# Example of job definition:
# .---------------- minute (0 - 59)
# |  .------------- hour (0 - 23)
# |  |  .---------- day of month (1 - 31)
# |  |  |  .------- month (1 - 12) OR jan,feb,mar,apr ...
# |  |  |  |  .---- day of week (0 - 6) (Sunday=0 or 7) OR sun,mon,tue,wed,thu,fri,sat
# |  |  |  |  |
# *  *  *  *  * user-name  command to be executed
* * * * * myusername ddtrace-run python readsql-cron.py
0 * * * * myusername ddtrace-run python ping1time.py
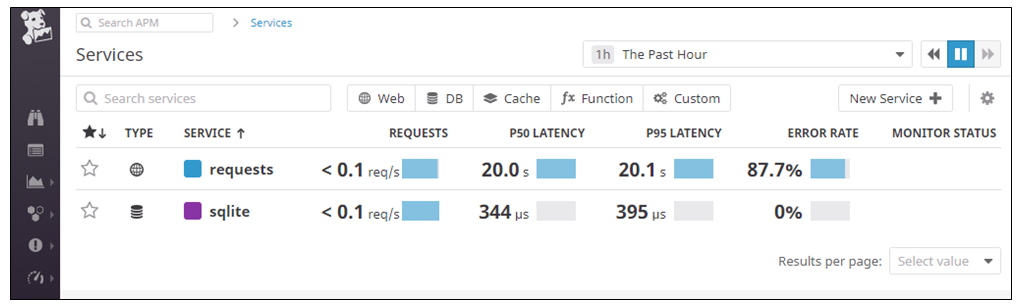
DatadogのAPMにアクセスしてみる。
「監視サーバー内部のSQLのレスポンス性能」と「監視サーバーの外部にあるGCPサーバーのHTTP応答性能」の2つが記録された。
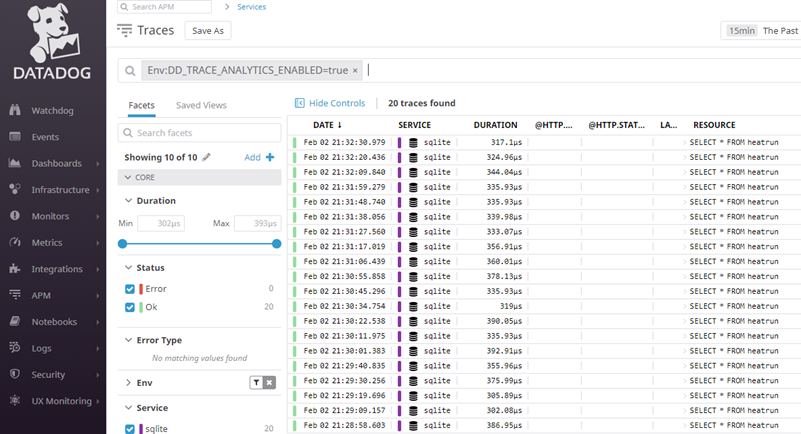
SQLにアクセスしたログが表示された。よく見るとSQL読み込みにかかった時間が表示されている。
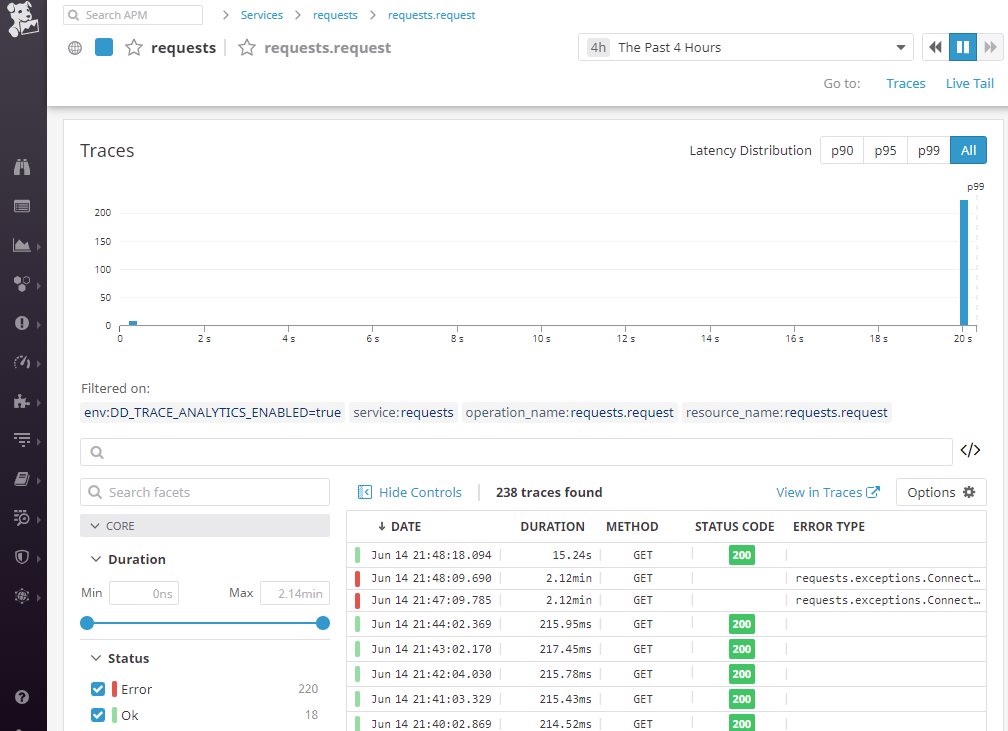
GCPサーバーからのHTTP応答(一時的にFWで拒否して、タイムアウト2分のErrorが記録された)
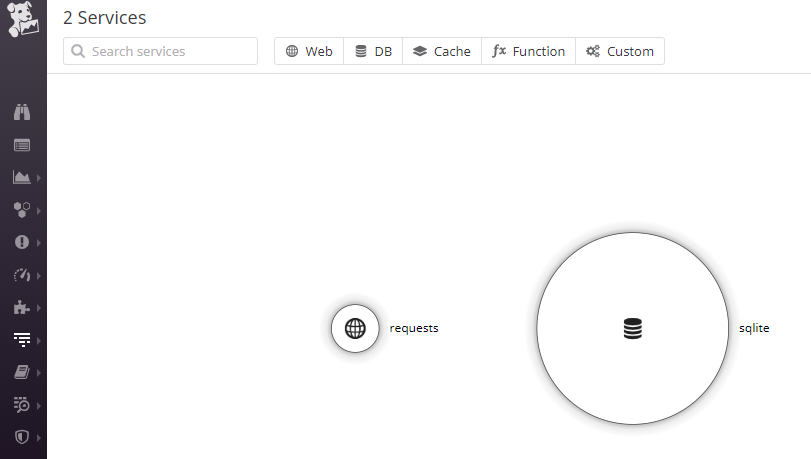
APM - Service Map
ぽつーーーん。テストプロと同居したサーバー1台だからね。せめて2台で試せばよかった。
一旦、まとめ
PythonでのAPMを試した。アプリケーション性能をモニタリングするなら[python プログラム名.py]に[ddtarace-run]をラップして実行したり、cronやservicedなどの設定も必要なので、インフラ運用チームだけじゃなくて、アプリ保守チームと運用設定を合意連携しなければならない。Node.jsやPHPやコンテナで使い方が違うようなので、また後日、勉強する。
Datadog関連記事
- [図解で、Datadogエージェントの設定手順] (https://qiita.com/1Kano/items/3533a8ebe5f6777840a6)
- [DatadogカスタムCheckの一番小さなコード] (https://qiita.com/1Kano/items/f1f897d8ee943f318c3e)
- [Datadogのデータ予測機能を使う] (https://qiita.com/1Kano/items/b6b484ae3e9afca3d296)
- [図解で、うちのワンコを真夏の暑さから守る(Datadogで)] (https://qiita.com/1Kano/items/5f2eed58794f13776a8e)
- [Datadog基本設定メモ(Windowsサーバ)] (https://qiita.com/1Kano/items/633b17fecec058a8eb2c)
- [Datadog基本設定メモ(CentOSサーバ)] (https://qiita.com/1Kano/items/6851fbe099f9be3fbe14)
- [Datadog基本設定(Log Explorer)] (https://qiita.com/1Kano/items/1c959c20cba3151db071)
- [Datadog基本設定(APM)] (https://qiita.com/1Kano/items/33dbcbc6bc86d369146a)