最近グラフ、グラフの書き方を勉強中。kaggleまでの道は長し。。。
figure, axesでのレイアウトの仕方を良く忘れるので、まとめます。
はじめてのmatplotlib
まずはお試し。わからない点は下にまとめていきます。
import matplotlib.pyplot as plt
plt.style.use('seaborn-whitegrid')
import numpy as np
%matplotlib inline
x = np.linspace(0, 10, 10000) #わからない1
fig = plt.figure() #わからない2
ax = plt.axes() #わからない3
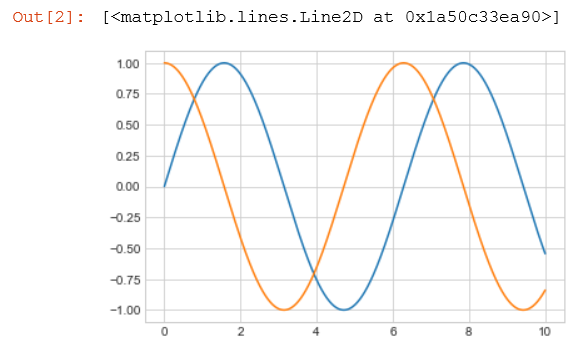
plt.plot(x, np.sin(x)) #同じfigureの中に追加
plt.plot(x, np.cos(x)) #同じfigureの中に追加
結果:
(わからない1) linspace便利そう
線形に等間隔な数列を生成するライブラリ。
numpy.linspace(start, stop, num = 50, endpoint = True, retstep = False, dtype = None)
不明点は以下でした。
- num: 生成する配列(ndarray)の要素数を指定。
- endpoint: 生成する数列において、stopを要素に含むかどうかを指定。Trueなら含み、Falseなら含まない。
- retstep: 生成された配列(ndarray)の後に公差を表示するかどうかを指定。Trueなら表示し、Falseなら非表示。
- dtype: 出力された配列(ndarray)のデータ型を指定。指定がない場合、データ型はfloat。
(わからない2) figureはいくつ作るべきの?
figureの作り分けはファイルへの保存をベースにするのだそうです。つまりファイル保存が figure 単位。私は、まだ一つだけしか必要としたことがありません。
あとfigsize=(8,6)で図のサイズを決めています。数字はインチ。デフォルトが(8,6)。
例:
fig, axes = plt.subplots(figsize=(7,4))
plt.figure(figsize=(3, 4))
(わからない3) axes使ってないじゃん
axesとfigureは、複数のグラフのレイアウトをするときにうまいことやってくれます。詳しくは次の章にまとめます。
グラフのレイアウトの仕方
1. figure 1 つのとき
x = np.linspace(0, 10, 20)
y1 = x
y2 = x ** 2
# figure は 1 つ
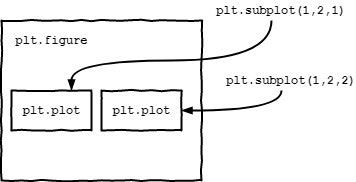
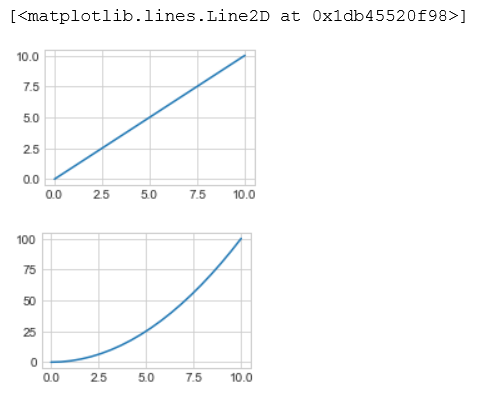
plt.figure(figsize=(6, 2)) # figureの縦横の大きさ
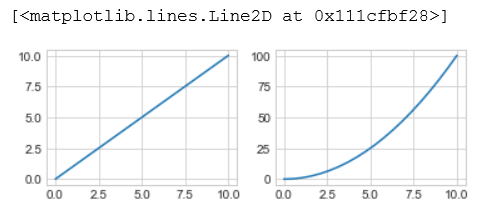
plt.subplot(1,2,1) # figure内の枠の大きさとどこに配置している。subplot(行の数,列の数,何番目に配置しているか)
plt.plot(x, y1)
plt.subplot(1,2,2)
plt.plot(x, y2)
イメージ:
結果:
2. figures 2つのとき
x = np.linspace(-3, 3, 20)
y1 = x
y2 = x ** 2
# figure 1 つ目
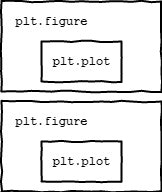
plt.figure(figsize=(3, 2))
plt.plot(x, y1)
# figure 2 つ目
plt.figure(figsize=(3, 2))
plt.plot(x, y2)
イメージ:
結果:
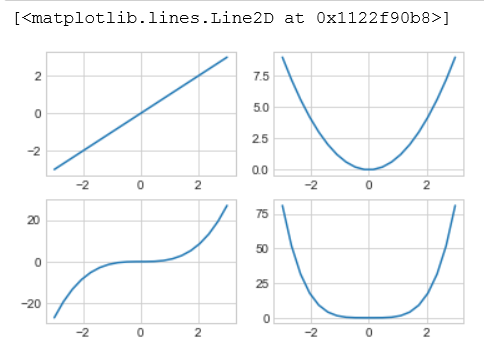
3. subplotsとax[x,x]
x = np.linspace(-3, 3, 20)
y1 = x
y2 = x ** 2
y3 = x ** 3
y4 = x ** 4
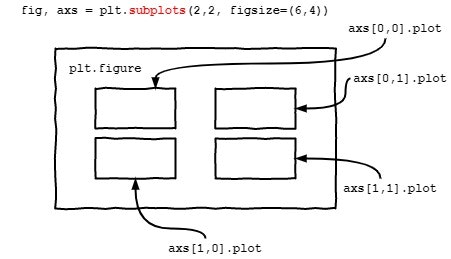
fig, ax = plt.subplots(2, 2, figsize=(6, 4))
# 左上
ax[0, 0].plot(x, y1)
# 右上
ax[0, 1].plot(x, y2)
# 左下
ax[1, 0].plot(x, y3)
# 右下
ax[1, 1].plot(x, y4)
イメージ:
結果:
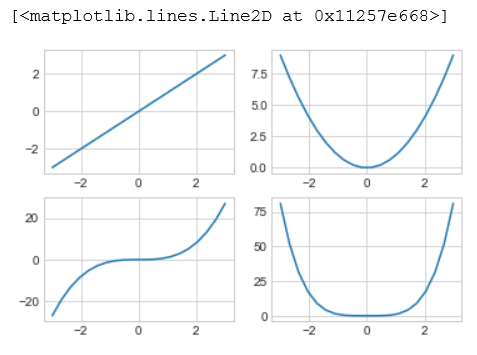
4. add_subplot
x = np.linspace(-3, 3, 20)
y1 = x
y2 = x ** 2
y3 = x ** 3
y4 = x ** 4
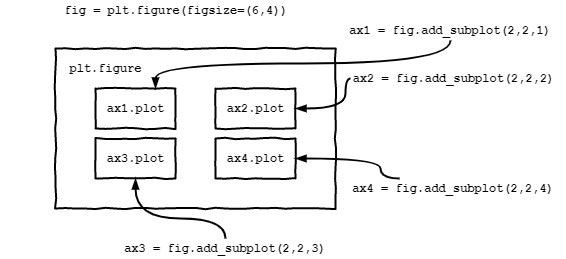
fig = plt.figure()
# 左上
ax1 = fig.add_subplot(2, 2, 1)
ax1.plot(x, y1)
# 右上
ax2 = fig.add_subplot(2, 2, 2)
ax2.plot(x, y2)
# 左下
ax3 = fig.add_subplot(2, 2, 3)
ax3.plot(x, y3)
# 右下
ax4 = fig.add_subplot(2, 2, 4)
ax4.plot(x, y4)
イメージ:
結果:
subplotの使い方
subplot(行数、列数、プロット番号)
行数と列数はfigure内の位置を指している。
プロット番号は3x3だとこんな感じで指定。
1 2 3
4 5 6
7 8 9
plt.subplot(221) とも書ける。
あとがき
異なるグラフをひとつのグラフの中で重ねたりもできる(一番最初の例ではsinとcosのグラフを一つに書いている)と最後に気づきました。次はグラフ一つ一つを整理しながら、まとめたいと思います。
参考:
matplotlib の figure(図) と axes(座標軸)-python
大変参考になりました、ありがとうございました。