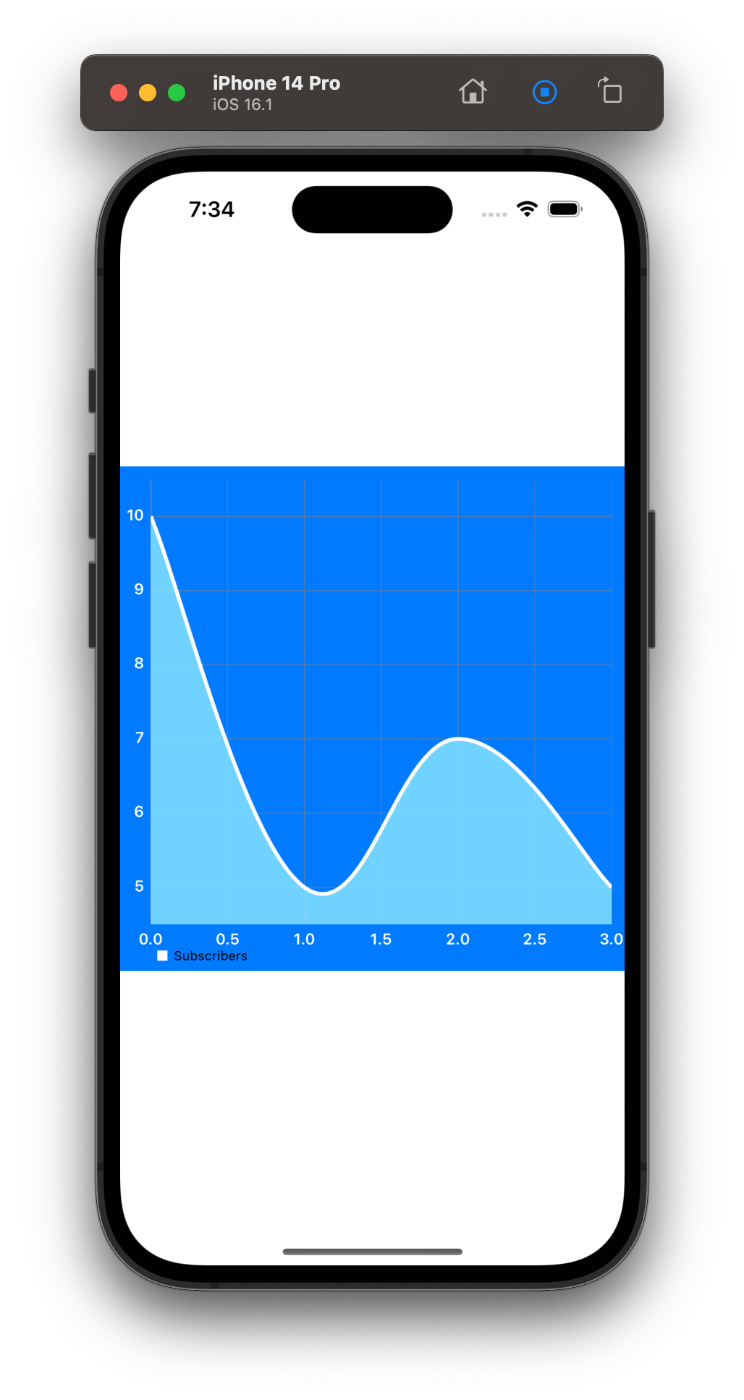
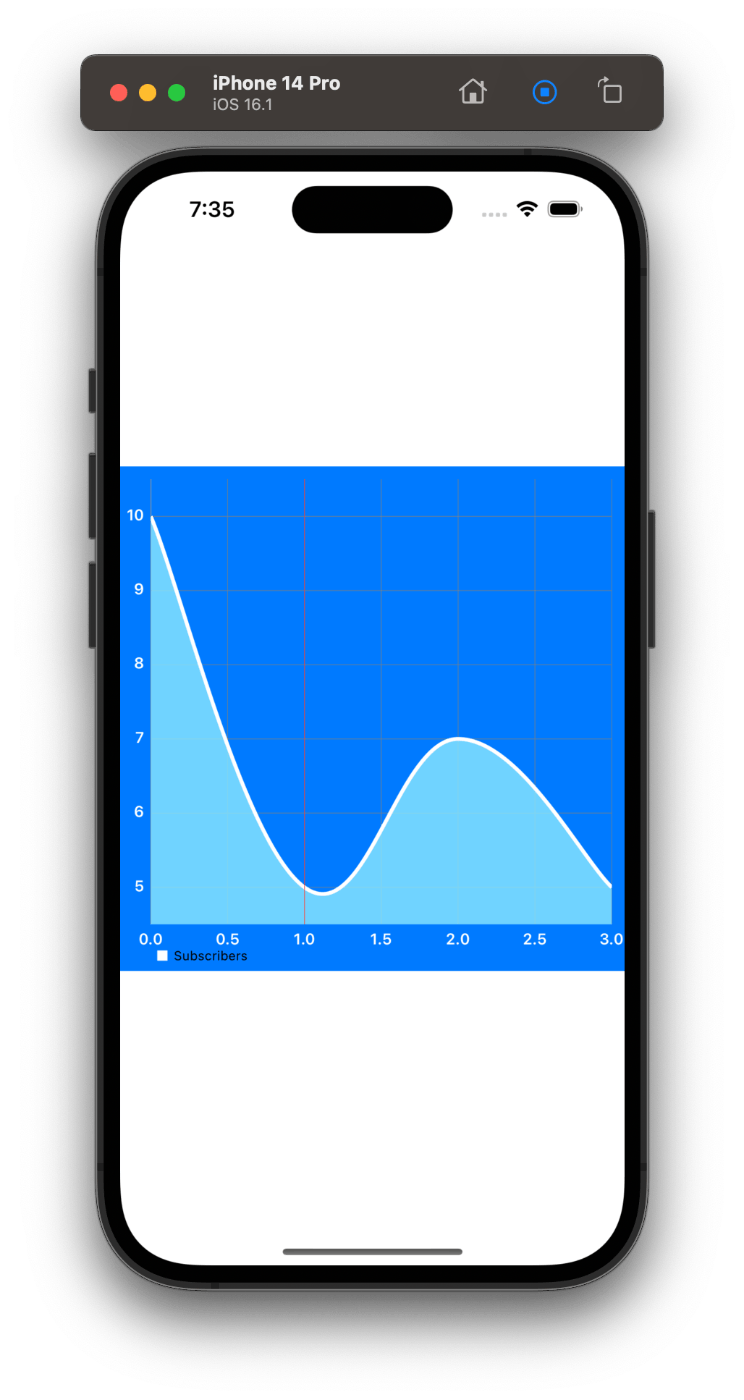
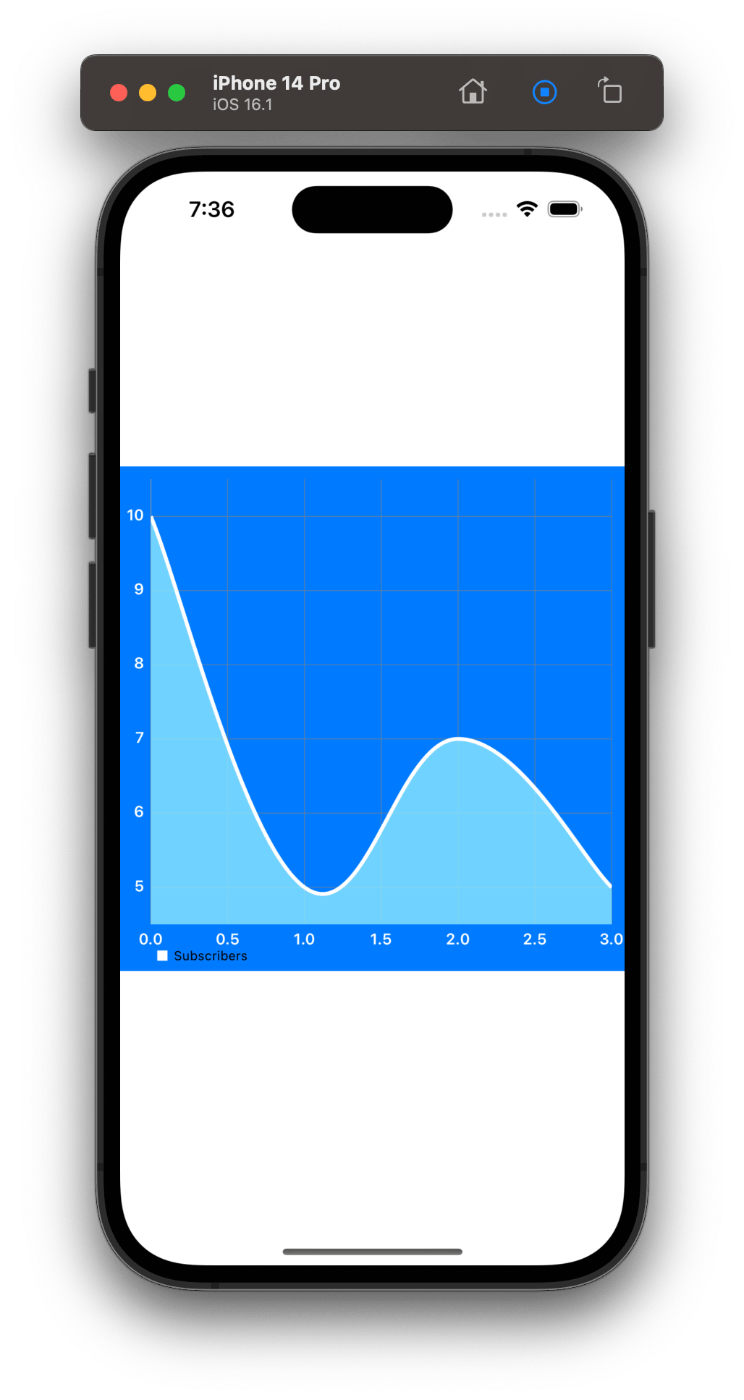
一個一個コードをスクショ付きで解説していきます。
一番下にコードも貼っておきます。
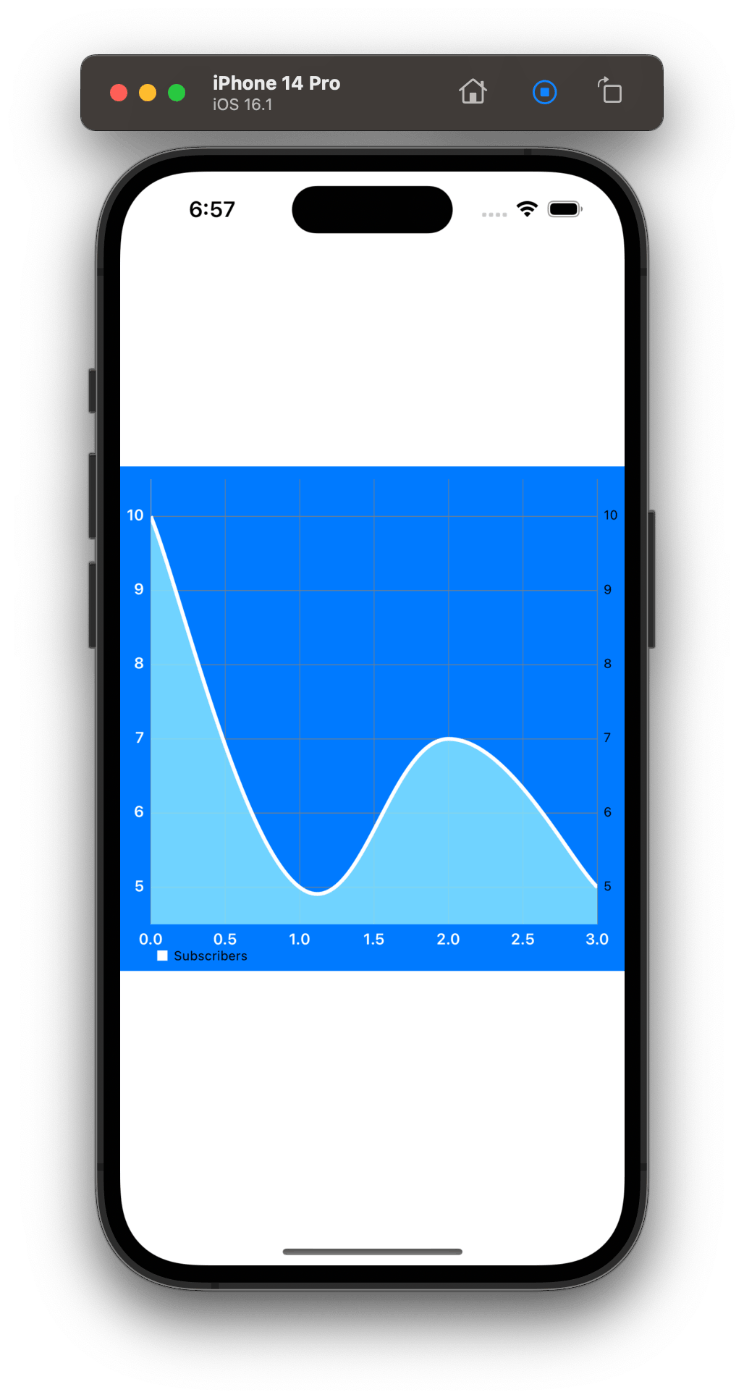
『.rightAxis.enabled = true』と書くと
グラフの右側に数字が表示されます。
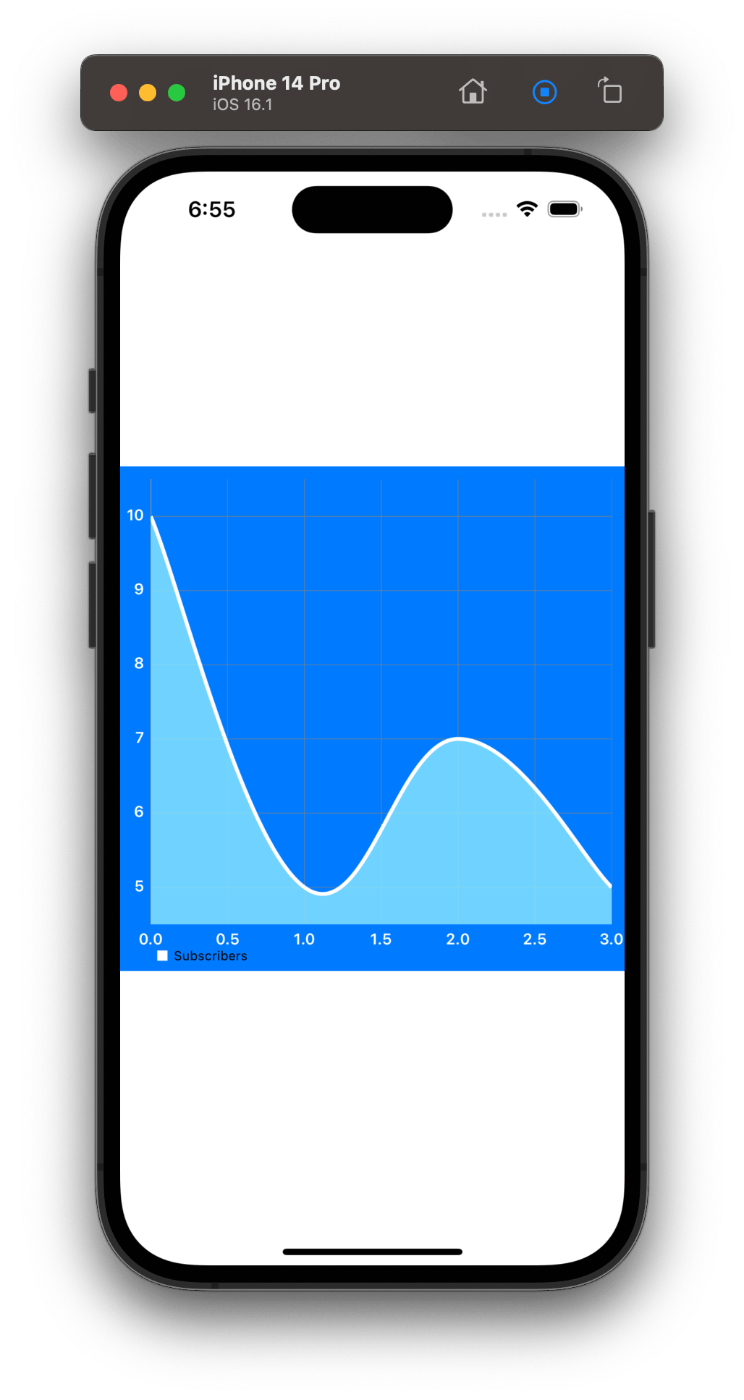
『.rightAxis.enabled = false』と書くと
グラフの右側に数字が表示されません。
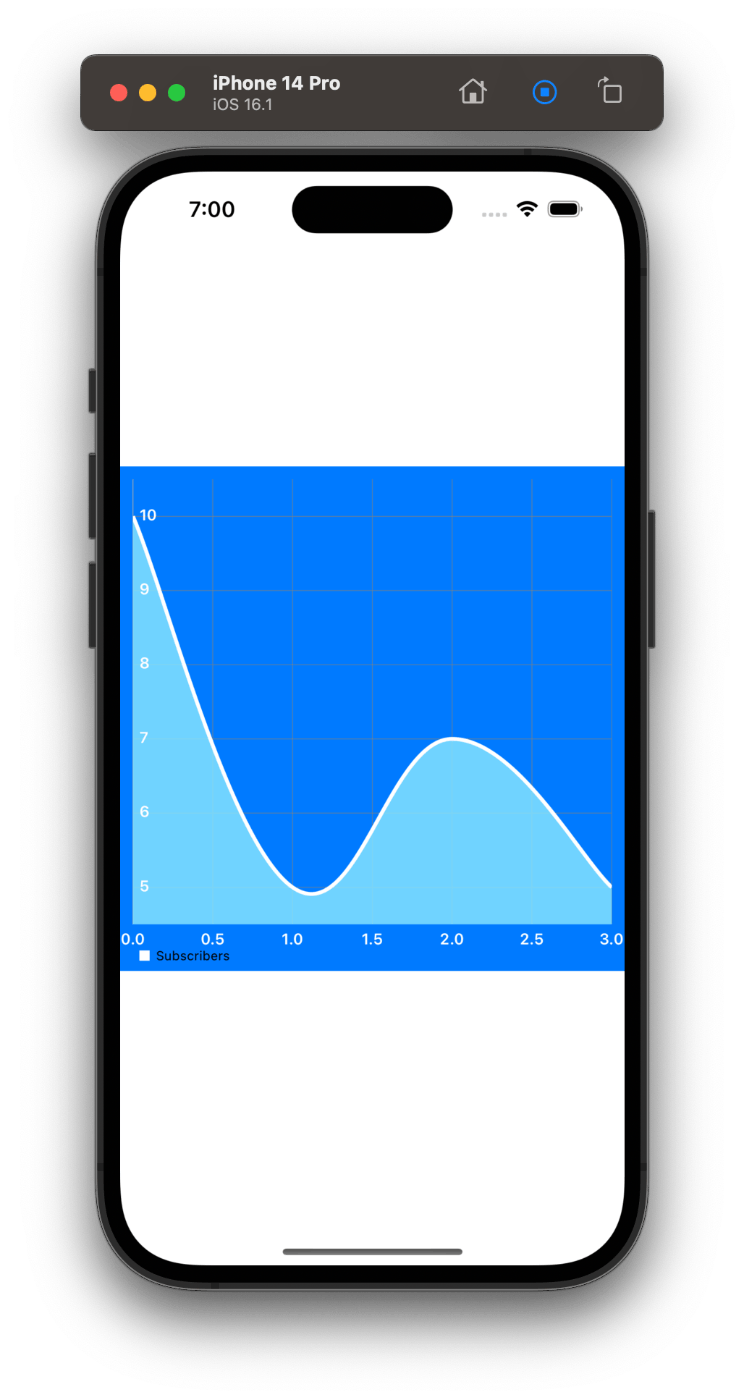
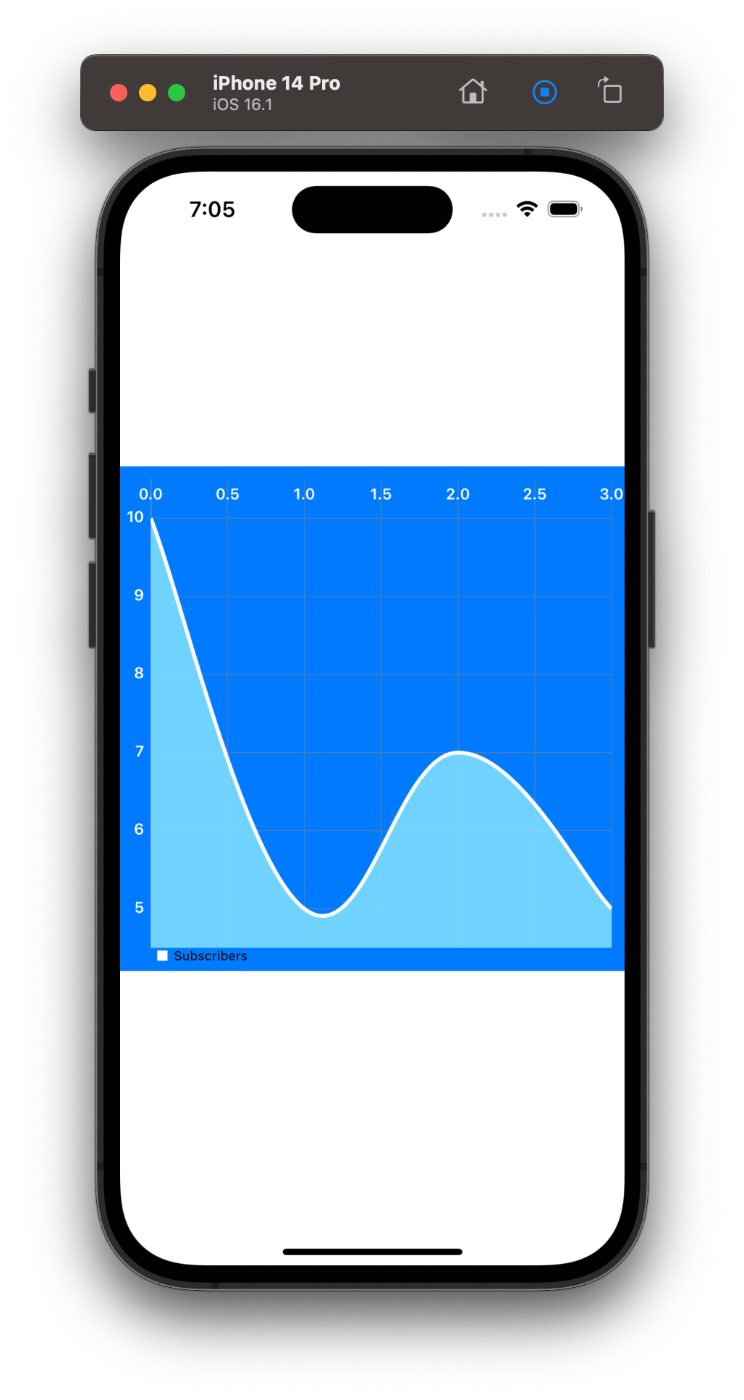
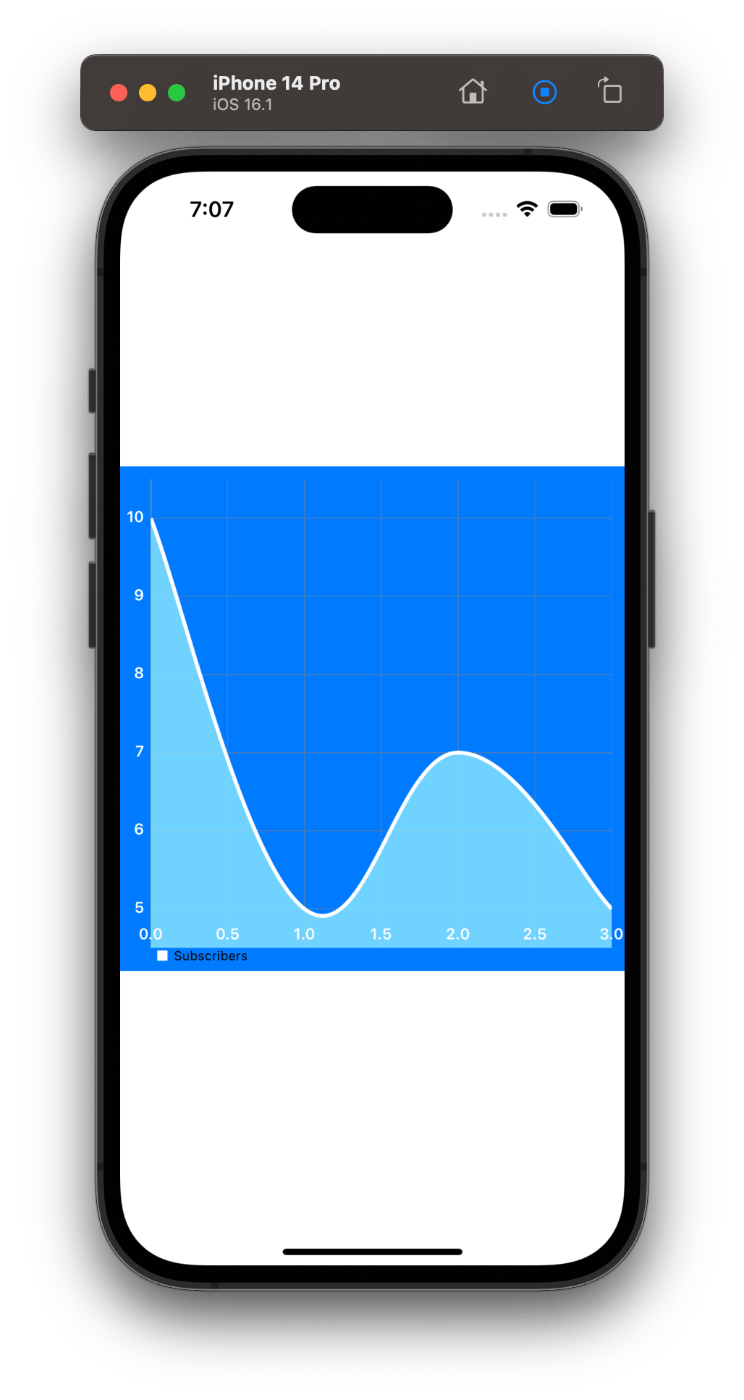
『.labelPosition = .insideChart』と書くと
グラフの内側に数字が表示されます。
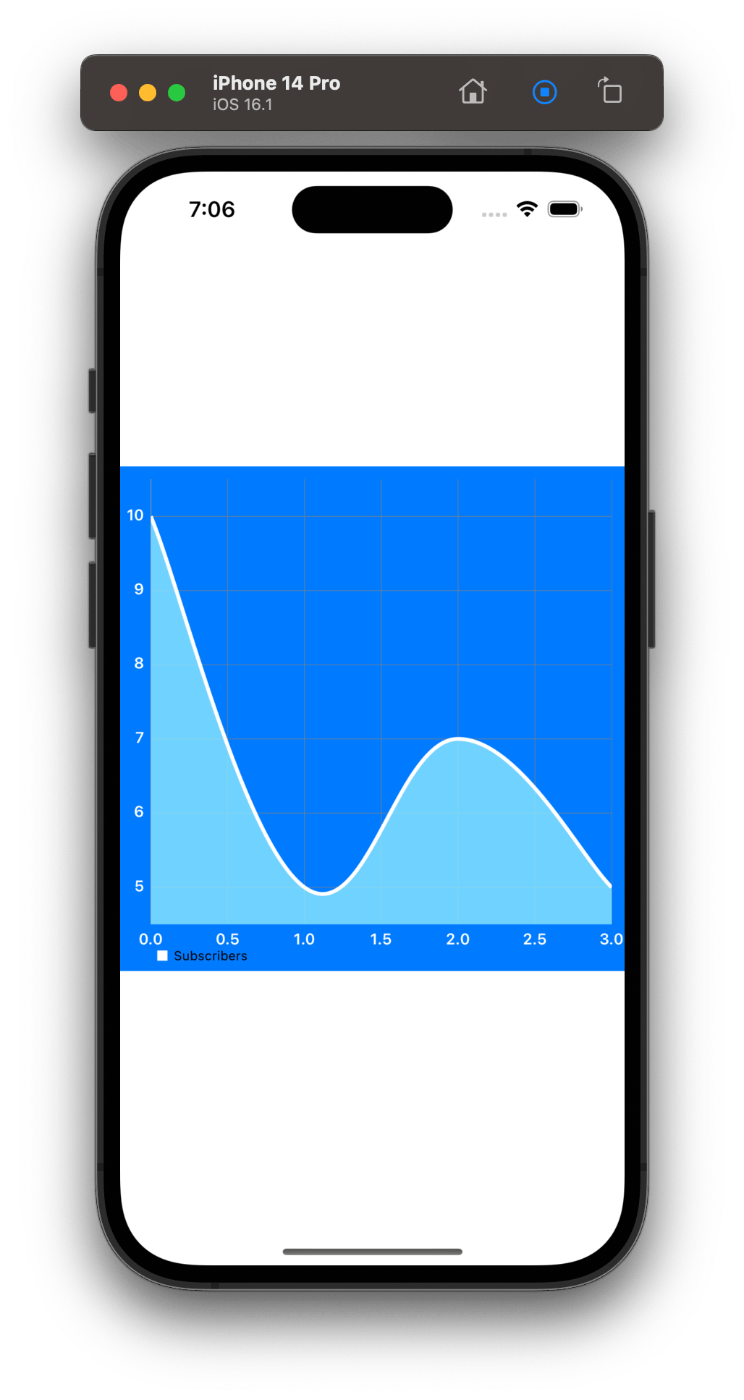
『.labelPosition = .outsideChart』と書くと
グラフの外側に数字が表示されます。
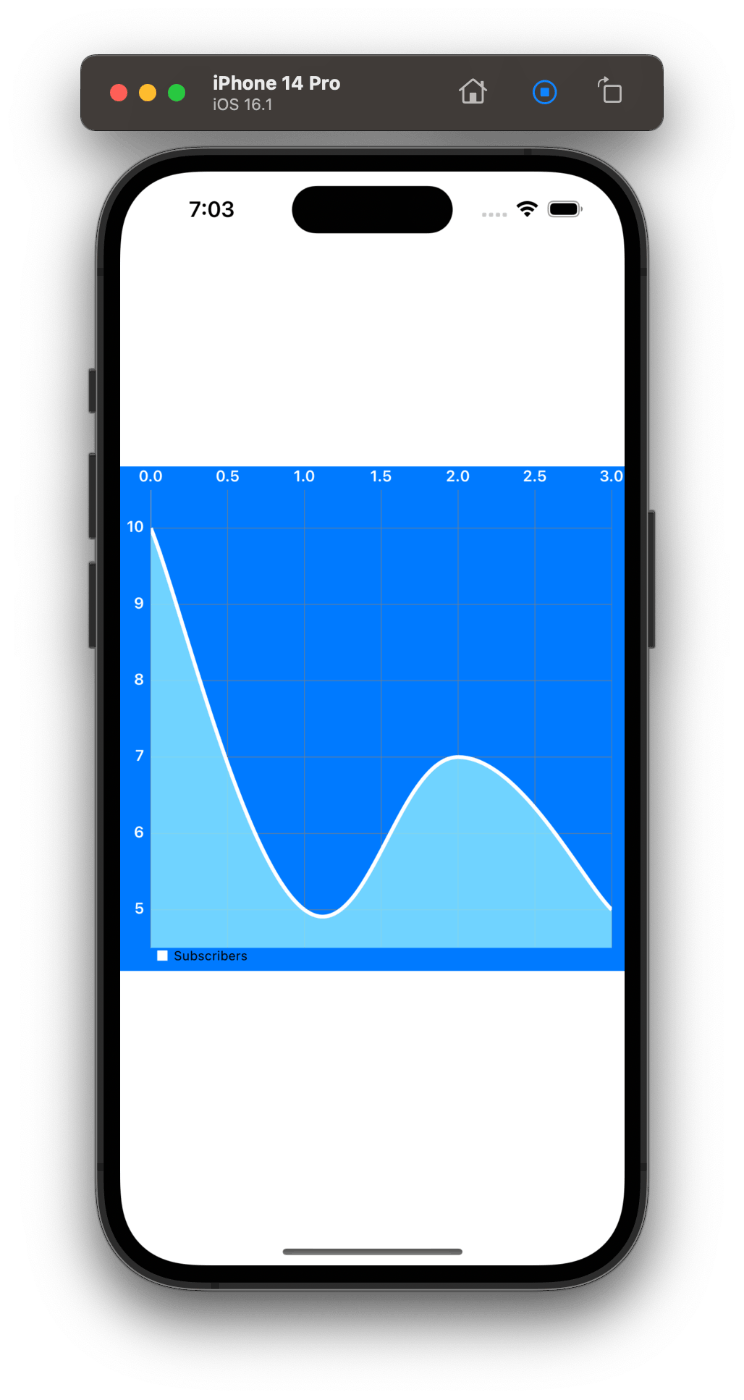
『.labelPosition = .top』と書くと
x軸(横の軸)の数字がグラフの上に表示されます。
『.labelPosition = .topInSide』と書くと
x軸(横の軸)の数字がグラフの上かつ内側に表示されます。
『.labelPosition = .bottom』と書くと
x軸(横の軸)の数字がグラフの下に表示されます。
『.labelPosition = .bottomInSide』と書くと
x軸(横の軸)の数字がグラフの下かつ内側に表示されます。
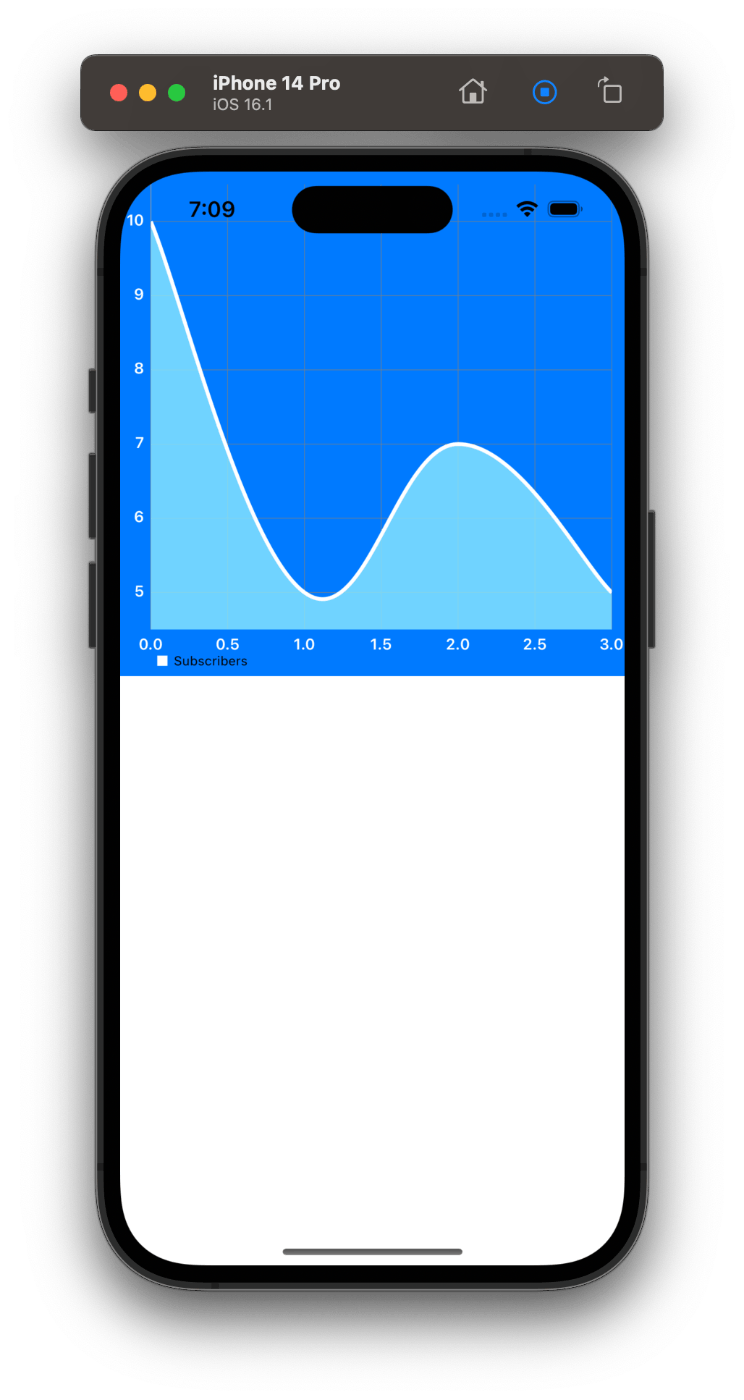
『.centerInSuperview()』と書かないと
デフォルトではどうやらグラフが上に表示されるようです。
『.centerInSuperview()』と書くと
グラフが真ん中に表示されるようになります。
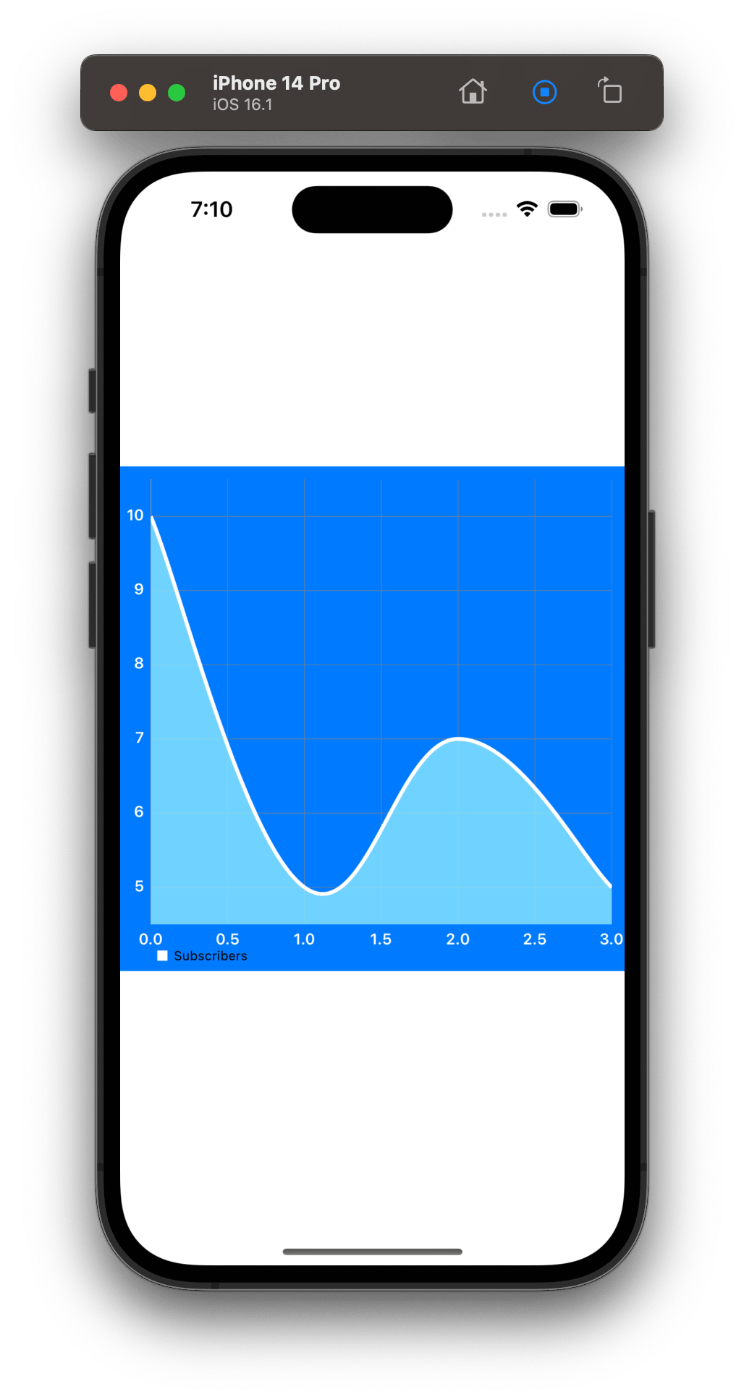
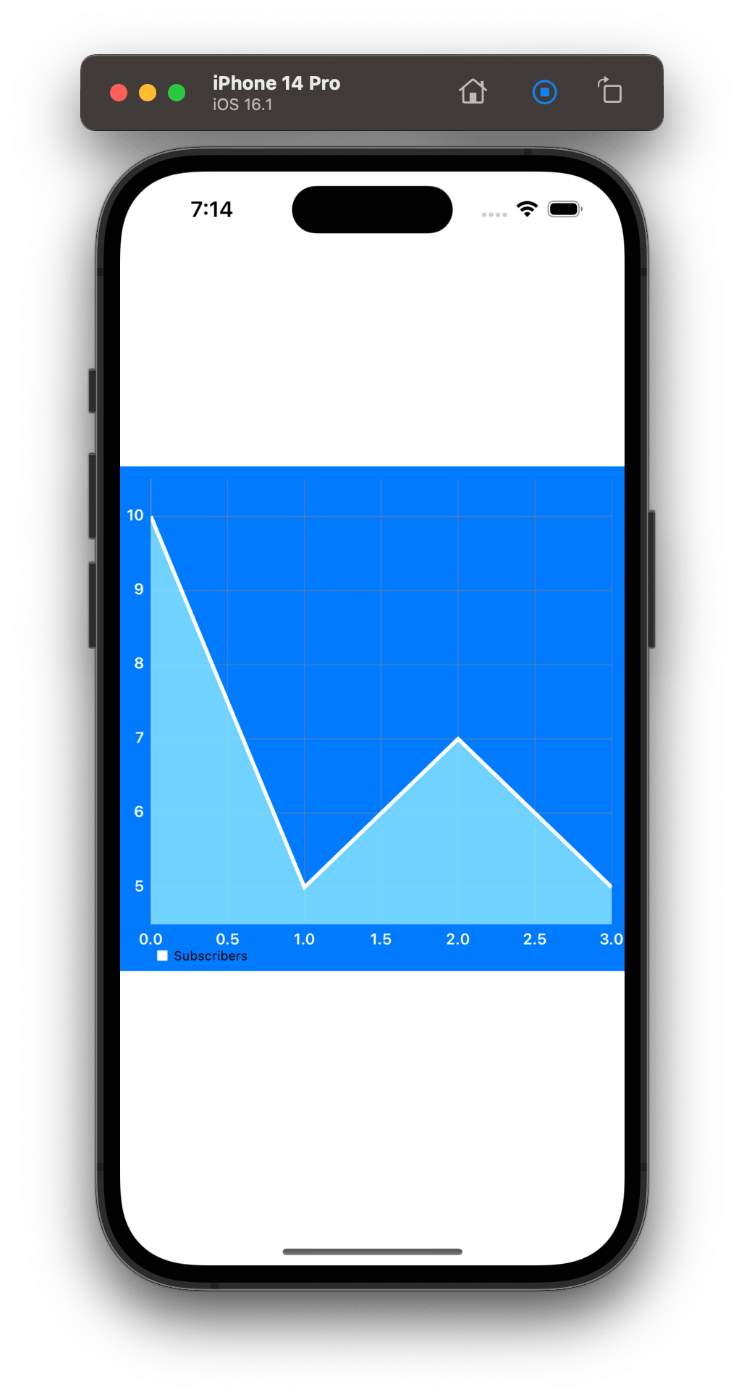
『.mode = .cubicBezier』と書かないと
グラフの線が直線で表示されます。
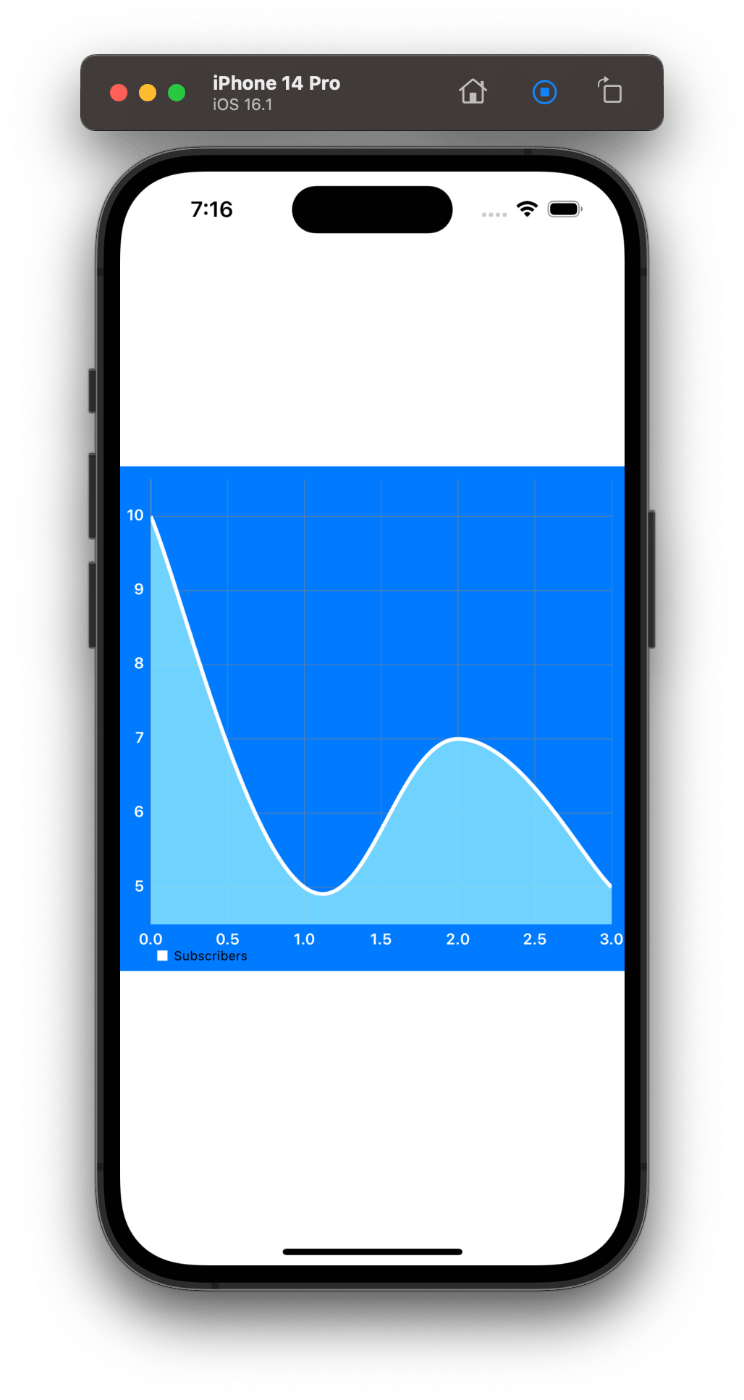
『.mode = .cubicBezier』と書くと
グラフの線が曲線で表示されます。
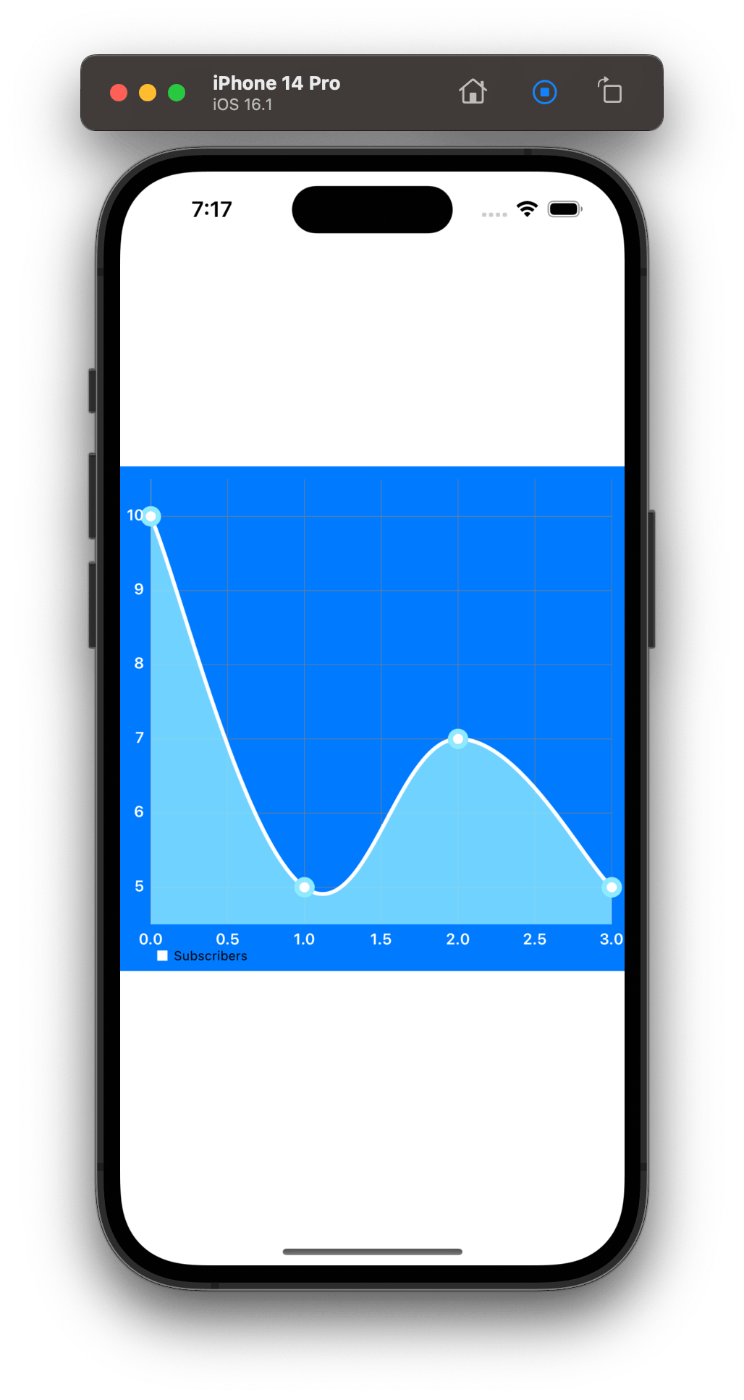
『.drawCirclesEnabled = true』と書くと
グラフの上に丸が表示されるようになります。
『.drawCirclesEnabled = false』と書くと
グラフの上に丸が表示されなくなります。
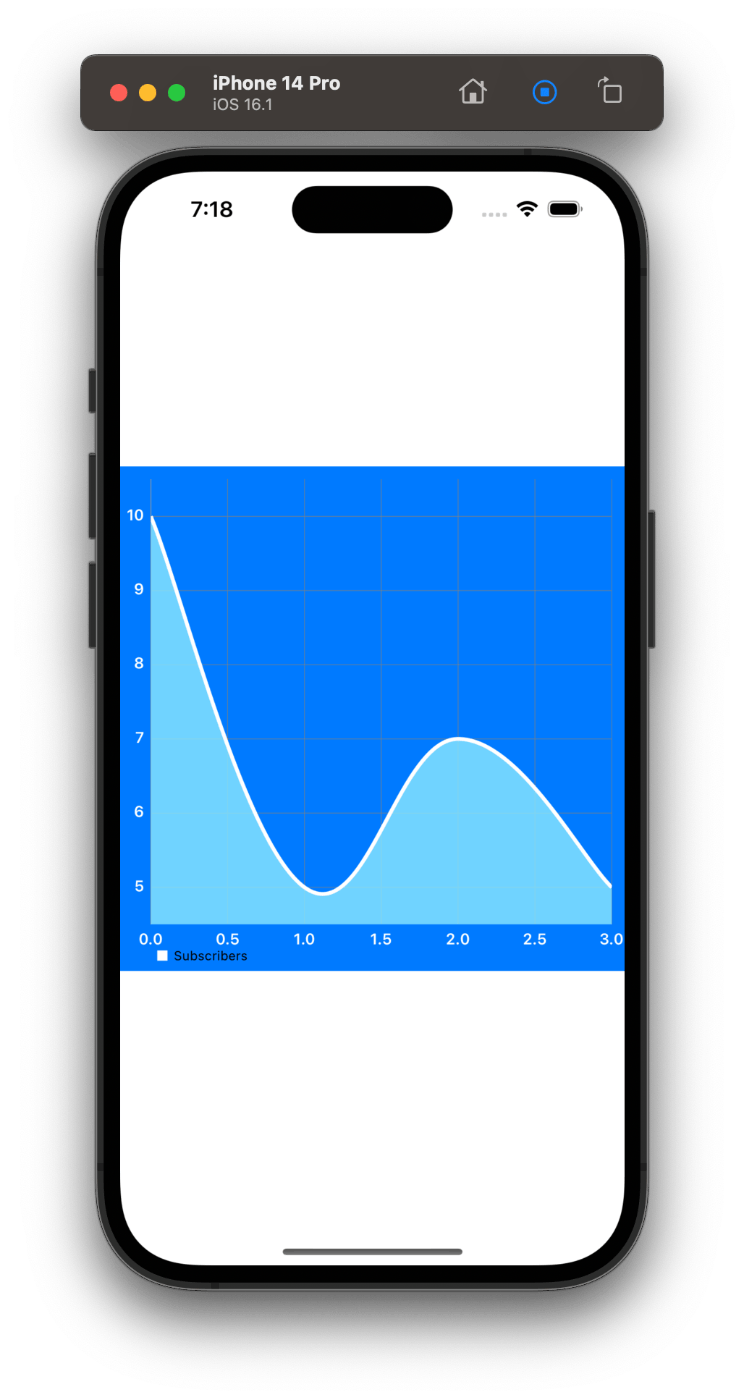
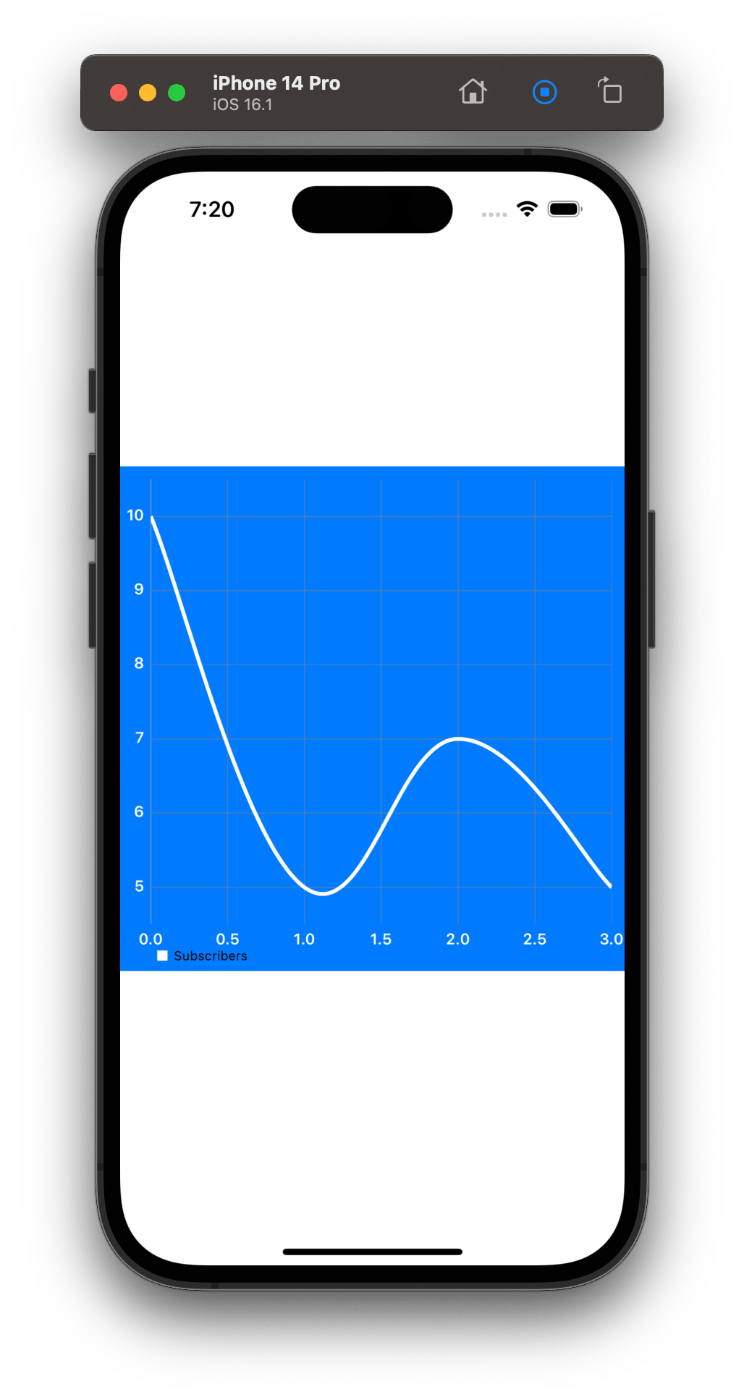
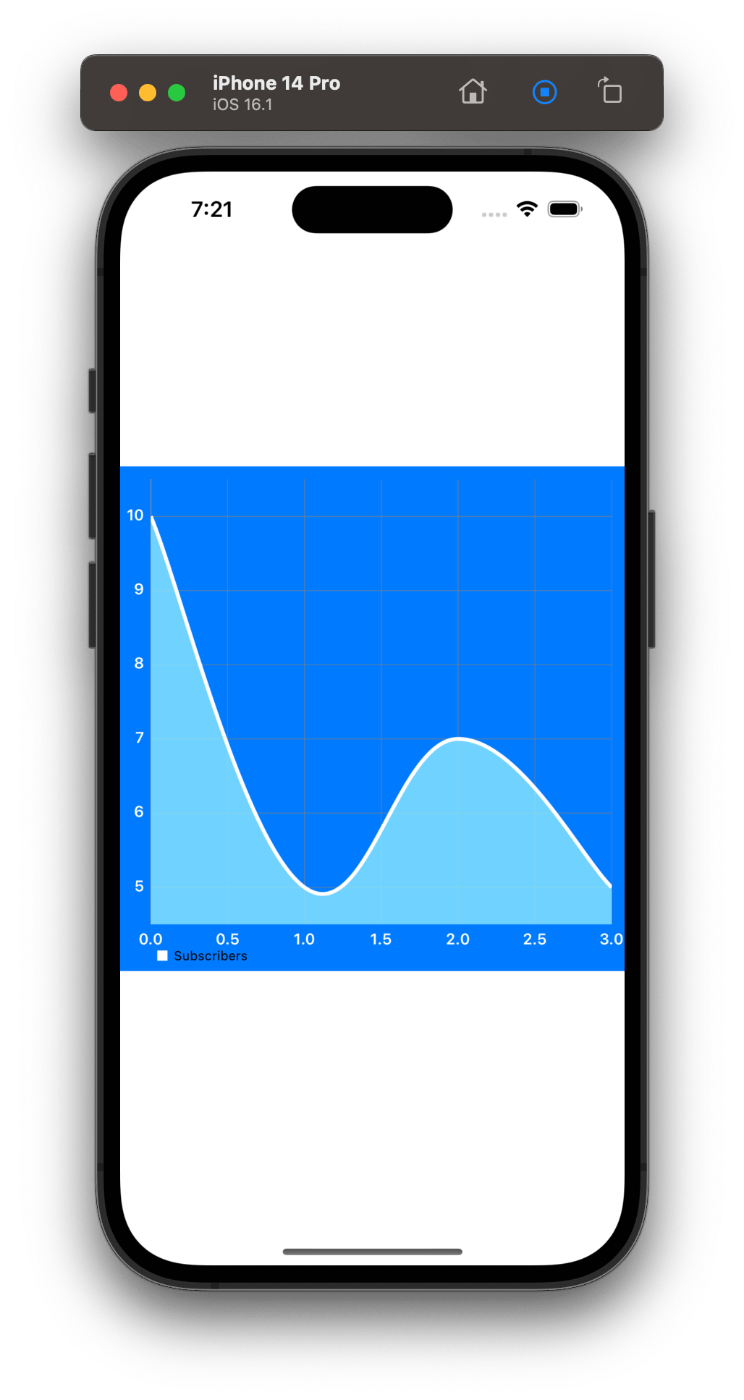
『.drawFilledEnabled = false』と書くと
普通のグラフの線を表示します。
『.drawFilledEnabled = true』と書くと
グラフの線の下の面積も表示します。
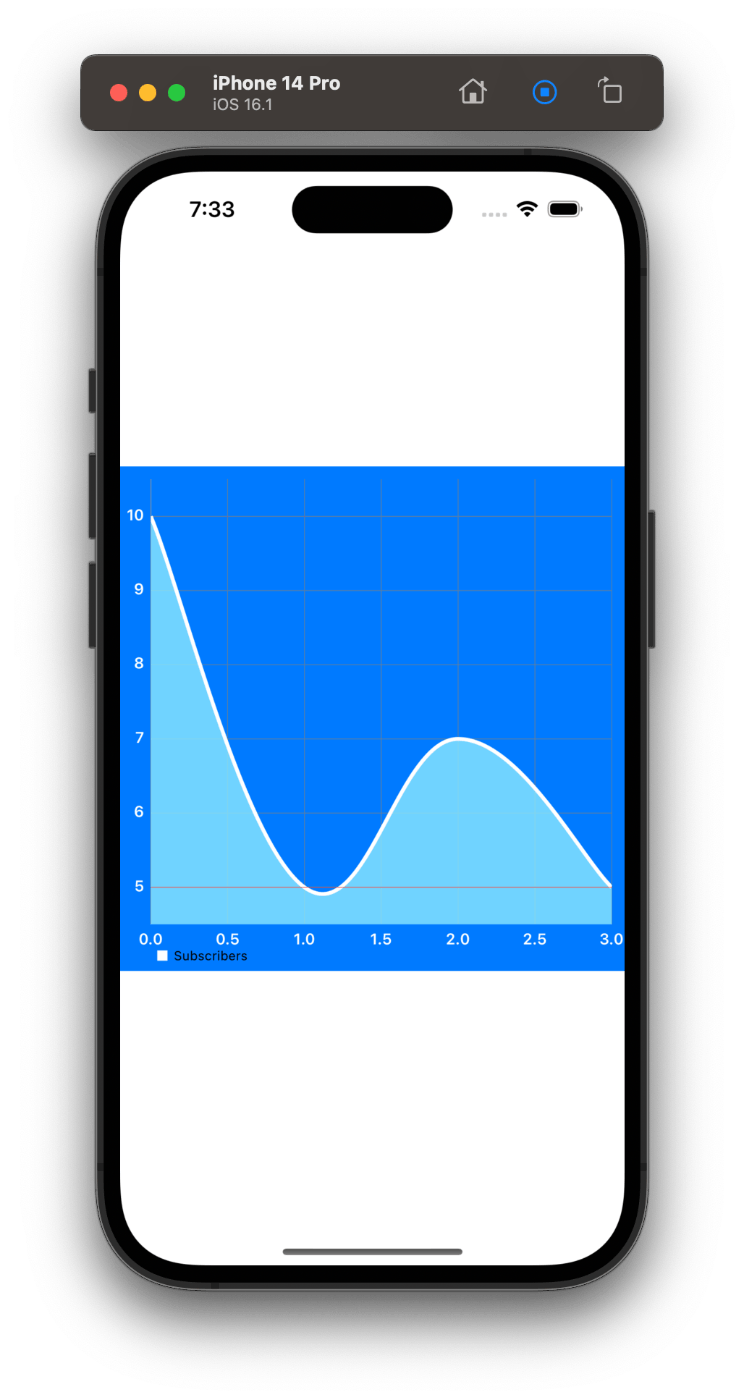
『.drawHorizontalHighlightIndicatorEnabled = true』と書くと
グラフをタップした時に横線が表示されるようになります。
『.drawHorizontalHighlightIndicatorEnabled = false』と書くと
グラフをタップした時に横線が表示されなくなります。
『set1.drawVerticalHighlightIndicatorEnabled = true』と書くと
グラフをタップした時に縦線が表示されるようになくなります。
『set1.drawVerticalHighlightIndicatorEnabled = false』と書くと
グラフをタップした時に縦線が表示されなくなります。
『.animate(xAxisDuration: 数字)』と書くと
グラフにアニメーションが付きます。数字でアニメーションの速度を調整することができます。
【「ViewController」のコード】
import UIKit
import DGCharts
import TinyConstraints

class ViewController: UIViewController,ChartViewDelegate {

    lazy var lineChartView: LineChartView = {
        let chartView = LineChartView()

        chartView.backgroundColor = .systemBlue
        // chartView.rightAxis.enabled = true
        chartView.rightAxis.enabled = false

        let yAxis = chartView.leftAxis
        yAxis.labelFont = .boldSystemFont(ofSize: 12)
        yAxis.setLabelCount(6, force: false)
        yAxis.labelTextColor = .white
        yAxis.axisLineColor = .white
        // 「.insideChart」もあれば「.outsideChart」もある。
        yAxis.labelPosition = .outsideChart
        // 「.bottom」もあれば「bothSided」「bottomInSide」「top」「topInSide」もある。
        chartView.xAxis.labelPosition = .bottom
        chartView.xAxis.labelFont = .boldSystemFont(ofSize: 12)
        chartView.xAxis.setLabelCount(6, force: false)
        chartView.xAxis.labelTextColor = .white
        chartView.xAxis.axisLineColor = .systemBlue

        chartView.animate(xAxisDuration: 2.5)

        return chartView
    }()

    override func viewDidLoad() {
        super.viewDidLoad()

        view.addSubview(lineChartView)
        lineChartView.centerInSuperview()
        lineChartView.width(to: view)
        lineChartView.heightToWidth(of: view)
        setData()
    }

    func chartValueSelected(_ chartView: ChartViewBase, entry: ChartDataEntry, highlight: Highlight) {
        print(entry)
    }
    func setData() {
        let set1 = LineChartDataSet(entries: yValues, label: "Subscribers")
        set1.mode = .cubicBezier
        // set1.drawCirclesEnabled = true
        set1.drawCirclesEnabled = false
        set1.lineWidth = 3
        set1.setColor(.white)
        set1.fillAlpha = 0.8
        // set1.drawFilledEnabled = false
        set1.drawFilledEnabled = true

        // 【横線】
        // set1.drawHorizontalHighlightIndicatorEnabled = true
        set1.drawHorizontalHighlightIndicatorEnabled = false

        // 【縦線】
        // set1.drawVerticalHighlightIndicatorEnabled = true
        set1.drawVerticalHighlightIndicatorEnabled = false

        set1.highlightColor = .systemRed

        let data = LineChartData(dataSet: set1)
        // data.setDrawValues(true)
        data.setDrawValues(false)

        lineChartView.data = data
    }

    let yValues: [ChartDataEntry] = [
        ChartDataEntry(x: 0.0, y: 10.0),
        ChartDataEntry(x: 1.0, y: 5.0),
        ChartDataEntry(x: 2.0, y: 7.0),
        ChartDataEntry(x: 3.0, y: 5.0),
    ]

}
※ 学習していく過程で理解できた内容が増え次第追記していきます。
参考動画
Chart in Swift - Setting Up a Basic Line Chart Using iOS Charts
https://www.youtube.com/watch?v=mWhwe_tLNE8&t=2s
