はじめに
『機械学習のエッセンス(http://isbn.sbcr.jp/93965/)』のPythonサンプルをJuliaで書き換えてみる。(第04章08数理最適化)の続きです。
統計基本量
平均値と標準偏差
x_1, x_2, \cdots , x_n \\
\overline{x} = \frac{1}{n}\sum_{i=1}^n x_i \\
\sigma = \sqrt{\frac{1}{n}\sum_{i=1}^n(x_i - \overline{x})^2}
$\overline{x}$:平均、$\sigma$:標準偏差
fundstats1.jl
using Printf

# 2018年4月の東京の最高気温(日別)
x = [21.9, 24.5, 23.4, 26.2, 15.3, 22.4, 21.8, 16.8,
     19.9, 19.1, 21.9, 25.9, 20.9, 18.8, 22.1, 20.0,
     15.0, 16.0, 22.2, 26.4, 26.0, 28.3, 18.7, 21.3,
     22.5, 25.0, 22.0, 26.1, 25.6, 25.7]

m = sum(x) / length(x)
s = sqrt( sum((x .- m).^2) / length(x) )
println("平均値:$(@sprintf("%.4f", m))")
println("標準偏差:$(@sprintf("%.4f",s))")
実行結果
julia> include("fundstats1.jl")
平均値:22.0567
標準偏差:3.4908
共分散
x = (x_1, x_2,\cdots,x_n)^T \, , y = (y_1, y_2,\cdots,y_n)^T \\
\sigma_{xy} = \frac{1}{n}\sum_{i=1}^{n}(x_i - \overline{x})(y_i - \overline{y}) \\
(\overline{x} = \frac{1}{n}\sum_{i=1}^n x_i , \ \ \overline{y} = \frac{1}{n}\sum_{i=1}^n y_i) \\
$\sigma_{xy}$:共分散、$\frac{\sigma_{xy}}{\sigma_{x}\sigma_{y}}$:相関係数
fundstats2.jl
using Printf

# 2018年4月の東京の最高気温(日別)
x = [21.9, 24.5, 23.4, 26.2, 15.3, 22.4, 21.8, 16.8,
     19.9, 19.1, 21.9, 25.9, 20.9, 18.8, 22.1, 20.0,
     15.0, 16.0, 22.2, 26.4, 26.0, 28.3, 18.7, 21.3,
     22.5, 25.0, 22.0, 26.1, 25.6, 25.7]

# 2018年4月の札幌の最高気温(日別)
y = [8.3, 13.0, 8.4, 7.9, 7.0, 3.7, 6.1, 8.5, 8.6,
     11.9, 12.1, 14.4, 7.0, 10.5, 6.6, 10.6, 16.6,
     19.1, 20.1, 19.8, 24.5, 12.6, 16.4, 13.0, 13.3,
     14.1, 14.4, 17.0, 21.3, 24.5]

mx = sum(x) / length(x)
my = sum(y) / length(y)
sx = sqrt( sum((x .- mx).^2) / length(x) )
sy = sqrt( sum((y .- my).^2) / length(y) )
sxy = sum((x .- mx) .* (y .- my)) / length(x)
println("東京の最高気温の標準偏差:$(@sprintf("%.4f",sx))")
println("札幌の最高気温の標準偏差:$(@sprintf("%.4f",sy))")
println("共分散:$(@sprintf("%.4f",sxy))")
println("相関係数:$(@sprintf("%.4f",sxy / (sx * sy)))")
実行結果
julia> include("fundstats2.jl")
東京の最高気温の標準偏差:3.4908
札幌の最高気温の標準偏差:5.4254
共分散:5.4872
相関係数:0.2897
- 私が持っている本は初版二刷で、実行結果の標準偏差が小数点4桁となっていません。おそらく誤植だと思うのですが、正誤表のページには載っていませんでした。(2019/02/09現在)
正規分布と確率密度関数
Distributionsパッケージのインストール
Juliaで分布に関するパッケージはDistributionsを使います。
julia> using Pkg

julia> Pkg.add("Distributions")
Plotsパッケージのインストール
初めてグラフを描画する場合はPlotsパッケージが必要です。
julia> Pkg.add("Plots")
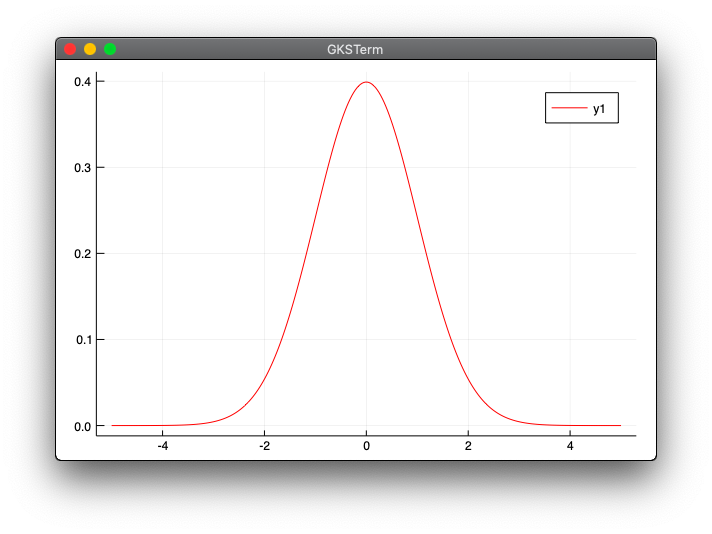
正規分布の確率密度関数
f(x) = \frac{1}{\sqrt{2\pi\sigma}}exp\left\{-\frac{(x-\mu)^2}{2\sigma^2}\right\}
正規分布の確率密度関数はNormal関数とpdf関数を使います。
$\mu=0$、$\sigma=1$を指定しています。
normdist.jl
using Distributions
using Plots

m = Normal(0.0, 1.0)
x = LinRange(-5,5,300)
y = pdf.(m, x)

plot(x, y, color="red")
pdf関数は.(ドット)を付けないとWarning: pdf(d::UnivariateDistribution, X::AbstractArray)is deprecated, usepdf.(d, X) instead.という非推奨である旨の警告がでました。
実行結果
julia> include("normdist.jl")
正規分布の累積分布関数
$f$:確率密度関数
F(x) = \int_{-\infty}^xf(t)dt \\
P(a \lt X \lt b) = F(b) - F(a)
Distributionsパッケージにcdf関数があります。
$\mu=0$、$\sigma=1$
Distributions.cdf関数の実行
julia> using Distributions

julia> d = Normal(0, 1)
Normal{Float64}(μ=0.0, σ=1.0)

julia> cdf(d, 1) - cdf(d, -1)
0.6826894921370861
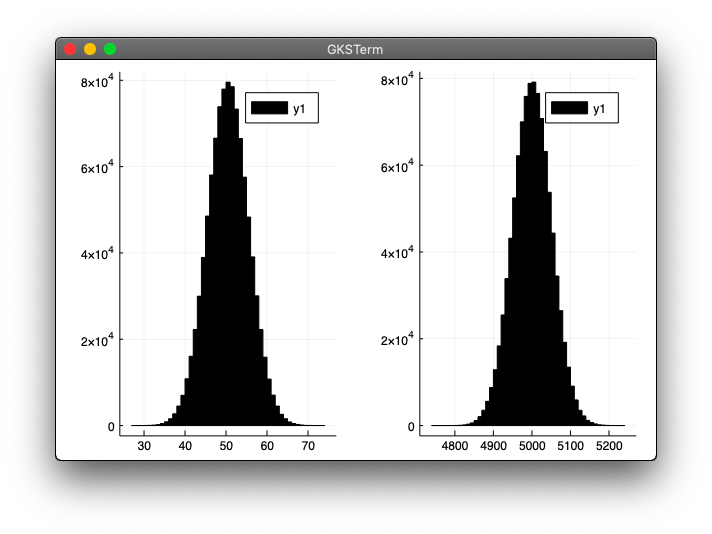
n個のコインを同時に投げて表になったものの数
- 「100個のコインを投げて表の数を数えること」を100万回
- 「10000個のコインを投げて表の数を数えること」を100万回
cointoss.jl
using Random
using Plots

function cointoss(n, m)
  l = []
  for i in 1:m
    r = rand(0:1, n)
    append!(l, sum(r))
  end
  return l
end

Random.seed!(0)

l = cointoss(100, 1000000)
plt1 = histogram(30:70, l, bins=50, color="black")

l = cointoss(10000, 1000000)
plt2 =histogram(4800:5200, l, bins=50, color="black")

plot(plt1, plt2, layout=(1,2))
実行結果
julia> include("cointoss.jl")
Juliaは早いと言っても、さずがに私の古いマシン(MacBook Air (11-inch, Mid 2012))だと数分かかりました。
(追記)
@yatra9 さんからコメントをいただきました。書き方を変えると爆速になります。ぜひコメントをご参照ください。ご教示いただいた書き方に直して計測したら、なんと100倍!くらい高速になりました。
参考にしたサイト
確率変数に関するJuliaの記事でとても詳しいです。
https://qiita.com/sand/items/e4b32f7cfd74dea40298