この記事は、以下の内容の続きです。
●Web Serial API を使って micro:bit からセンサーの値を読み取る(途中段階) - Qiita
https://qiita.com/youtoy/items/9606c58369796a65f8f5
ちなみに、Web Serial API 関連の話は、上記の記事とは別に以下の記事も書いています。
- Web Serial API を最短の手順で試したくてやったこと(micro:bit を利用) - Qiita
- Web Serial API を使った micro:bit への値の書き込み - Qiita
冒頭に記載した記事の内容では、micro:bit から値を読み取れてはいたものの、意図したとおりには読み取れていない問題があったため、それを解決するための対応をしたのがこの記事の内容です。
また、それと合わせて読み取った値のグラフ化も行ってみました。
最終的な完成形は以下となります。
Web Serial API を使った、シリアル通信による値の読み取りができた!
— you (@youtoy) February 9, 2021
micro:bit の加速度センサーの値(XYZ)をブラウザで直接読み取って、3種類の値をそれぞれ別の色に対応づけてリアルタイムにグラフ化。
#IoTLT pic.twitter.com/TEjDV7HTCU
前の記事で発生していた問題を解決する
Webサイト側の内容修正
前の記事で発生していた問題に関し、以下のサイトの情報を見つつ対応しました。
●Read from and write to a serial port
https://web.dev/serial/
以下に、改善後のソースコードを掲載します。
前の記事の内容と差があるところにコメントを入れました。
<!DOCTYPE html>
<html>
  <head>
    <meta charset="utf-8" />
    <meta name="viewport" content="width=device-width, initial-scale=1" />
    <title>Web Serial(Read)</title>
  </head>

  <body>
    <h1>Web Serial(Read)</h1>
    <button onclick="onStartButtonClick()">接続</button>

    <script>
      // ▼追加した部分1
      class LineBreakTransformer {
          constructor() {
            this.chunks = "";
          }

          transform(chunk, controller) {
            this.chunks += chunk;
            const lines = this.chunks.split("\r\n");
            this.chunks = lines.pop();
            lines.forEach((line) => controller.enqueue(line));
          }

          flush(controller) {
            controller.enqueue(this.chunks);
          }
      }

      async function onStartButtonClick() {
        try {
          const port = await navigator.serial.requestPort();
          await port.open({ baudRate: 115200 });

          while (port.readable) {
            // ▼追加した部分2
            const textDecoder = new TextDecoderStream();
            const readableStreamClosed = port.readable.pipeTo(textDecoder.writable);
            const reader = textDecoder.readable
            .pipeThrough(new TransformStream(new LineBreakTransformer()))
            .getReader();

            try {
              while (true) {
                const { value, done } = await reader.read();
                if (done) {
                  console.log("Canceled");
                  break;
                }
                // ▼ここでデコードの処理をしていたのを削除
                console.log(value);
              }
            } catch (error) {
              console.log("Error: Read");
              console.log(error);
            } finally {
              reader.releaseLock();
            }
          }
        } catch (error) {
          console.log("Error: Open");
          console.log(error);
        }
      }
    </script>
  </body>
</html>
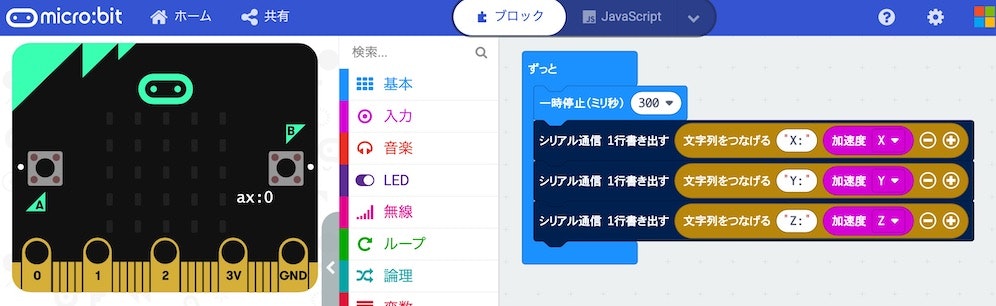
micro:bit のプログラム(少し手を加えてみる)
micro:bit のプログラムは前回と同じものでも良かったのですが、加速度センサーの値を XYZ の 3種類全て書きだすように変えてみました。
プログラムを実行してみる
シリアル通信で読み出された値は、コンソールに以下のように出力されました。
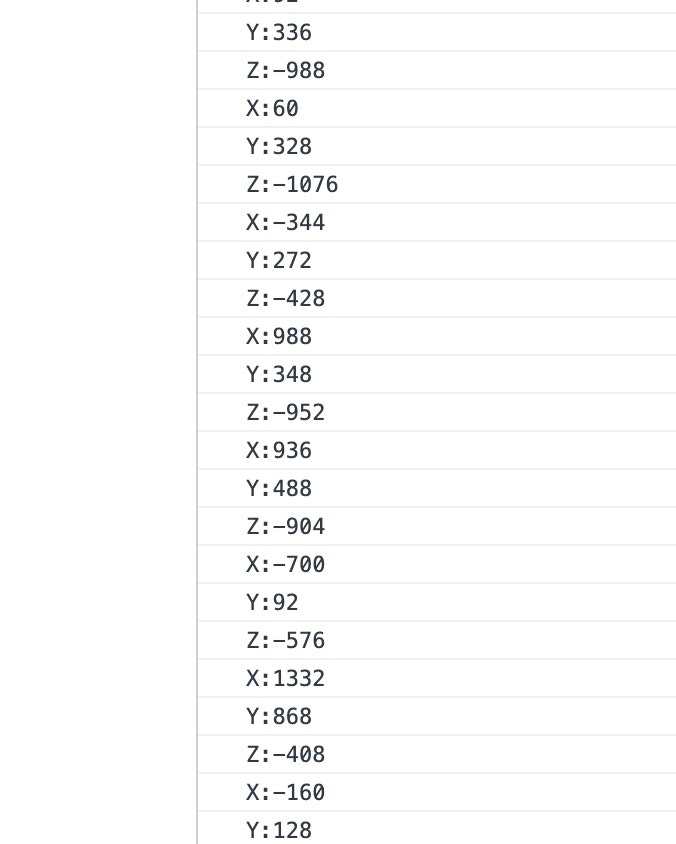
micro:bit側で 1行ずつ書きだした内容が、読み取り側でも 1行ずつ表示されるようになりました。
センサーの値をグラフ化
以前、以下の記事を書いた際に使った Chart.js とプラグインを使い、加速度センサーの値をグラフ化してみます。
●【JavaScript 2020】 MQTT で受信したデータを Smoothie Charts(smoothie.js)以外でリアルタイムにグラフ化: Chart.js とプラグインを利用 - Qiita
https://qiita.com/youtoy/items/252f255c9d794bf3d964
ソースコードと実行結果
グラフ化のための処理を加えたソースコードは以下のとおりです。
<!DOCTYPE html>
<html>
  <head>
    <meta charset="utf-8" />
    <meta name="viewport" content="width=device-width, initial-scale=1" />
    <title>Web Serial(グラフ化)</title>
    <script src="https://cdnjs.cloudflare.com/ajax/libs/moment.js/2.29.1/moment-with-locales.min.js"></script>
    <script src="https://cdn.jsdelivr.net/npm/chart.js@2.8.0"></script>
    <script src="https://cdn.jsdelivr.net/npm/chartjs-plugin-streaming@1.8.0/dist/chartjs-plugin-streaming.min.js"></script>
  </head>

  <body>
    <h1>Web Serial(グラフ化)</h1>
    <button onclick="onStartButtonClick()">接続</button>
    <br>
    <canvas id="myChart"></canvas>

    <script>
      class LineBreakTransformer {
          constructor() {
            this.chunks = "";
          }

          transform(chunk, controller) {
            this.chunks += chunk;
            const lines = this.chunks.split("\r\n");
            this.chunks = lines.pop();
            lines.forEach((line) => controller.enqueue(line));
          }

          flush(controller) {
            controller.enqueue(this.chunks);
          }
      }

      const ctx = document.getElementById("myChart").getContext("2d");

      let chart = new Chart(ctx, {
        type: "line",
        data: {
          datasets: [
            {
              label: 'X',
              borderColor: 'rgb(200, 50, 50)',
              backgroundColor: 'rgba(200, 50, 50, 0.2)',
              data: [],
            },
            {
              label: 'Y',
              borderColor: 'rgb(50, 50, 200)',
              backgroundColor: 'rgba(50, 50, 200, 0.2)',
              data: [],
            },
            {
              label: 'Z',
              borderColor: 'rgb(50, 200, 50)',
              backgroundColor: 'rgba(50, 200, 50, 0.2)',
              data: [],
            },
          ],
        },
        options: {
          scales: {
            xAxes: [
              {
                type: "realtime",
                realtime: {
                  delay: 500,
                },
              },
            ],
          },
        },
      });

      async function onStartButtonClick() {
        try {
          const port = await navigator.serial.requestPort();
          await port.open({ baudRate: 115200 });

          while (port.readable) {
            const textDecoder = new TextDecoderStream();
            const readableStreamClosed = port.readable.pipeTo(textDecoder.writable);
            const reader = textDecoder.readable
            .pipeThrough(new TransformStream(new LineBreakTransformer()))
            .getReader();

            try {
              while (true) {
                const { value, done } = await reader.read();
                if (done) {
                  console.log("Canceled");
                  break;
                }
                console.log(value);

                if(value.slice(0,1)==="X") {
                  chart.data.datasets[0].data.push({
                    x: Date.now(),
                    y: value.slice(2),
                  });
                } else if(value.slice(0,1)==="Y") {
                  chart.data.datasets[1].data.push({
                    x: Date.now(),
                    y: value.slice(2),
                  });
                } else if(value.slice(0,1)==="Z") {
                  chart.data.datasets[2].data.push({
                    x: Date.now(),
                    y: value.slice(2),
                  });
                }
                chart.update({
                  preservation: true,
                });
              }
            } catch (error) {
              console.log("Error: Read");
              console.log(error);
            } finally {
              reader.releaseLock();
            }
          }
        } catch (error) {
          console.log("Error: Open");
          console.log(error);
        }
      }
    </script>
  </body>
</html>
このグラフ化の処理を加えたものを実行すると、冒頭に掲載した動画のようなグラフ化が行えます。
このように、Web Serial API を使って micro:bit からセンサーの値を読み取り、それを Webサイト上でリアルタイムにグラフ化することができました。
追記
ソースコードなどは以下の GitHub にも置きました。
https://github.com/yo-to/WebSeriaAPI/tree/main/examples/02_read_microbit_and_graph_drawing