はじめに
GCPがPreview版として提供している「Google Cloud Managed Service for Prometheus」に関する簡単なまとめになります。
##Prometheusを運用する上での課題
Prometheusのアーキテクチャと基本機能
Prometheusのアーキテクチャの全体図が以下になります。
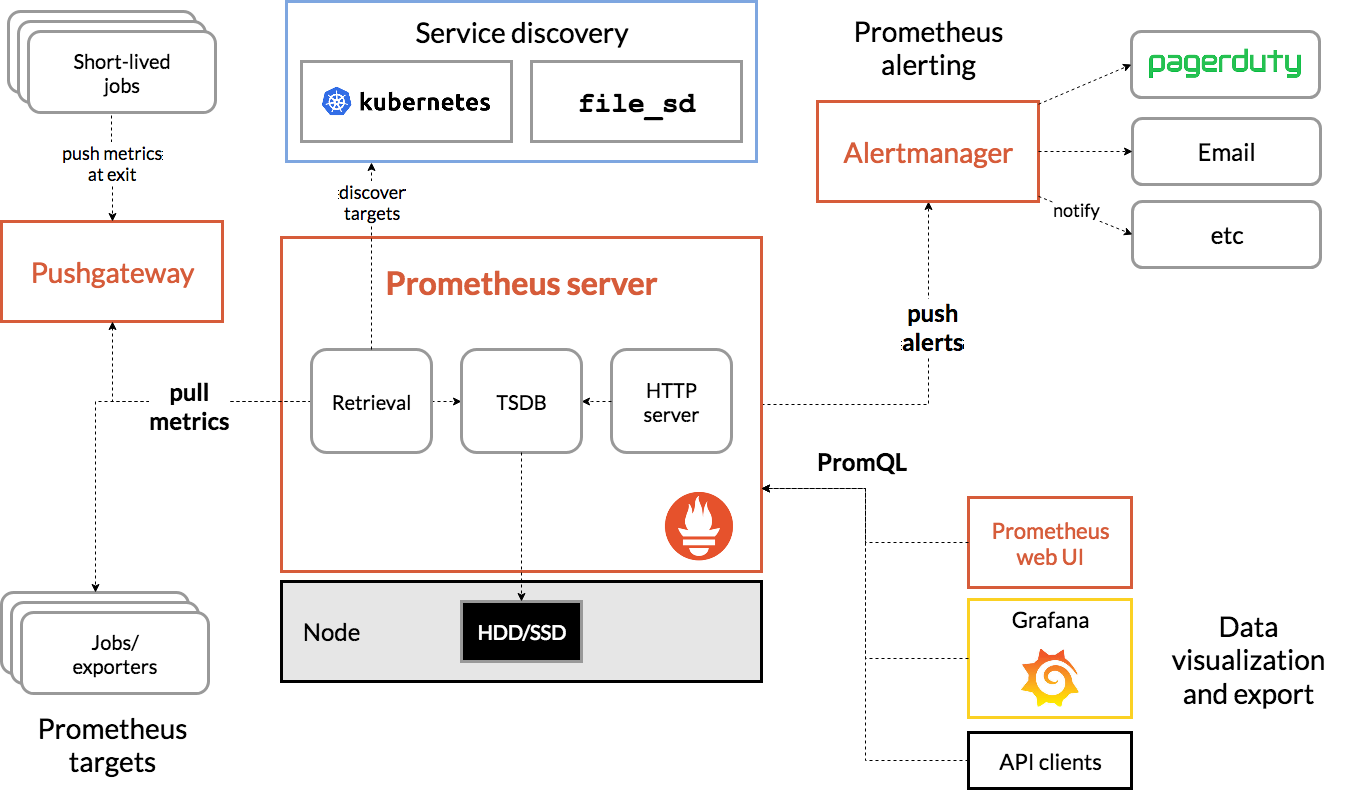
参考:https://prometheus.io/docs/introduction/overview/
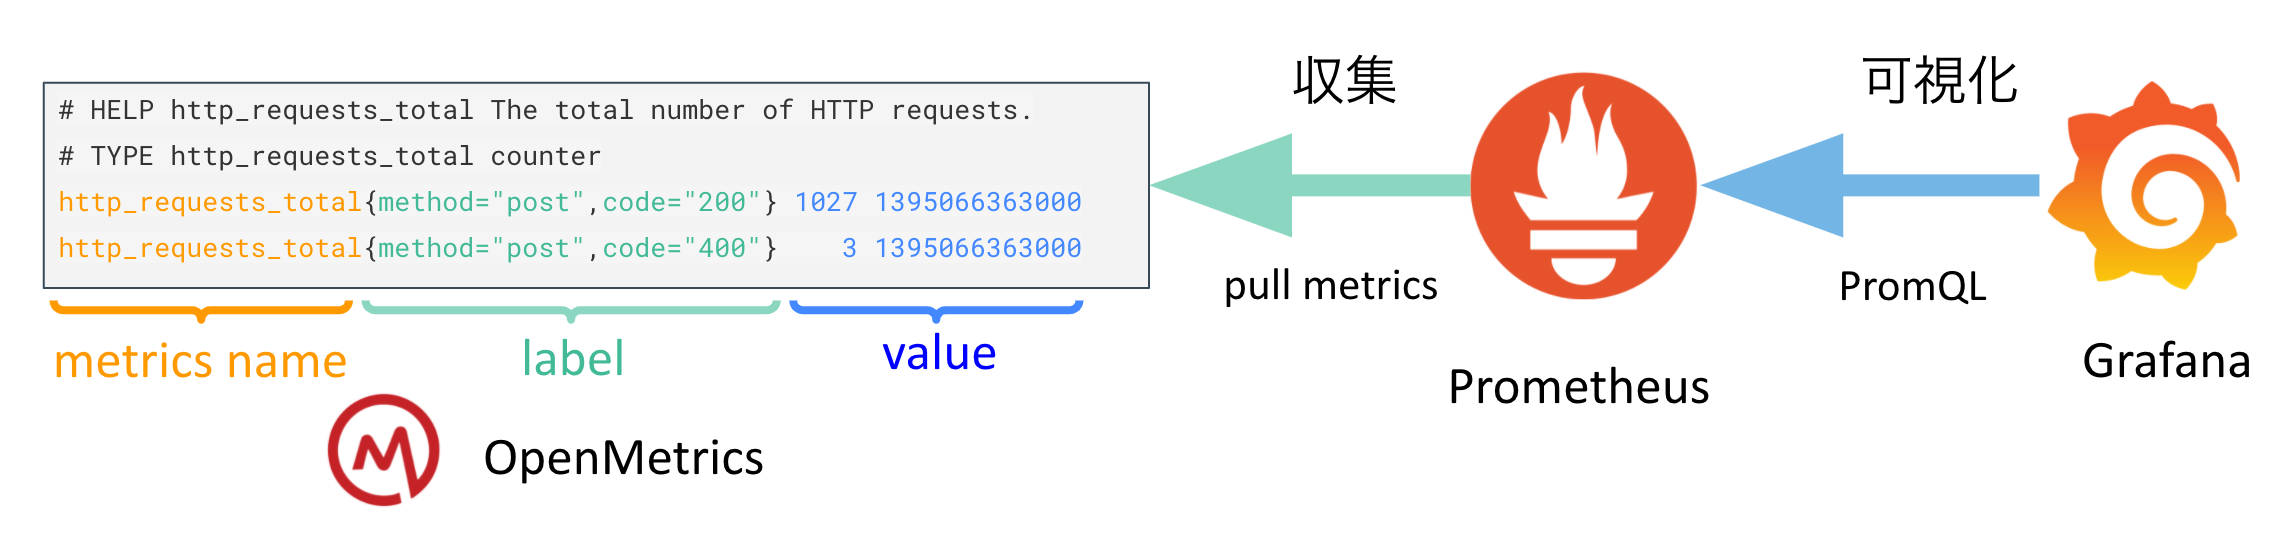
このままで、少しわかりにくいのでメトリクスを収集してからGrafanaで可視化するまでの流れを簡略化した図が以下になります。
よくあるPrometheusの運用上の課題
-
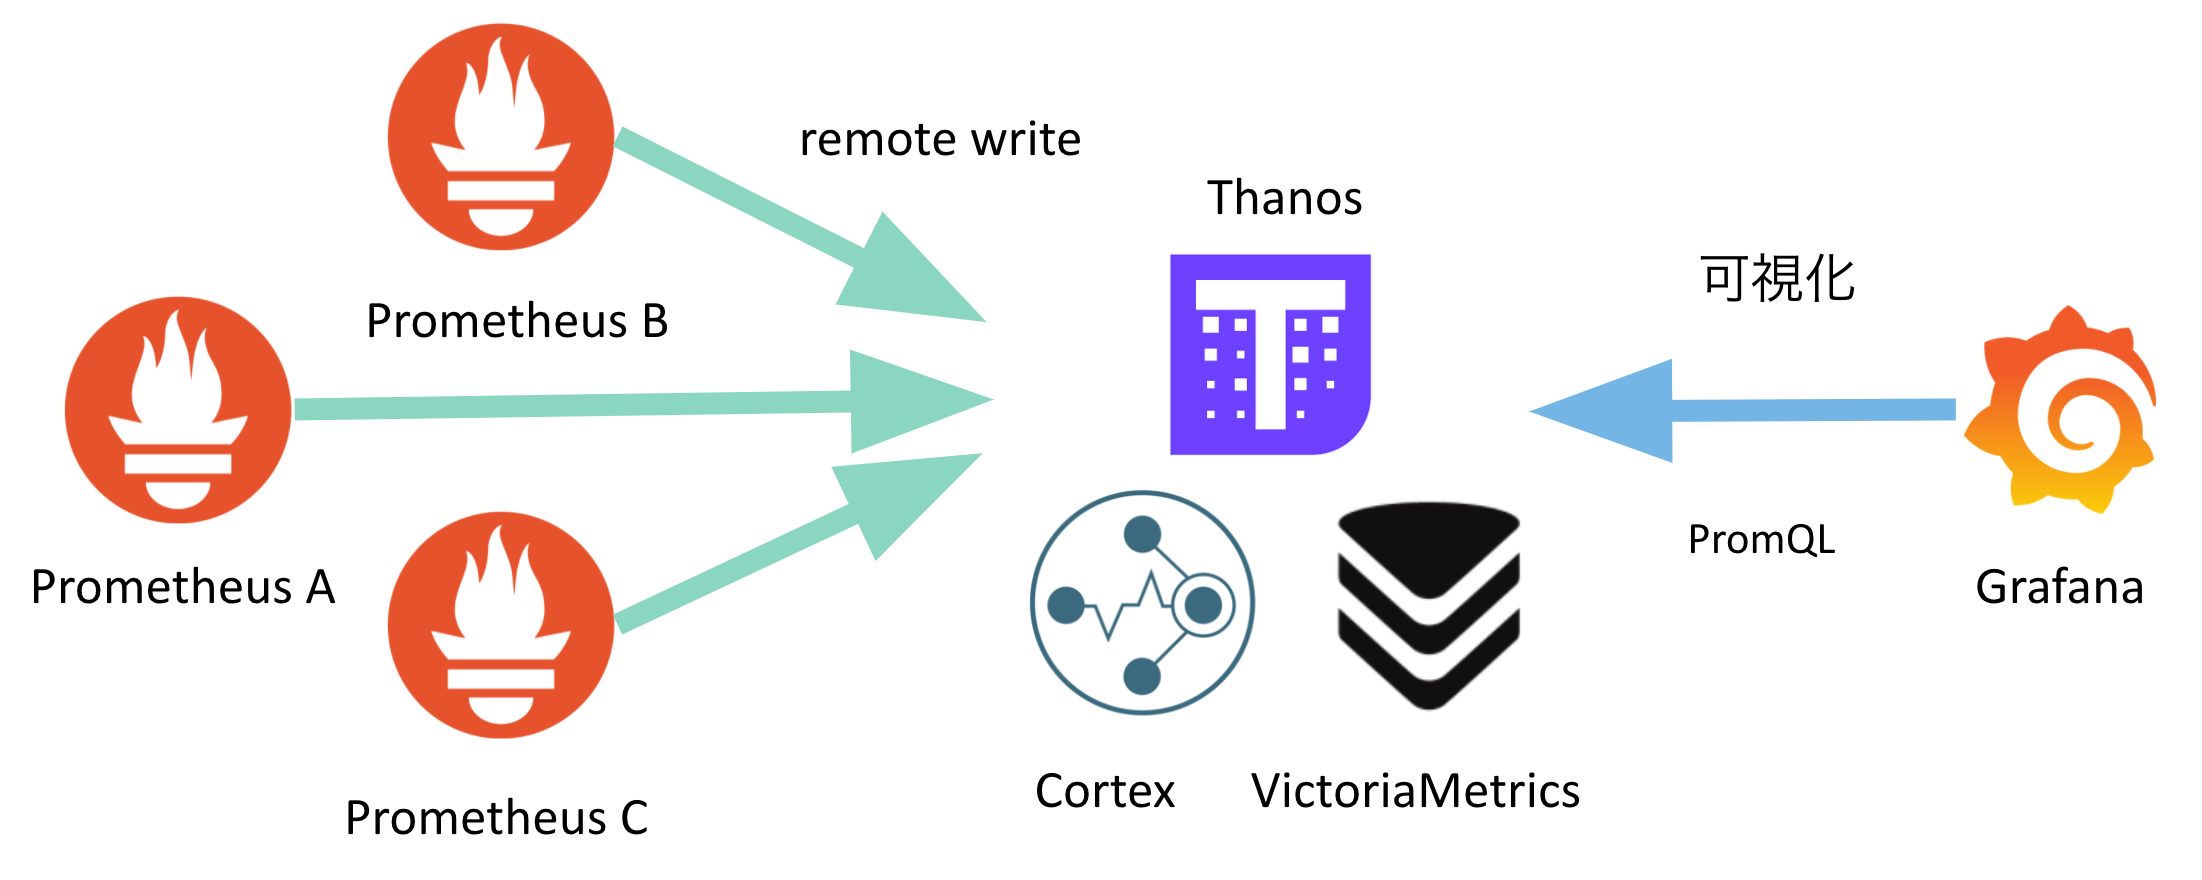
Global View
1個あたりのPrometheusのスクレプの性能限界等により、複数のPrometheusを運用することになったので、複数のPrometheusを横断してクエリを実行したい -
Long Term
Prometheusのメトリクスを1ヶ月や1年等の長期で保管したいが、1個あたりのPrometheusでは性能限界が来ていて難しいので解決したい
これらの課題を解決するために、PrometheusのRemote Write機能でThird-partyプロダクトにデータを書き出し、そちらに対してGrafanaで可視化するような対処を実施することが多いです。
Third-partyプロダクトの運用が辛い
Third-partyプロダクトを使って課題を解決する場合は、その運用そのものが辛いという課題があります。以下はCortexのアーキテクチャになります。見てわかる通り複雑です。水平スケールできるような構成をプロダクトが多いのですが、蓄積されるデータ量に応じてスケールしたり、日々の運用がそれなりのコストになります。
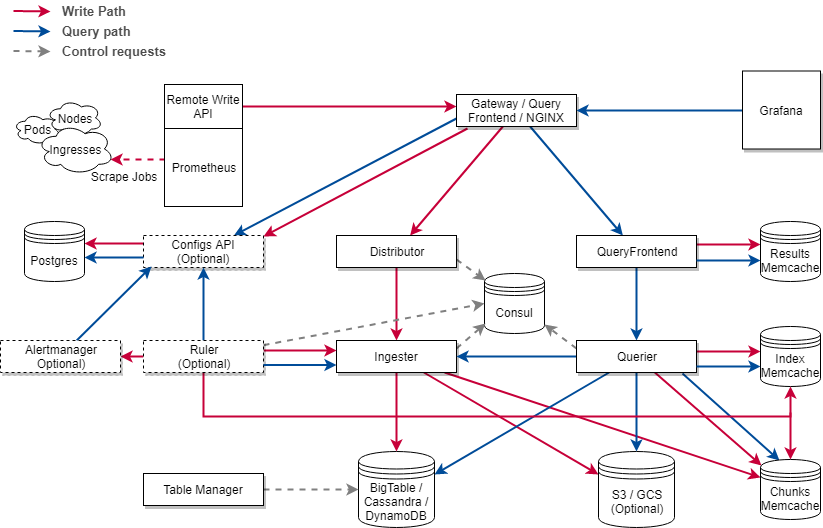
参考:https://cortexmetrics.io/docs/architecture/
Google Cloud Managed Service for Prometheusについて
アーキテクチャ
アーキテクチャは公式ドキュメントによると以下のように記載されてます。
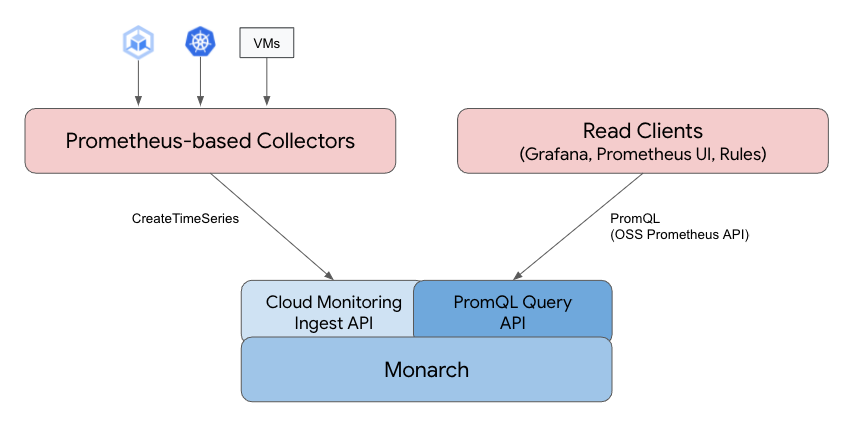
参考:https://cloud.google.com/stackdriver/docs/managed-prometheus
Monarchに対してPrometheusのメトリクスを蓄積する機能とPromQLを話せるようにAPIを追加したというのが、今回提供された機能にみえます。
多くのThird-partyプロダクトがPrometheusの互換性を保つ形で新規でプロダクトを作っているのに対して、既に運用実績があるMonarchにPrometheusの互換性を追加する形になっているのが特徴的です。
Monarchとは
Monarch is a globally-distributed in-memory time series database system in Google.
MonarchはGoogleで運用されているグローバルに分散されたインメモリの時系列DBになります。
使い方
こちらは公式サイトのGet started with managed collectionの内容と同じなのですが、これだけだと日本語になってるくらいしか付加価値がないので確認した時の気づきを追加してます。
Prometheus-based Collectorsのセットアップ
- CRDのデプロイ
operatorが使用するCRDを事前にデプロイします。
$ kubectl apply -f https://raw.githubusercontent.com/GoogleCloudPlatform/prometheus-engine/v0.1.1/examples/setup.yaml
customresourcedefinition.apiextensions.k8s.io/podmonitorings.monitoring.googleapis.com created
customresourcedefinition.apiextensions.k8s.io/rules.monitoring.googleapis.com created
customresourcedefinition.apiextensions.k8s.io/clusterrules.monitoring.googleapis.com created
customresourcedefinition.apiextensions.k8s.io/operatorconfigs.monitoring.googleapis.com created
- Operatorのデプロイ
公式の図のPrometheus-based Collectorsに該当する部分をデプロイします。
$ kubectl apply -f https://raw.githubusercontent.com/GoogleCloudPlatform/prometheus-engine/v0.1.1/examples/operator.yaml
namespace/gmp-system created
namespace/gmp-public created
priorityclass.scheduling.k8s.io/gmp-critical created
serviceaccount/operator created
serviceaccount/collector created
clusterrole.rbac.authorization.k8s.io/gmp-system:collector created
clusterrole.rbac.authorization.k8s.io/gmp-system:operator created
clusterrole.rbac.authorization.k8s.io/gmp-system:csr-approver created
clusterrolebinding.rbac.authorization.k8s.io/gmp-system:operator created
clusterrolebinding.rbac.authorization.k8s.io/gmp-system:operator-csr created
clusterrolebinding.rbac.authorization.k8s.io/gmp-system:collector created
deployment.apps/gmp-operator created
service/gmp-operator created
- デプロイ後のpodの確認
$ kubectl get -n gmp-system deploy,po
NAME                             READY   UP-TO-DATE   AVAILABLE   AGE
deployment.apps/gmp-operator     1/1     1            1           12h
deployment.apps/rule-evaluator   1/1     1            1           12h

NAME                                  READY   STATUS    RESTARTS      AGE
pod/collector-6k9v5                   2/2     Running   1 (12h ago)   12h
pod/collector-89phz                   2/2     Running   1 (12h ago)   12h
pod/collector-h45q2                   2/2     Running   1 (12h ago)   12h
pod/gmp-operator-5c7f6f5dcb-ndgbj     1/1     Running   0             12h
pod/rule-evaluator-7dd659b4fd-gkq5x   2/2     Running   1 (12h ago)   12h
collector,gmp-operator,rule-evaluatorの3種類のコンポーネントがあることがわかります。
collectorに対応するDeploymentのリソースもないので、このコンポーネントをgmp-operatorを管理しているように見えます。
-
collectorの確認
$ kubectl get -n gmp-system po collector-6k9v5 -o yaml
apiVersion: v1
kind: Pod
   :
  containers:
  - args:
    - --config.file=/prometheus/config_out/config.yaml
    - --storage.tsdb.path=/prometheus/data
    - --storage.tsdb.no-lockfile
+    - --storage.tsdb.retention.time=30m
    - --storage.tsdb.wal-compression
    - --storage.tsdb.min-block-duration=10m
    - --storage.tsdb.max-block-duration=10m
    - --web.listen-address=:19090
    - --web.enable-lifecycle
    - --web.route-prefix=/
+    - --export.label.project-id=<project-id>
+    - --export.label.cluster=<cluster名>
    env:
    - name: GOGC
      value: "25"
+    image: gke.gcr.io/prometheus-engine/prometheus:v2.28.1-gmp.1-gke.1
   :
  - args:
    - --config-file=/prometheus/config/config.yaml
    - --config-file-output=/prometheus/config_out/config.yaml
+    - --reload-url=http://localhost:19090/-/reload
    - --listen-address=:19091
    :
+    image: gke.gcr.io/prometheus-engine/config-reloader:v0.1.1-gke.0
    :
prometheus:v2.28.1-gmp.1-gke.1が恐らくPrometheusベースで作られたもので、これがメトリクスを収集してCloud Monitoring Ingest APIにデータを送っていると思います。Prometheus関連のプロダクトはprometheus/busyboxをベースイメージにして作られているものが多いのですが、これをDistrolessに変えて、Googleの環境でビルドししたり、その他の変更がいくつか加わっているものにみえます。
イメージ名とかargsの値をみた限りprometheus:v2.28.1-gmp.1-gke.1がremote write機能を使用していて、Cloud Monitoring Ingest APIがremote writeで受けたデータをMonarchにデータを書き込んでくれるコンポーネントに見えますが、詳細はわからないです。
複数のGKEクラスタからメトリクスを収集するとクラスタを識別するものが必要になりますが、argsを見ると--export.labelで<project-id>と<cluster名>があるので、このタイミングでメトリクスにラベルを付与してるようです。Cloud Monitoring Ingest APIのエンドポイントがproject-id単位で存在していて共通なので、クラスタを識別できる情報をこのタイミングで付与しているようにみえます。
config-reloader:v0.1.1-gke.0は定期的にPrometheusのrelodのエンドポイントを叩いてるものですね。これがあるので、設定ファイルをConfigMapで作成してPodにマウントした結果が、prometheus:v2.28.1-gmp.1-gke.1に反映されるようになります。
retentionが30mと短く設定されているので、Cloud Monitoring Ingest APIに対してremote writeで書き込むだけのPrometheusだろうと思います。retentionの短いスクレイプ専用のPrometheusを用意するのはよくみる形なのでが、Prometheusのv2.32.0から追加されたAgent Modeがこの用途には合ってるように感じるので、v2.32.0以降に対応した際には対応するかもしれないなと思いました。
-
gmp-operatorの確認
$ kubectl get po -n gmp-system gmp-operator-5c7f6f5dcb-ndgbj -o yaml
apiVersion: v1
kind: Pod
  :
spec:
  containers:
  - args:
    - --ca-selfsign=false
    - --public-namespace=gmp-public
    - --priority-class=gmp-critical
+    - --image-collector=gke.gcr.io/prometheus-engine/prometheus:v2.28.1-gmp.1-gke.1
+    - --image-config-reloader=gke.gcr.io/prometheus-engine/config-reloader:v0.1.1-gke.0
+    - --image-rule-evaluator=gke.gcr.io/prometheus-engine/rule-evaluator:v0.1.1-gke.0
+    image: gke.gcr.io/prometheus-engine/operator:v0.1.1-gke.0
  :
gmp-operatorで管理しているコンテナのイメージはここのargsで指定されてるようです。
なので今後アップデートをしていく際にはoperator:v0.1.1-gke.0のタグを変えてgmp-operatorをアップデートしていくのと、argsの--image-xxxで指定しているイメージのタグを変えてくことでアップデートしていく形になると思います。
-
rule-evaluatorの確認
$ kubectl get -n gmp-system po rule-evaluator-7dd659b4fd-gkq5x -o yaml
apiVersion: v1
kind: Pod
  :
  - args:
    - --config.file=/prometheus/config_out/config.yaml
    - --web.listen-address=:19092
+    - --export.label.project-id=<project-id>
+    - --export.label.cluster=<cluster名>
+    image: gke.gcr.io/prometheus-engine/rule-evaluator:v0.1.1-gke.0
  :
  - args:
    - --config-file=/prometheus/config/config.yaml
    - --config-file-output=/prometheus/config_out/config.yaml
    - --watched-dir=/etc/rules
    - --watched-dir=/etc/secrets
+    - --reload-url=http://localhost:19092/-/reload
    - --listen-address=:19093
+    image: gke.gcr.io/prometheus-engine/config-reloader:v0.1.1-gke.0
collectorとかなり似てるかなと思います。コンポーネントの名前通り、ルールの評価を行う専門のコンポーネントみたいです。こちらを使うことでAlertManagerに対して通知できるようになります。
AlertManagerと連携させるためには、自分でAlertManagerをクラスタ内にデプロイして以下のリソースに対して、AlertManagerに繋がるServiceの情報を追加する必要があります。
$ kubectl -n gmp-public edit operatorconfig config
apiVersion: monitoring.googleapis.com/v1alpha1
kind: OperatorConfig
metadata:
  namespace: gmp-public
  name: config
rules:
  alerting:
    alertmanagers:
+    - name: SERVICE_NAME
+      namespace: SERVICE_NAMESPACE
+      port: PORT_NAME
各クラスタ内で設定が完結するため、この機能を使って複数クラスタのアラートの設定を設定を一元管理するのは難しそうです。
CRDの方を直接見ても、そういうことができそうな設定はなさそうにみえました。
% kubectl get crd operatorconfigs.monitoring.googleapis.com -o yaml
apiVersion: apiextensions.k8s.io/v1
kind: CustomResourceDefinition
   :
          rules:
            description: Rules specifies how the operator configures and deployes
              rule-evaluator.
            properties:
              alerting:
                description: Alerting contains how the rule-evaluator configures alerting.
                properties:
                  alertmanagers:
                    description: Alertmanagers contains endpoint configuration for
                      designated Alertmanagers.
                    items:
                      description: AlertmanagerEndpoints defines a selection of a
                        single Endpoints object containing alertmanager IPs to fire
                        alerts against.
                      properties:
   :
+                        name:
                          description: Name of Endpoints object in Namespace.
                          type: string
+                        namespace:
                          description: Namespace of Endpoints object.
                          type: string
                        pathPrefix:
                          description: Prefix for the HTTP path alerts are pushed
                            to.
                          type: string
+                        port:
                          anyOf:
                          - type: integer
                          - type: string
                          description: Port the Alertmanager API is exposed on.
                          x-kubernetes-int-or-string: true
+                        scheme:
                          description: Scheme to use when firing alerts.
                          type: string
+                        timeout:
                          description: Timeout is a per-target Alertmanager timeout
                            when pushing alerts.
                          type: string
                        tls:
もし複数クラスタを跨いでのアラートの設定を一元管理したい場合は、Grafanaの8.3.0でデフォルトで有効化されるようになったUnified Alertingを使うと良いかなと思います。
Google Cloud Managed Service for Prometheus側には各クラスタの集約して保存されており、そちらに対してPromQLを実行できるのでGrafanaでアラートの設定をまとめて管理できるかと思います。通知先のSlackの設定をクラスタ単位のする必要がなくなったりするので、そのあたりはメリットになると思います。
Grafanaの8.2.0からUnified AlertingがGrafana HA対応したようなので、今までGrafanaにアラートの機能を任せる時に懸念だった可用性の面でもよくなってるかと思います。
Unified Alertingの設定についてはこちらにあるので、ha_のプレフィックスがついた設定のところに対応すれば可用性についてもよくなるかなと思います。
サンプルアプリケーションのデプロイとメトリクスの収集
- namespaceの作成
$ kubectl create ns gmp-test
namespace/gmp-test created
- サンプルのアプリケーションのデプロイ
$ kubectl -n gmp-test apply -f https://raw.githubusercontent.com/GoogleCloudPlatform/prometheus-engine/v0.1.1/examples/example-app.yaml
deployment.apps/prom-example created
- サンプルアプリのスクレイプ用の
monitoring.googleapis.com/v1alpha1のデプロイ
$ kubectl -n gmp-test apply -f https://raw.githubusercontent.com/GoogleCloudPlatform/prometheus-engine/v0.1.1/examples/pod-monitoring.yaml
podmonitoring.monitoring.googleapis.com/prom-example created
サンプルのmonitoring.googleapis.com/v1alpha1は以下のようになっています。
apiVersion: monitoring.googleapis.com/v1alpha1
kind: PodMonitoring
metadata:
  name: prom-example
spec:
  selector:
    matchLabels:
      app: prom-example
  endpoints:
  - port: metrics
    interval: 30s
参考:https://cloud.google.com/stackdriver/docs/managed-prometheus/setup-managed
スクレプ対象はlabelで指定して、portと監視間隔(interval)を指定する形ですね。
これを見てると、pathの扱いはどうなっているのか疑問に思うと思いますが、CRDの内容を確認するとわかります。
$ kubectl get crd podmonitorings.monitoring.googleapis.com -o yaml
apiVersion: apiextensions.k8s.io/v1
kind: CustomResourceDefinition
    :
          spec:
            description: Specification of desired Pod selection for target discovery
              by Prometheus.
            properties:
              endpoints:
                items:
                  description: ScrapeEndpoint specifies a Prometheus metrics endpoint
                    to scrape.
                  properties:
+                    interval:
                      description: Interval at which to scrape metrics. Must be a
                        valid Prometheus duration.
                      type: string
+                    path:
                      description: HTTP path to scrape metrics from. Defaults to "/metrics".
                      type: string
+                    port:
                      anyOf:
                      - type: integer
                      - type: string
                      description: Name or number of the port to scrape.
                      x-kubernetes-int-or-string: true
+                    timeout:
                      description: Timeout for metrics scrapes. Must be a valid Prometheus
                        duration. Must not be larger then the scrape interval.
                      type: string
                  type: object
                type: array
    :
上記で分かりますが、以下の4つの設定ができることがわかります。
- interval
- path
- port
- timeout
pathについては指定できるし、未指定の場合は/metricsが設定されることがdescriptionの内容からわかります。他にもtimeoutの値が指定できることがここからわかります。
この機能を利用してアプリケーションを開発するときに、メトリクスを出力するpathとportを共通化して、メトリクスのスクレイプ専用のラベルを決めてk8sに付与する際に必ずそのラベルを付与するようにしておくと、アプリケーション開発者があまり意識することなくメトリクスが収集できる環境が構築できるかなと思います。intervalとかを変える必要がある場合は、共通用のラベルは外して個別に設定するみたいな形で運用していくのが最初は楽なんじゃないかなと思います。
まだPreview版なので「Google Cloud Managed Service for Prometheus」のドキュメントは少ないんですが、CRDを直接見て、そこに書かれているdescriptionを直接読むと機能の説明が書かれるので、それでどんな機能があるか、どの設定でどう動くかとかはなんとなくわかると思います。
(まだPreview版なので、CRDにはあるけどoperator側で実装されていないものもあるかもしれませんが)
以下に、GKEにあるCRDのうち今回追加したものを記載したのでドキュメントにないときはこれらを直接読めばいいかなと思います。
$ kubectl get crd
NAME                                             CREATED AT
backendconfigs.cloud.google.com                  2021-12-16T14:01:37Z
capacityrequests.internal.autoscaling.gke.io     2021-12-16T14:01:28Z
+ clusterrules.monitoring.googleapis.com           2021-12-16T14:09:50Z
frontendconfigs.networking.gke.io                2021-12-16T14:01:37Z
managedcertificates.networking.gke.io            2021-12-16T14:01:30Z
+ operatorconfigs.monitoring.googleapis.com        2021-12-16T14:09:50Z
+ podmonitorings.monitoring.googleapis.com         2021-12-16T14:09:49Z
+ rules.monitoring.googleapis.com                  2021-12-16T14:09:50Z
serviceattachments.networking.gke.io             2021-12-16T14:01:38Z
servicenetworkendpointgroups.networking.gke.io   2021-12-16T14:01:38Z
storagestates.migration.k8s.io                   2021-12-16T14:01:33Z
storageversionmigrations.migration.k8s.io        2021-12-16T14:01:33Z
updateinfos.nodemanagement.gke.io                2021-12-16T14:01:34Z
volumesnapshotclasses.snapshot.storage.k8s.io    2021-12-16T14:01:31Z
volumesnapshotcontents.snapshot.storage.k8s.io   2021-12-16T14:01:32Z
volumesnapshots.snapshot.storage.k8s.io          2021-12-16T14:01:32Z
- スクレイプの設定が反映されていることの確認
色々確認してみるとcollectorという名前のConfigmapでcollectorのコンポーネントの設定が管理されてるようです。
$ kubectl get cm -n gmp-system
NAME               DATA   AGE
collector          1      14h
kube-root-ca.crt   1      14h
rule-evaluator     1      14h
rules-generated    1      14h
podmonitorings.monitoring.googleapis.comが存在しない状態だと以下のようにconfig.yamlの中身が空になっています。
$ kubectl get cm -n gmp-system collector -oyaml
apiVersion: v1
data:
  config.yaml: |
    global: {}
kind: ConfigMap
先ほどのサンプル設定後に確認すると以下のようになってます。
$ kubectl get cm -n gmp-system collector -oyaml
apiVersion: v1
data:
  config.yaml: |
    global: {}
+    scrape_configs:
+        - job_name: PodMonitoring/gmp-test/prom-example/metrics
+          honor_timestamps: false
+          scrape_interval: 30s
+          scrape_timeout: 30s
+          metrics_path: /metrics
+          follow_redirects: false
+          relabel_configs:
+            - source_labels: [__meta_kubernetes_namespace]
+              regex: gmp-test
+              action: keep
+            - source_labels: [__meta_kubernetes_pod_label_app]
+              regex: prom-example
+              action: keep
+            - source_labels: [__meta_kubernetes_namespace]
+              target_label: namespace
+              action: replace
+            - target_label: job
+              replacement: prom-example
+              action: replace
+            - source_labels: [__meta_kubernetes_pod_container_port_name]
+              regex: metrics
+              action: keep
+            - source_labels: [__meta_kubernetes_pod_name, __meta_kubernetes_pod_container_port_name]
+              regex: (.+);(.+)
+              target_label: instance
+              replacement: $1:$2
+              action: replace
+          kubernetes_sd_configs:
+            - role: pod
+              follow_redirects: true
+              selectors:
+                - role: pod
+                  field: spec.nodeName=$(NODE_NAME)
このことから、以下のような流れでスクレプの設定が反映されているようにみえます。
-
gmp-operatorが新しいpodmonitorings.monitoring.googleapis.comを検知するとConfigmapの設定を書き換える -
collectorのpodにマウントされているConfigmapの内容がkubeletによって反映される -
config-reloaderがリロードのエンドポイントを叩くので、collectorに新しいスクレプの設定が反映される
基本的にはPrometheus OperatorのServiceMonitorと同じ考え方だと思います。
PromQLを実行する
- GCP上から操作する
Monitoringのメニューに「Managed Prometheus」があるのでそこから実行できます。
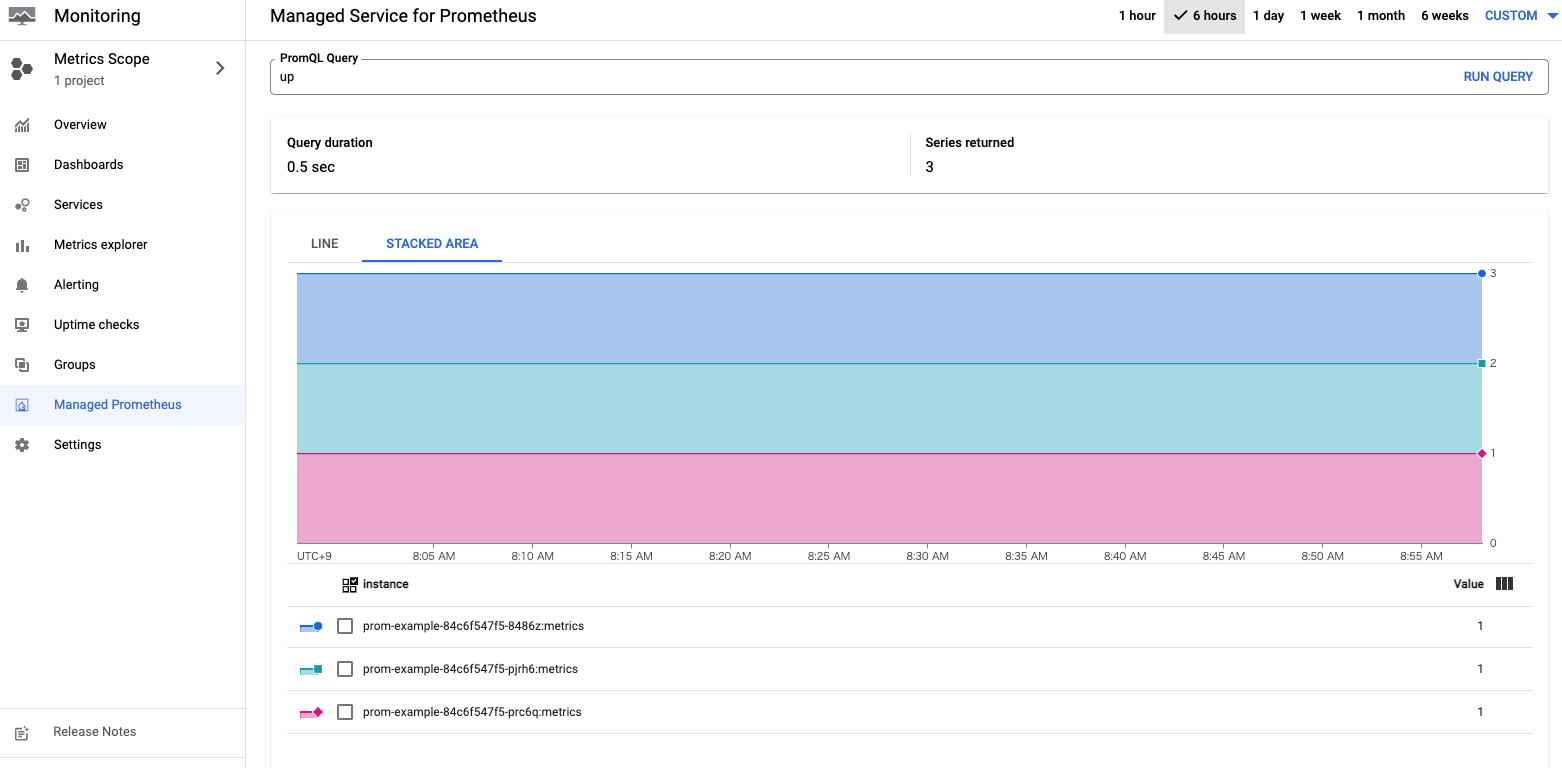
たくさんメトリクスを貯めて複雑なクエリを実行したわけではありませんが、普通に使えそうに感じました。
Prometheus HTTP APIという形でAPIでも公開されてるので、以下のような形で実行できるようです。
$ curl https://monitoring.googleapis.com/v1/projects/PROJECT_ID/location/global/prometheus/api/v1/query \
  -d "query=up" \
  -H "Authorization: Bearer $(gcloud auth print-access-token)"
- Prometheus UIを用いて操作する
GCPのPrometheus HTTP APIだと認証が必要なので、Google Cloud Managed Service for Prometheusに対して接続できるPrometheusのUIが用意されてます。
以下のようにして、自分のクラスタにデプロイします。
curl https://raw.githubusercontent.com/GoogleCloudPlatform/prometheus-engine/v0.1.1/examples/frontend.yaml |
sed 's/\$PROJECT_ID/PROJECT_ID/' |
kubectl apply -n gmp-test -f -
- 接続用にport-forwardを実施
$ kubectl -n gmp-test port-forward svc/frontend 9090
- ブラウザで確認
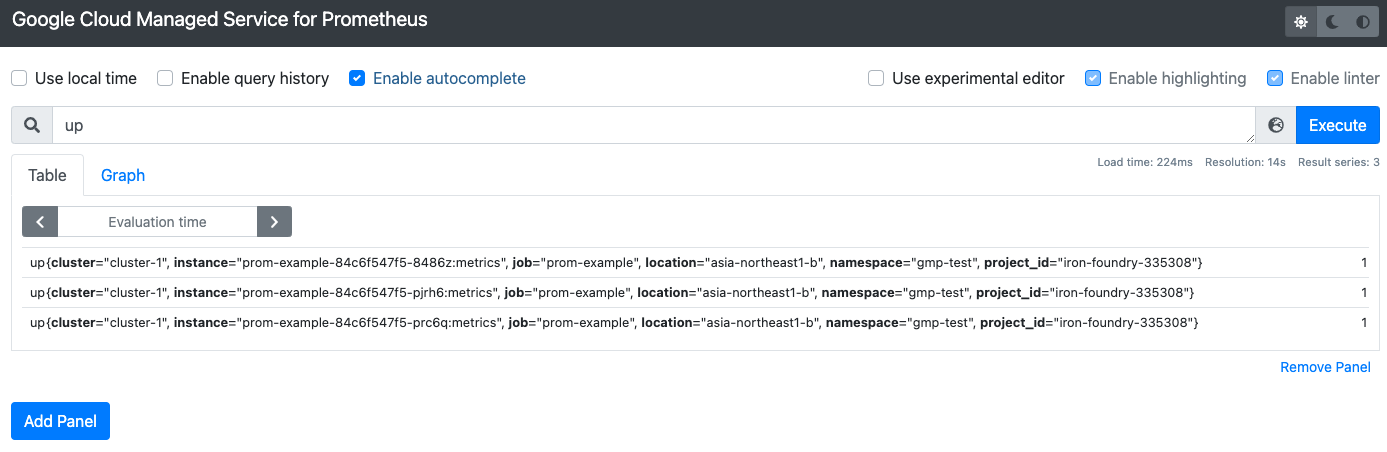
Google Cloud Managed Service for Prometheusという前のPromQLだけ実行できるWebUIにアクセスできます。
ここに対して、Prometheusと同様にPromQLが実行できるので、GrafanaのとかPromQLを叩くその他のエコシステムをそのまま移行できそうに見えます。
- Prometheus UIのPodを確認する
kubectl -n gmp-test get po frontend-7cffb58894-tgdmq -o yaml
apiVersion: v1
kind: Pod
   :
spec:
  containers:
  - args:
    - --web.listen-address=:9090
+    - --query.project-id=<project-id>
    image: gke.gcr.io/prometheus-engine/frontend:v0.1.1-gke.0
   :
上記を見てもわかる通り、frontendはクラスタ単位じゃなくて、project-idに繋ぐので他のクラスタのもみることができます。なのでPrometheus-based Collectorsは各クラスタでセットアップして、frontend(Prometheus UI)とGrafanaは別のクラスタで管理するみたいな方法も取れるかなと思います。
運用のイメージ
機能紹介だけだと運用のイメージがわかない人も多いと思うので、「Google Cloud Managed Service for Prometheus」の機能を元に、運用の例を作ってみました。
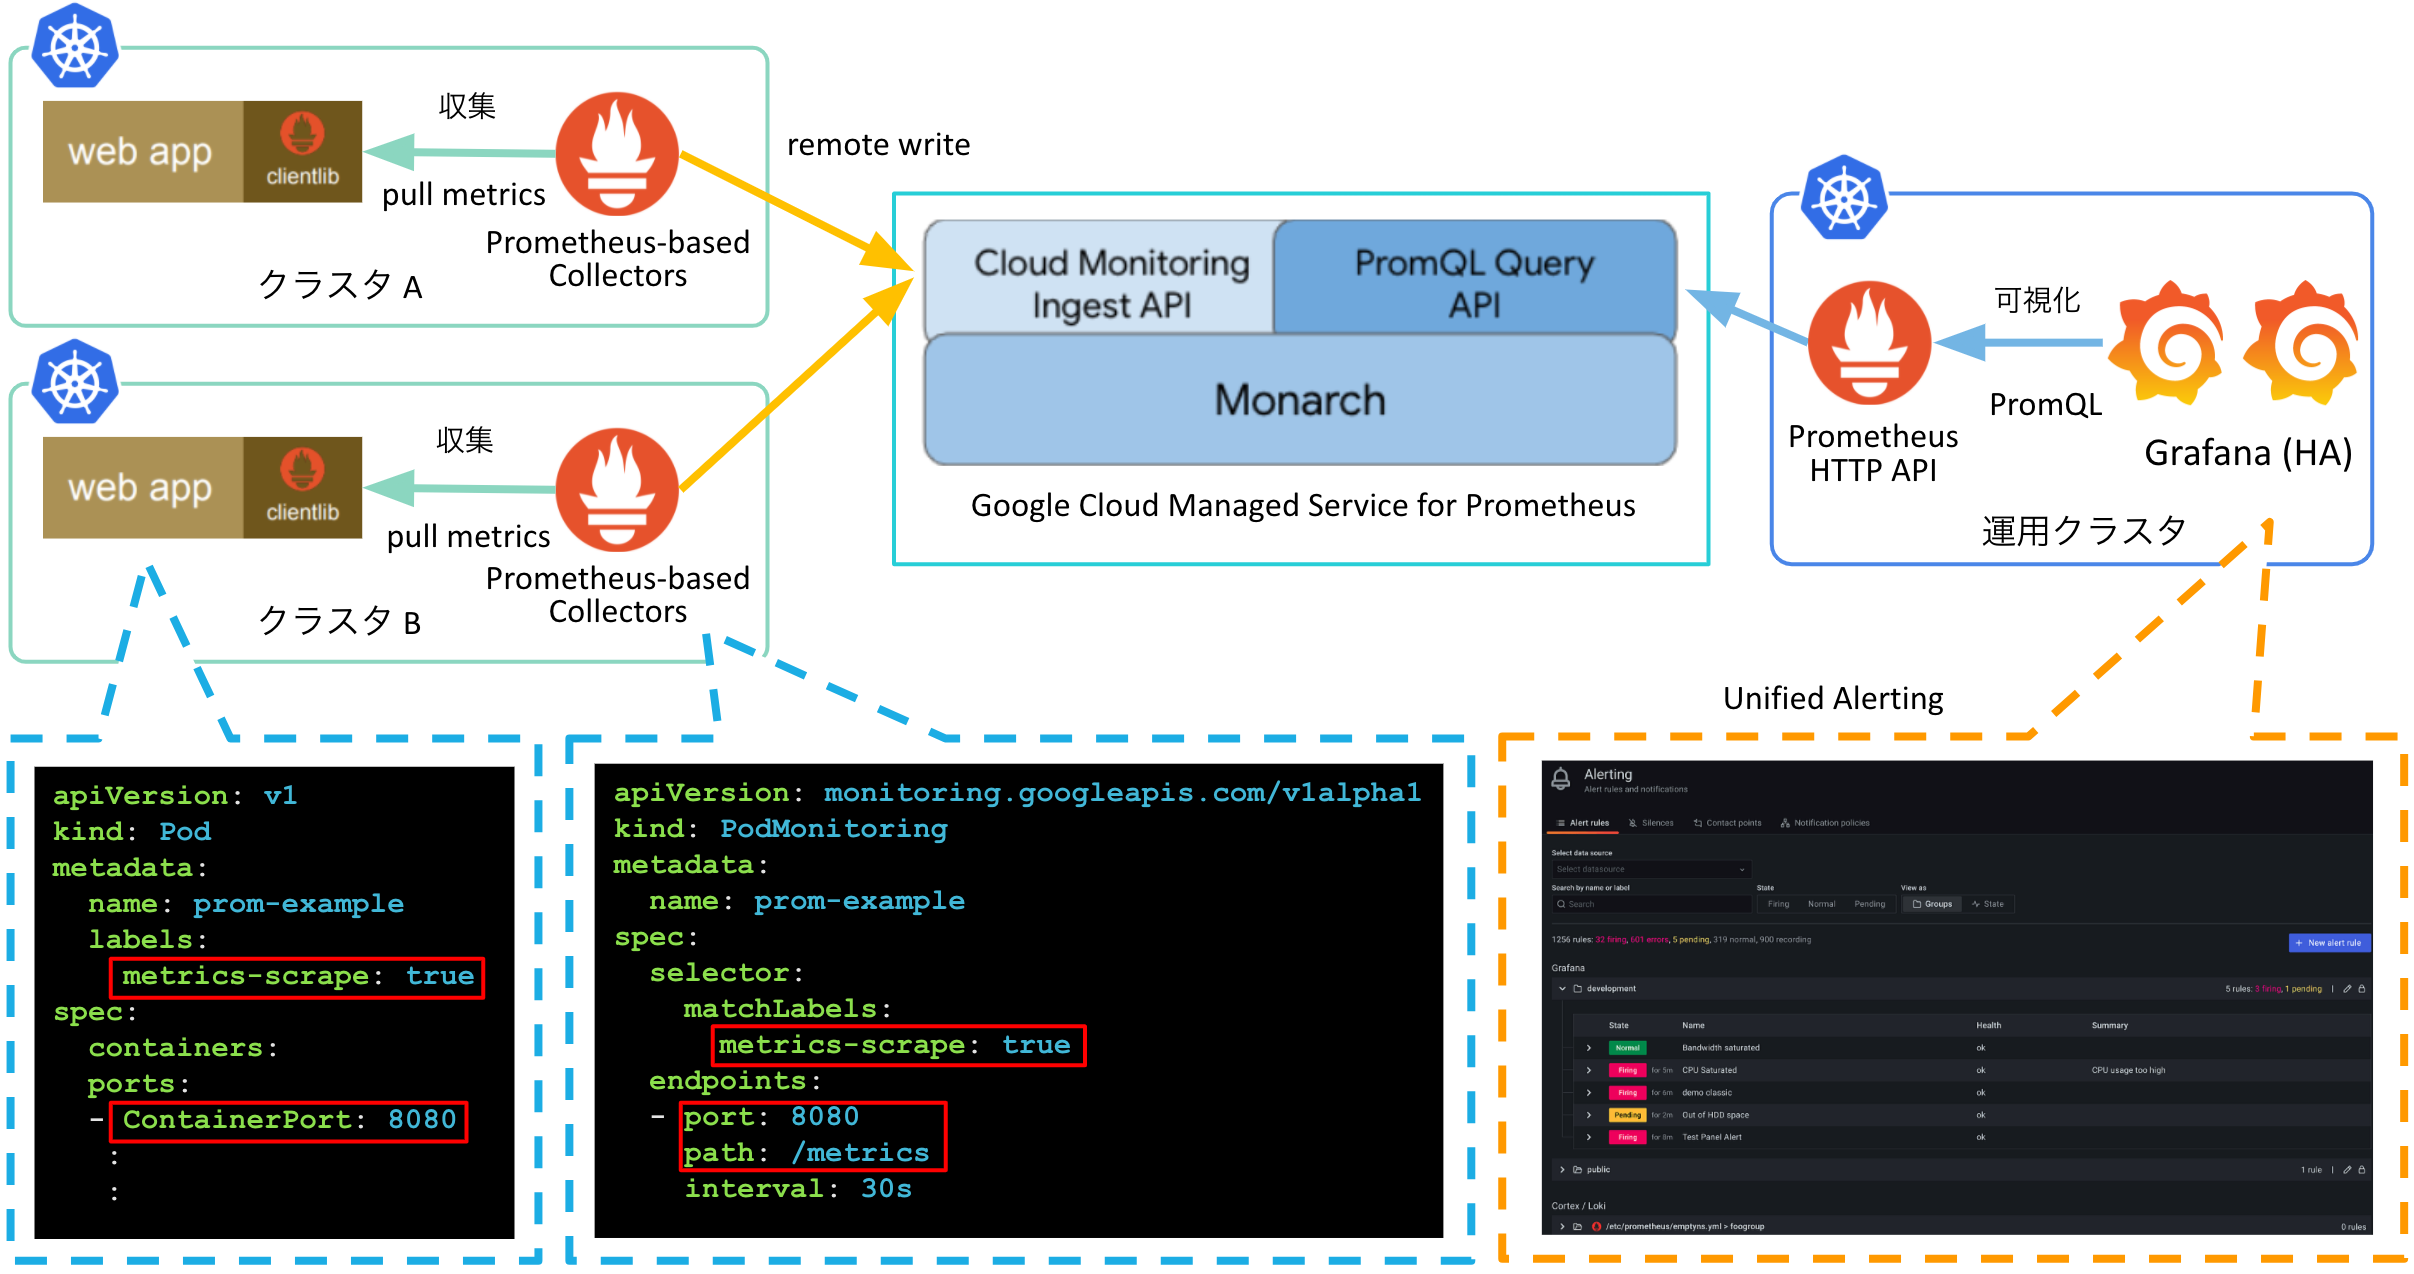
上記の構成の設計のポイントは以下になります。
-
アプリケーション開発時のメトリクス出力方法を固定する
- アプリケーション開発時のメトリクス出力のport,pathを決める (e.g.
8080,/metrics) - メトリクスの収集をするアプリケーションに付与する際に付与するラベルを決める (e.g.
metris-scrape: true) - 対象のラベル,port,pathに対してメトリクスをスクレイプする
monitoring.googleapis.comを事前にデプロイする
こうしておくとアプリケーション開発者が特に意識をする必要なくメトリクスを収集できる環境が整うと思います。node-exporterやkube-state-metrcs等のOSSを使用する場合やintervalやtimeoutを個別に設定したいアプリケーションについては個別に
monitoring.googleapis.comを用意します。 - アプリケーション開発時のメトリクス出力のport,pathを決める (e.g.
-
Grafanaの
Unified Alertingを用いてアラートを一元管理する- AlertManagerを使用する場合は各クラスタに対して冗長構成を組んだAlertManagerを用意する必要があるので、各クラスタの新規作成時と運用時のコストを下げるために運用クラスタを用意してそちらでアラートの管理を実施する
- 運用クラスタに
Prometheus HTTP APIとHA構成を組んだGrafanaを用意してUnified Alertingを用いてアラートの管理を行う -
Prometheus HTTP APIを冗長化したり、アラート用とユーザがダッシュボードを作る用のGrafanaを分けたりすることを検討してもいいかもしれません
クラスタの運用に必要な機能を別のクラスタに寄せることで、アプリケーションのデプロイ用のクラスタに必要なコンポーネントを減らすことで運用コストを下げようとしてます。アラート先のSlackのクレデンシャル情報などをアプリケーション用のクラスタからなくして、運用クラスタに寄せることができるのもメリットかなと思います。
-
アップデート方法
- 各コンポーネントをアップデートする場合は
gmp-operatorのargsの--image-XXXXで指定するイメージを更新する -
gmp-operatorを更新する場合は、gmp-operatorの更新をする。その際にCRDの更新に関する指示がある場合は合わせて更新する
- 各コンポーネントをアップデートする場合は
  :
spec:
  containers:
  - args:
    - --ca-selfsign=false
    - --public-namespace=gmp-public
    - --priority-class=gmp-critical
+    - --image-collector=gke.gcr.io/prometheus-engine/prometheus:v2.28.1-gmp.1-gke.1
+    - --image-config-reloader=gke.gcr.io/prometheus-engine/config-reloader:v0.1.1-gke.0
+    - --image-rule-evaluator=gke.gcr.io/prometheus-engine/rule-evaluator:v0.1.1-gke.0
+    image: gke.gcr.io/prometheus-engine/operator:v0.1.1-gke.0
  :
上記は、「Google Cloud Managed Service for Prometheus」を使用する際の一個の設計の例なのでご参考程度にお考えください。
所感
Prometheusの互換性について考える時には下の図にあるように4つのIFに着目するとわかりやすくなります。
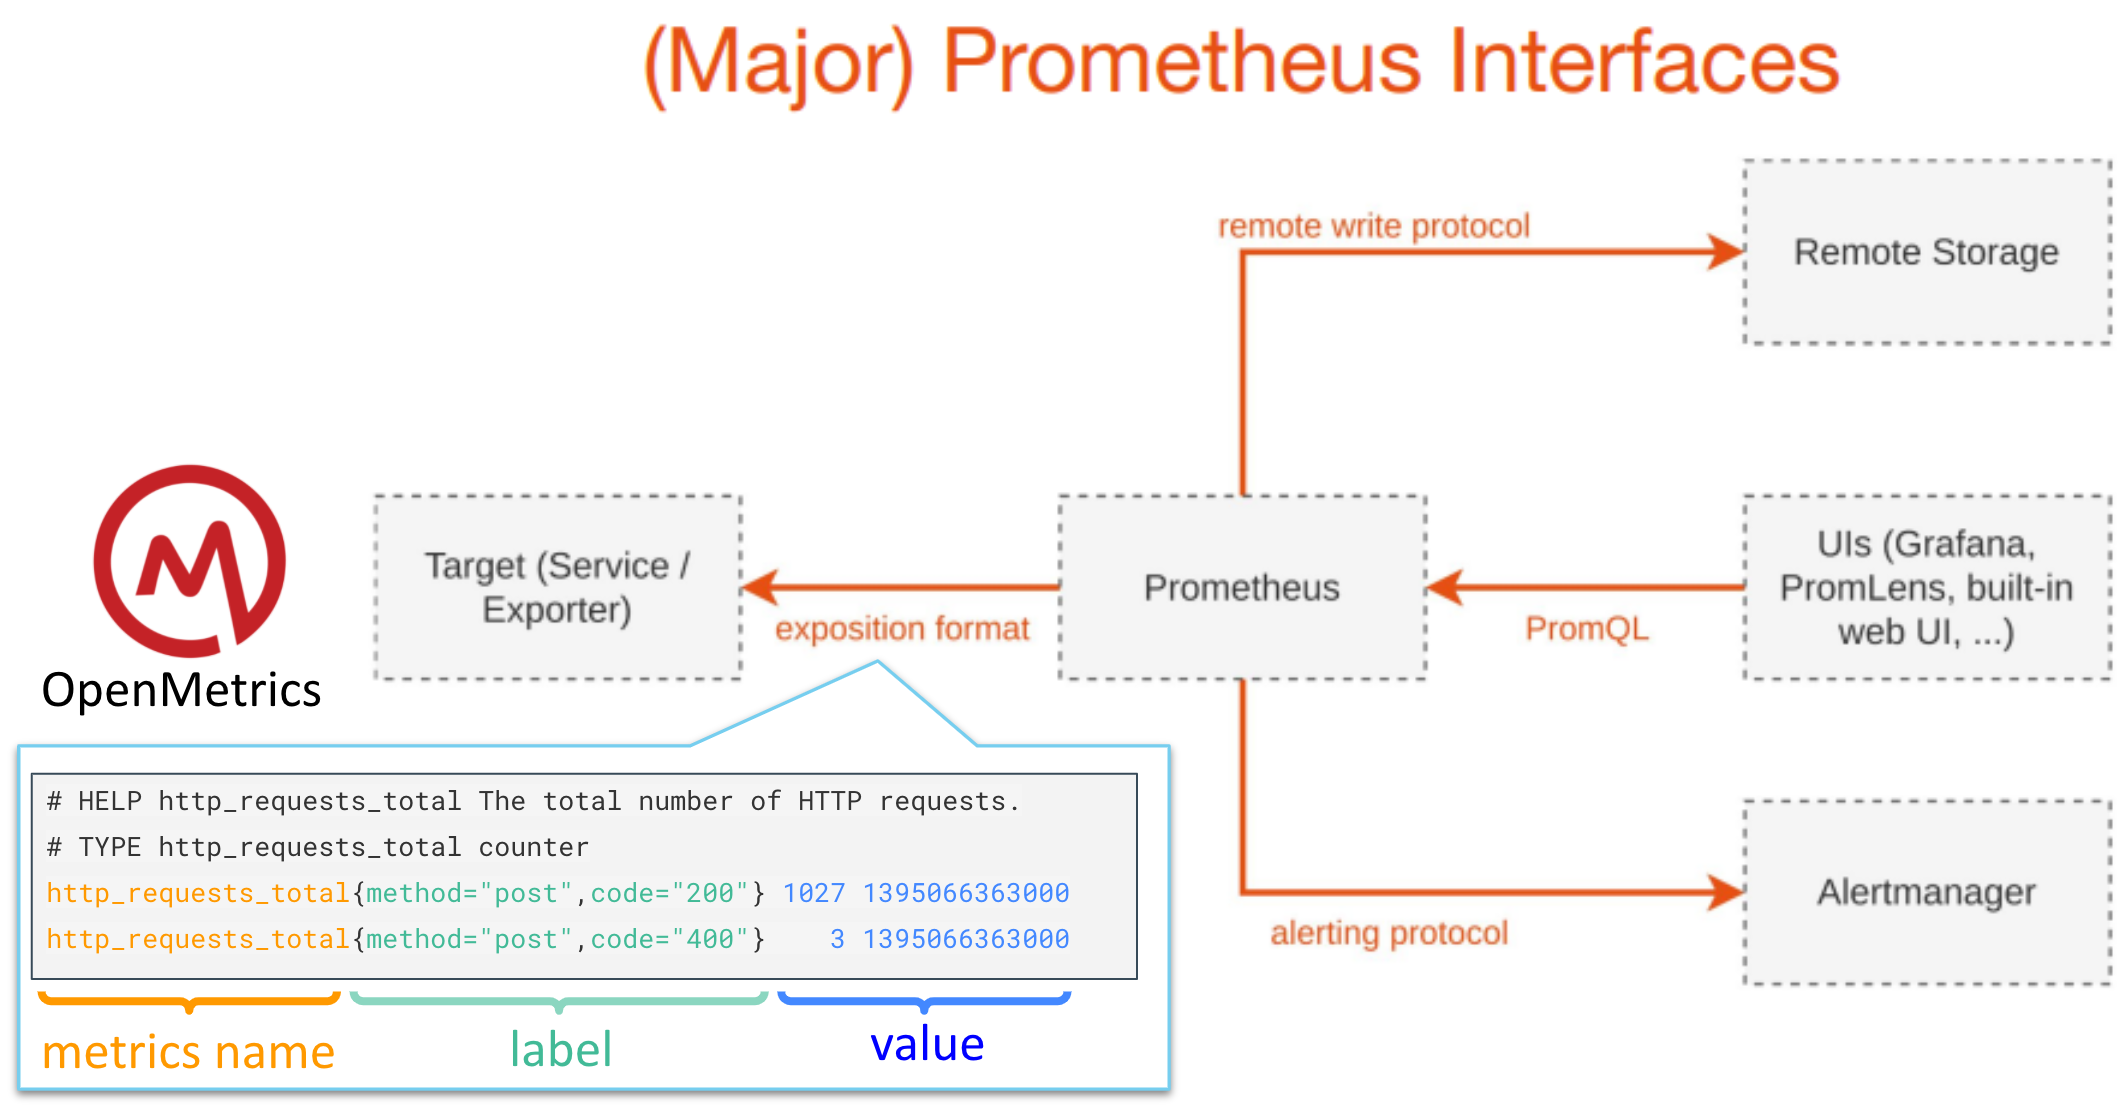
- exposition format : メトリクスに関する仕様(実質 OpenMetricsのこと)
- remote write protocol : Remote Write機能に対応したプロトコル
- PromQL : Prometheusが蓄積してるデータに対するクエリ。Grafanaとかで利用している
- alerting protocol : アラート機能に関するプロトコル(実質 Alertmanagerとの接続に関する部分)
上記の4つのIFに対応する機能がPrometheusで実装されていますが、IFに対して互換性を持つプロダクトでその機能を置き換えることができますし、全てのIFに対応しているプロダクトであれば丸ごとPrometheusから置き換えることができます。
今回の「Google Cloud Managed Service for Prometheus」では4つのIFに対してどう対応しているかというと以下のようになります。
- exposition format : 各クラスタの単位で管理
各クラスタ内でmonitoring.googleapis.com/v1alpha1で設定 - remote write protocol : 各クラスタの単位で管理(ユーザからは隠蔽されているように見える)
- PromQL : プロジェクト単位で管理
各クラスタを横断してメトリクスを操作できる - alerting protocol : 各クラスタの単位で管理
各クラスタ内でmonitoring.googleapis.com/v1alpha1で設定
remote write protocolのところを意識せずに、使いたいところだけ使えるように考慮されたサービスかなと思います。各クラスタ単位で管理するものと、プロジェクト単位で管理するものがあることには気をつけてください。
アプリケーションを開発する人はOpenMetrics形式でメトリクスが出力できるようにすることと、合わせてpodmonitorings.monitoring.googleapis.comをデプロイすることを忘れなければいいので使いやすいと思います。
Amazon Managed Service for Prometheusの方は、Cortexベースとのことですが、「Google Cloud Managed Service for Prometheus」はMonarchベースで作っており、この辺は各クラウドベンダー毎に違いがあって面白いと思います。
そもそも、クラウドベンダーは各社毎にモニタリングサービスを提供していたにも関わらず、マネージドなPrometheusのサービスを提供する方向に舵を取ったことに、市場の強いニーズを感じます。
この方向で市場全体が進むと、ユーザとしてはOpenMetrics形式でメトリクスを出力することを意識すれば、どこの環境でもPromQLで操作できるようになるので、環境を使い分ける毎に必要になる学習コストも下がるのでいい傾向だなと思っています。