概要
「トップレベルのループと関数内のループの違い」で見ていた
loop_toplevel.py
for i in range(10**7):
    pass
をサンプルとして、Python VMの処理をプロファイルして、STORE_NAME の処理が実行時間に効いてるのを見てみましょう。
Ubuntu 18.04環境で確認します。
Pythonのソースコード取得
https://github.com/python/cpython から取得
~$ git clone https://github.com/python/cpython.git
Pythonのビルド
gcc をインストール
~$ sudo apt install -y gcc
プロファイラを有効に、最適化を無効にしてビルドする
~$ cd cpython
~/cpython$ ./configure --enable-profiling --with-pydebug
~/cpython$ make
プロファイル
対象のスクリプトを用意
~/cpython$ vi loop_toplevel.py
~/cpython$ cat loop_toplevel.py
for i in range(10**7):
    pass
ビルドしたpythonを単純に実行すればプロファイルしてくれる。
~/cpython$ ./python loop_toplevel.py
gmon.outにプロファイル結果が保存されている。サマリを見るには gprof ./python すればよい。
~/cpython$ ls -l gmon.out
-rw-rw-r-- 1 vagrant vagrant 1284656 Nov  4 03:16 gmon.out
~/cpython$ gprof ./python|head -n 20
Flat profile:

Each sample counts as 0.01 seconds.
  %   cumulative   self              self     total
 time   seconds   seconds    calls   s/call   s/call  name
 17.46      0.22     0.22 20043118     0.00     0.00  read_size_t
  9.52      0.34     0.12     2229     0.00     0.00  _PyEval_EvalFrameDefault
  7.94      0.44     0.10 10007889     0.00     0.00  insertdict
  6.35      0.52     0.08 10026827     0.00     0.00  _PyMem_DebugRawAlloc
  6.35      0.60     0.08 10021559     0.00     0.00  _PyMem_DebugCheckAddress
  4.76      0.66     0.06 20045319     0.00     0.00  PyGILState_Check
  3.97      0.71     0.05 10020541     0.00     0.00  address_in_range
  3.97      0.76     0.05 10001148     0.00     0.00  PyLong_FromLong
  3.97      0.81     0.05 10046396     0.00     0.00  lookdict_unicode_nodummy
  3.97      0.86     0.05 10021024     0.00     0.00  _PyMem_DebugRawFree
  3.57      0.91     0.05 10019912     0.00     0.00  _PyObject_Free
  3.17      0.95     0.04 10027556     0.00     0.00  write_size_t
  3.17      0.99     0.04 10019415     0.00     0.00  _PyMem_DebugFree
  2.38      1.02     0.03 10017088     0.00     0.00  _PyDict_CheckConsistency
  2.38      1.05     0.03 10008245     0.00     0.00  PyDict_SetItem
gprof2dotで可視化
gprof2dotを使ってコールグラフを可視化してみる。
~/cpython$ sudo apt install -y graphviz
~/cpython$ sudo apt install -y python3-pip
~/cpython$ pip3 install --user gprof2dot
~/cpython$ gprof ./python | ~/.local/bin/gprof2dot | dot -Tpng -o output.png
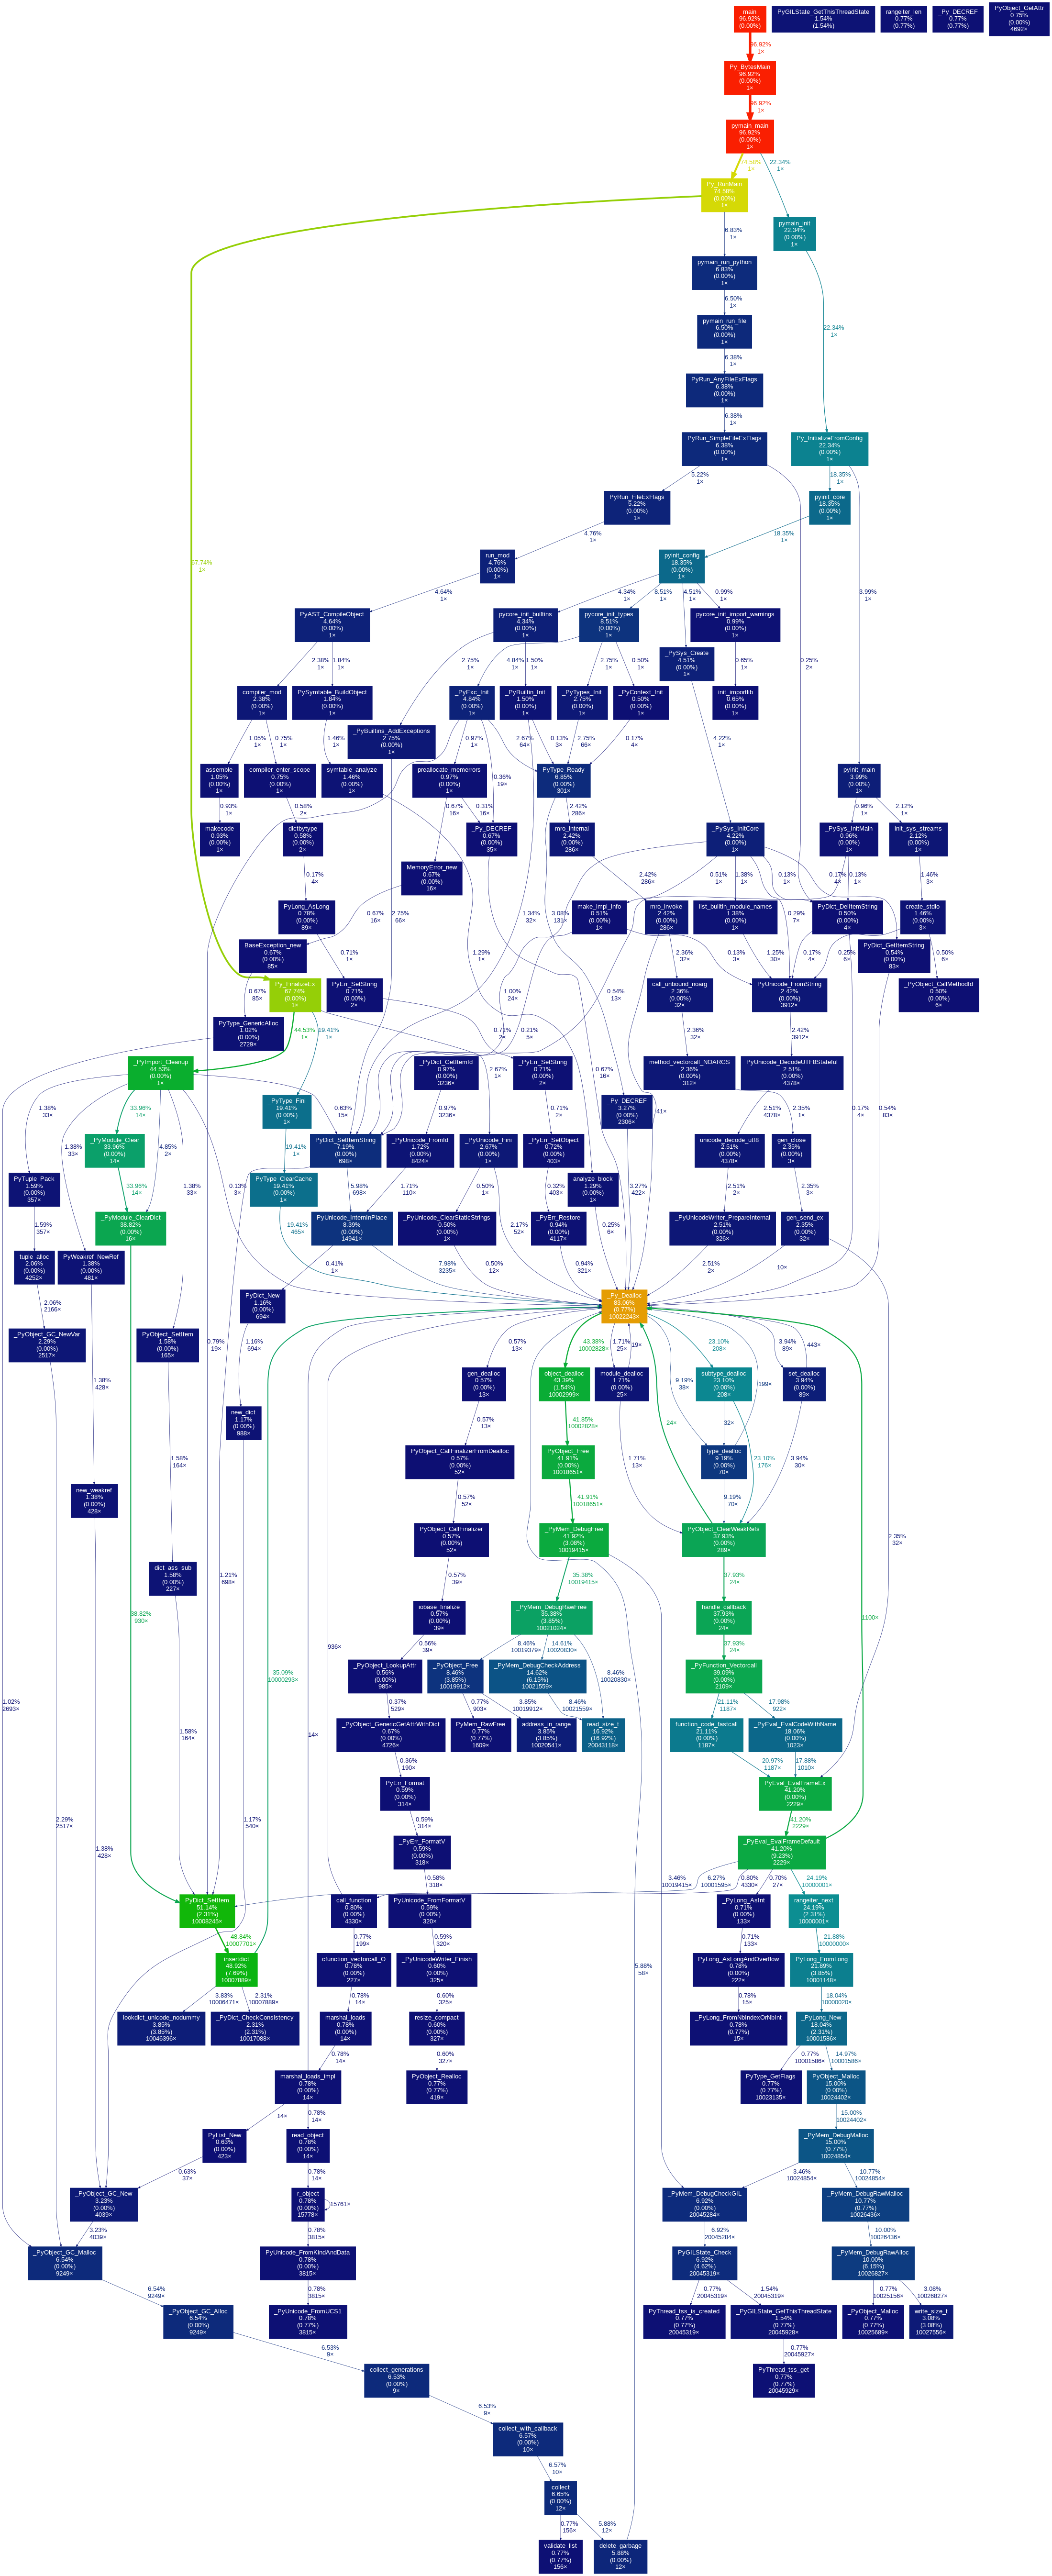
PyDict_SetItemがループ回数のオーダーで呼ばれていて、それ以下が時間を食っているのが見れた(total time 51.14%, self time 2.31%, 10008245 calls)。
ソースで確認
Python VMのSTORE_NAMEの実装を見ると、たしかにPyDict_SetItemを呼んでる。
cpython/Python/ceval.c
case TARGET(STORE_NAME): {
    PyObject *name = GETITEM(names, oparg);
    PyObject *v = POP();
    PyObject *ns = f->f_locals;
    int err;
    if (ns == NULL) {
        _PyErr_Format(tstate, PyExc_SystemError,
                      "no locals found when storing %R", name);
        Py_DECREF(v);
        goto error;
    }
    if (PyDict_CheckExact(ns))
        err = PyDict_SetItem(ns, name, v);
    else
        err = PyObject_SetItem(ns, name, v);
    Py_DECREF(v);
    if (err != 0)
        goto error;
    DISPATCH();
}