matplotlibは言わずと知れたグラフをプロットをするためのライブラリだが、ドローイングソフトの代わりに絵を描くツールとしても使うことができる。
GUIのドローイングツールと違い、コードで描画していくので
- 再利用性、再現性が高い
- コードをgitで管理できる
などのメリットがある。論文などで図を用意する際に役にたつ。
この記事ではそのようなドローイングとしてmatplotlibを使う方法をまとめる。
事前準備
import matplotlib.pyplot as plt
import matplotlib.patches as patches

plt.clf()
fig, ax = plt.subplots()
ax.set_xlim(0, 5)
ax.set_ylim(0, 5)

ax.set_aspect('equal')
ax.axis('off')
図形を描画する前に上のコードを呼ぶ。
-
ax.set_xlimax.set_ylimで描画領域を指定する- 縦と横の比を変えられる。たとえば3:4にしたい場合は
ax.set_xlim(0,3),ax.set_ylim(0,4)などと指定する。
- 縦と横の比を変えられる。たとえば3:4にしたい場合は
-
ax.set_aspect('equal')でアスペクト比を一定にする- これがない場合、縦と横の比が上で指定した通りにならない。
-
ax.axis('off')で縦軸、横軸の表示をオフにする。- ちなみに最終的には
offにするのが良いが、位置を決めるために試行錯誤する時にはonにしておくと座標の位置がわかりやすい。
- ちなみに最終的には
長方形、円、楕円、線、扇形の描画
rect1 = patches.Rectangle((1, 2), 2, 1, edgecolor='red', facecolor='red', linewidth=2)
ax.add_patch(rect1)
rect2 = patches.Rectangle((4, 1), 1, 2, edgecolor='blue', facecolor='none', linewidth=2, angle=30, rotation_point=(4, 1))
ax.add_patch(rect2)

circle = patches.Circle((3, 4), 0.8, edgecolor='green', facecolor='none', linewidth=2)
ax.add_patch(circle)

ellipse = patches.Ellipse((1, 2), 2, 1, angle=60, edgecolor='purple', facecolor='none', linewidth=2)
ax.add_patch(ellipse)

line = patches.ConnectionPatch((1, 2), (4, 3), coordsA='data', coordsB='data', arrowstyle='->', linewidth=2, edgecolor='orange')
ax.add_patch(line)

wedge = patches.Wedge(center=(3, 1), r=0.5, theta1=30, theta2=330, edgecolor='none', facecolor='#F4C3C2', alpha=0.8)
ax.add_patch(wedge)

- 長方形の描画には
patches.Rctangleを使う。上の例にあるように角度を傾けて描画することもできる。 - 円、楕円の描画には
patches.Circlepatches.Ellipseを用いる - 線の描画には
ConnectionPatchを使う。矢印にすることもできる。 - 扇形は
Wedgeを使う。
ポリゴンの描画
polygon = patches.Polygon([(1, 4), (2, 5), (4, 4.5), (3.5, 3)], closed=True, edgecolor='orange', facecolor='blue', linewidth=2)
ax.add_patch(polygon)
polygon2 = patches.Polygon([(1, 2), (2, 3), (3, 2), (4, 3)], closed=False, edgecolor='#ADA8B6', facecolor='#FFEEDB', linewidth=2)
ax.add_patch(polygon2)
polyline = patches.Polygon([(1, 1), (2, 2), (3, 1), (4, 2)], closed=False, edgecolor='green', facecolor='none', linewidth=2)
ax.add_patch(polyline)
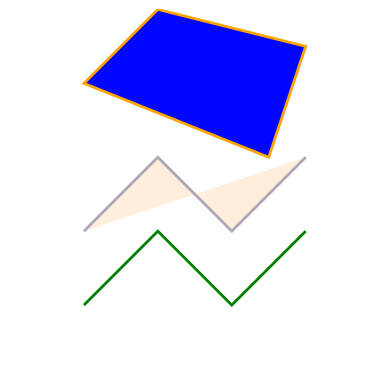
任意の多角形を書きたい場合には Polygon を使う。
折れ線を書きたい場合にも利用可能。
矢印の描画
arrow1 = patches.Arrow(0, 0, dx=1, dy=2, width=0.5, edgecolor='red', facecolor='gray')
ax.add_patch(arrow1)
arrow2 = patches.Arrow(1, 2, dx=2, dy=1, width=1, edgecolor='blue', facecolor='none')
ax.add_patch(arrow2)
arrow3 = patches.Arrow(3, 3, dx=1, dy=-2, width=0.5, edgecolor='green', facecolor='none', linewidth=2)
ax.add_patch(arrow3)
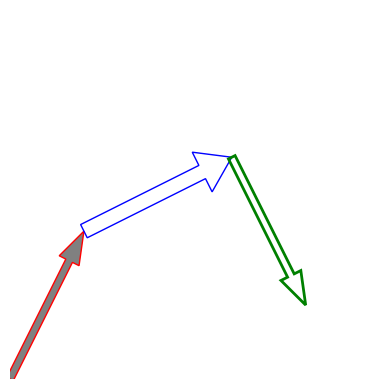
簡単な矢印の描画には Arrow を使えば良いが、もう少し複雑なことをしたい場合には FancyArrowPatchを使うと良い。
次のサンプルにFancyArrowPatchの使用例がある。
文字列の描画
rect = patches.Rectangle((1, 1), 2, 1, edgecolor='gray', facecolor='none', linewidth=2, linestyle='--')
ax.add_patch(rect)
fancybbox = patches.FancyBboxPatch((1, 1), 2, 1, boxstyle='round,pad=0.2', edgecolor='blue', facecolor='none', linewidth=2)
ax.add_patch(fancybbox)

ax.text(2.5, 3.0, 'FancyBboxPatch', ha='left', va='center', fontsize=12)
arrow = patches.FancyArrowPatch(
    (2.5, 3.0),   # Starting point
    (1.8, 2.2),   # Ending point
    arrowstyle='->',
    connectionstyle='arc3,rad=0.5',  # Curvature of the arrow
    color='black',
    mutation_scale=10
)
ax.add_patch(arrow)

ax.text(2.5, 2.5, 'Rectangle', ha='left', va='center', fontsize=12, color='black', bbox=dict(boxstyle='round,pad=0.2', facecolor=(0.1,0.1,0.1,0.2), edgecolor='none', linewidth=2))
arrow2 = patches.FancyArrowPatch(
    (2.5, 2.5),   # Starting point
    (2.1, 2.0),   # Ending point
    arrowstyle='->',
    connectionstyle='arc3,rad=0.4',  # Curvature of the arrow
    color='black',
    mutation_scale=10
)
ax.add_patch(arrow2)

ax.text(1.0, 4.0, 'text surrounded by arrow', ha='left', va='center', fontsize=12, color='black',
        bbox=dict(boxstyle='rarrow,pad=0.5', facecolor='#E88EED', edgecolor='none', linewidth=2))

- 文字を入れたい場合、
ax.textで文字を追加できる。- キーワード引数
ha,vaで水平方向、垂直方向のアンカーの位置を指定できる。 -
bboxパラメータで、テキストを囲む領域を描画することができる。
- キーワード引数
-
FancyBboxPatchは、ある領域を囲むような領域を図示したい場合に有効 -
FancyArrowPatchはちょっとこった形の矢印を描画したい場合に使うと良い。Arrowよりもスタイルを細かく指定できる。 - ちなみに
ax.annotateというメソッドもあるが、矢印の位置を細かく設定できないので使わない方が無難。
図形の結合、積集合、差集合
上のような基本的な図形を組み合わせて、もっと複雑な形を描画する場合には、matplotlibだけでは難しい。
そのためには、shapelyというライブラリを使う必要がある。
以下のサンプルコードを見れば基本的な使い方は理解してもらえると思う。
import numpy as np
import shapely.geometry as sg
import matplotlib as mpl

fig, ax = plt.subplots()
ax.set_xlim(0, 5)
ax.set_ylim(0, 5)
ax.set_aspect('equal')
ax.axis('off')

# create the circles with shapely
a = sg.Point(2,2.5).buffer(2.0)
b = sg.Point(4,2.5).buffer(1.0)

# compute the 3 parts
left = a.difference(b)
right = b.difference(a)
middle = a.intersection(b)

# Plots a Polygon to pyplot `ax`
def plot_polygon(ax, poly, **kwargs):
    path = mpl.path.Path.make_compound_path(
        mpl.path.Path(np.asarray(poly.exterior.coords)[:, :2]),
        *[mpl.path.Path(np.asarray(ring.coords)[:, :2]) for ring in poly.interiors])

    patch = mpl.patches.PathPatch(path, **kwargs)
    collection = mpl.collections.PatchCollection([patch], **kwargs)
    ax.add_collection(collection)
    return collection

plot_polygon(ax, left, facecolor='r', edgecolor='k', alpha=0.2)
plot_polygon(ax, right, facecolor='b', edgecolor='k', alpha=0.2)
plot_polygon(ax, middle, facecolor='purple', edgecolor='k', alpha=0.8)
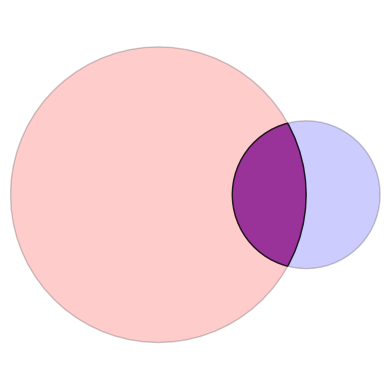
- shapelyはさまざまな形状を処理するためのライブラリで、matplotlib上で使うことは想定されていない。そこで、
plot_polygonという関数を上のように定義する。- shapelyから座標値を取ってmatplotlibで描画できる形式に変換している。
-
sg.Point(...).buffer()でshapely上で円を作成している。- 点を作成し、
bufferでその点から一定距離の領域(つまり円)を作成している。
- 点を作成し、
- shapelyでは、領域の和(union)、差(difference)、積(intersection)を計算することができる。
これを応用すると、単純な図形を組み合わせて複雑な図形を描画できる。
例えば、以下のようなコードで人間を描画できる。
def person(x, y, width):
    r = width / 2
    a = sg.Point(r, 3*r).buffer(r)
    b = sg.Point(r, 1.5*r).buffer(r)
    c = sg.Polygon([(0, 1.5*r), (0, 0), (2*r, 0), (2*r, 1.5*r)])
    person  = a.union(b).union(c)
    from shapely.affinity import translate
    person = translate(person, xoff=x, yoff=y)
    return person

u = person(1, 2, 0.5)
plot_polygon(ax, u, facecolor='#104547', edgecolor='#104547', alpha=0.5)
u = person(3.5, 2, 0.5)
plot_polygon(ax, u, facecolor='#727072', edgecolor='#727072', alpha=0.7)

より実践的なサンプル
上の内容を組み合わせて少し複雑な図を書いてみる。このような図形を書くことができる。
fig, ax = plt.subplots()
ax.set_xlim(0, 6)
ax.set_ylim(0, 4.5)
ax.set_aspect('equal')
ax.axis('off')

alice = person(0.7, 2, 1)
plot_polygon(ax, alice, facecolor='#56494E', edgecolor='none', alpha=0.8)
ax.text(1.2, 3.5, 'G', ha='center', va='center', fontsize=24, color='white')
ax.text(1.2, 4.1, 'Alice', ha='center', va='bottom', fontsize=16, color='black')

bob = person(4.3, 2, 1)
plot_polygon(ax, bob, facecolor='#56494E', edgecolor='none', alpha=0.8)
ax.text(4.8, 3.5, 'B', ha='center', va='center', fontsize=24, color='white')
ax.text(4.8, 4.1, 'Bob', ha='center', va='bottom', fontsize=16, color='black')

ax.text(3.0, 3.0, 'D', ha='center', va='center', fontsize=20, color='white')
arrow1 = patches.FancyArrow(2.0, 3.0, dx=2.1, dy=0, width=0.5, edgecolor='black', facecolor='#511C29', alpha=0.8, head_length=0.5, head_width=1.0, length_includes_head=True)
ax.add_patch(arrow1)
ax.text(3.0, 3.6, "Alice's cooperation\nprobability\n$P(G,B)=0.7$", ha='center', va='bottom', fontsize=12, color='black')
ax.text(3.0, 2.5, "Alice's\nrealized action", ha='center', va='top', fontsize=12, color='black')

arrow2 = patches.FancyArrow(1.2, 1.9, dx=0, dy=-0.8, width=0.05,
                            edgecolor='black', facecolor='black', overhang=0.1,
                            head_length=0.3, head_width=0.2, length_includes_head=True)
ax.add_patch(arrow2)
ax.text(1.2, 1.0, "Alice's\next reputation\n$R_1(G,B,D)$", ha='center', va='top', fontsize=12, color='black')

arrow3 = patches.FancyArrow(4.8, 1.9, dx=0, dy=-0.8, width=0.05,
                            edgecolor='black', facecolor='black', overhang=0.1,
                            head_length=0.3, head_width=0.2, length_includes_head=True)
ax.add_patch(arrow3)
ax.text(4.8, 1.0, "Bob's\next reputation\n$R_2(G,B,D)$", ha='center', va='top', fontsize=12, color='black')
