はじめに
① https://qiita.com/yohiro/items/04984927d0b455700cd1
② https://qiita.com/yohiro/items/5aab5d28aef57ccbb19c
③ https://qiita.com/yohiro/items/cc9bc2631c0306f813b5
④ https://qiita.com/yohiro/items/d376f44fe66831599d0b
の続き
scikit-learn
今回用いる機械学習ライブラリ
課題設定
花弁と萼それぞれの長さと幅を与えると、アヤメの品種特定をする。
0は"Setosa"を表す。
1は"Versicolor"を表す。
2は"Virsinica"を表す。
ソースコード
インポート
from sklearn import datasets
from sklearn import svm
サンプルデータの読み込み
# Irisの測定データの読み込み
iris = datasets.load_iris()
irisには以下のようなデータが入っている
[[5.1 3.5 1.4 0.2]
 [4.9 3.  1.4 0.2]
 [4.7 3.2 1.3 0.2]
...
[0 0 ... 1 1 ... 2 2]
...
どちらも要素数は150。おそらく、"0:Setosa", "1:Versicolor", "2:Virsinica"それぞれの正解データが50個づつ入っているものと思われる。
サポートベクターマシンによる分類
# 線形ベクターマシン
clf = svm.LinearSVC()
# サポートベクターマシンによる訓練
clf.fit(iris.data, iris.target)
svmのメソッドを使ってサポートベクターマシンに学習させる。
今回使っている線形ベクターマシンは、平面(多分、何次元でもいいのだと思う)に打ち込んだ複数の点の集まりに対して線(3次元だったら面)を引いてグルーピングさせるモデル。
今回のケースだと、扱うデータは「花弁の長さ」・「花弁の幅」・「萼の長さ」・「萼の幅」の4つなので、4次元空間に正解データをプロットして、識別できる線を引いている?と思われる。
分類
上記で作成したclfに3つのデータを読ませ、"0:Setosa", "1:Versicolor", "2:Virsinica"のどれになるか、それぞれ分類させる。
# 品種を判定する
print(clf.predict([[5.1, 3.5, 1.4, 0.1], [6.5, 2.5, 4.4, 1.4], [5.9, 3.0, 5.2, 1.5]]))
結果
なんかワーニングが出るが、分類ができている?
C:\Anaconda3\python.exe C:/scikit_learn/practice.py
C:\Anaconda3\lib\site-packages\sklearn\svm\_base.py:947: ConvergenceWarning: Liblinear failed to converge, increase the number of iterations.
  "the number of iterations.", ConvergenceWarning)
[0 1 2]
おまけ
iris.dataの中身がどのようなデータなのかを見える化してみた
from sklearn import datasets
import matplotlib.pyplot as plt

# Irisの測定データの読み込み
iris = datasets.load_iris()

# Setosa, Versicolour, Virginica
sepal_length = [[], [], []]
petal_length = [[], [], []]
sepal_width = [[], [], []]
petal_width = [[], [], []]

for num, data in enumerate(iris.data):
    cls = iris.target[num]
    sepal_length[cls].append(data[0])
    petal_length[cls].append(data[1])
    sepal_width[cls].append(data[2])
    petal_width[cls].append(data[3])

plt.subplot(1,2,1)
plt.scatter(sepal_length[0], petal_length[0], c="red", label="Setosa", marker="+")
plt.scatter(sepal_length[1], petal_length[1], c="blue", label="Versicolour", marker="+")
plt.scatter(sepal_length[2], petal_length[2], c="green", label="Virginica", marker="+")
plt.xlabel('sepal_length')
plt.ylabel('petal_length')
plt.legend()

plt.subplot(1,2,2)
plt.scatter(sepal_width[0], petal_width[0], c="red", label="Setosa", marker="+")
plt.scatter(sepal_width[1], petal_width[1], c="blue", label="Versicolour", marker="+")
plt.scatter(sepal_width[2], petal_width[2], c="green", label="Virginica", marker="+")
plt.xlabel('sepal_width')
plt.ylabel('petal_width')
plt.legend()

plt.show()
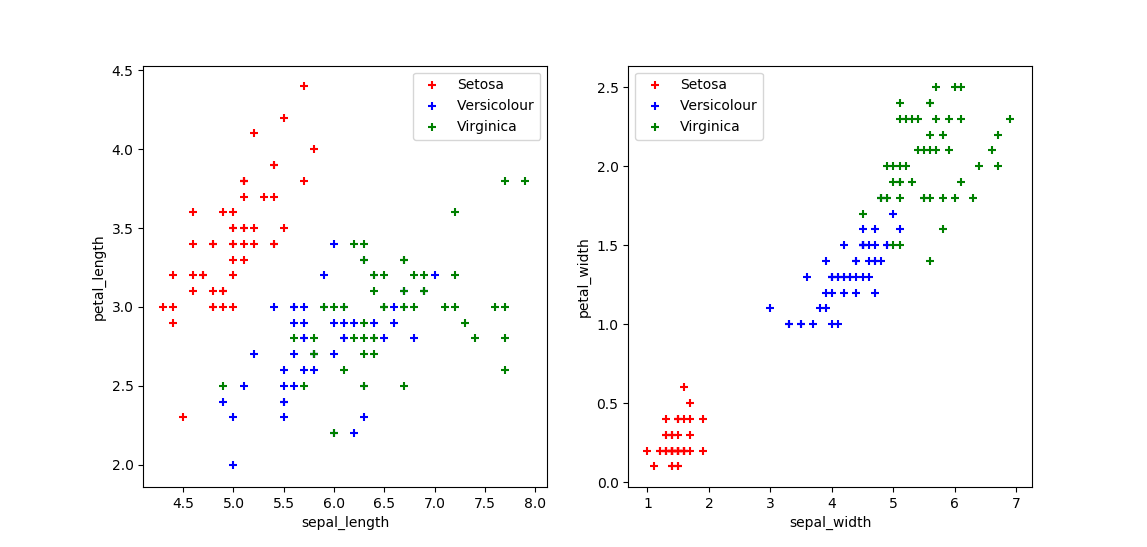
Setosa, Versicolour, Virginicaのグループの間に線を引くことで、(Versicolour, Virginicaのライン近傍のデータは難しいかもしれないが)おおむね分類できそうなことが理解できる。