#Harmoware-VIS とは
#オプションのグラフ表示
Harmoware-VIS で移動体アイコンに棒グラフを表示する方法
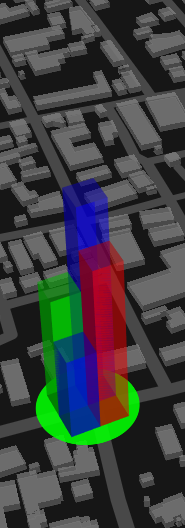
移動アイコンに従って移動する棒グラフを表示できます。
棒グラフは最大4つ表示可能です。色分けも指定できます。
表示例

移動データの設定
[ //移動体データの配列
    {"operation": [ //移動経路データ配列
            {"elapsedtime": 99999,
            "position": [999.9999, 999.9999, 999.9999], //positionが定義されると移動処理対象
            "optElevation": [10,20,30,40], //グラフのデータ
            "optColor": [[255,0,0],[0,255,0],[0,0,255],[255,255,255]], //グラフの色分け(規定値は緑)
            ・・・ //その他の情報
            },・・・
        ]
    },・・・・・・
]
MovesLayer のプロパティの optionOpacity でグラフの透明度(規定値 0.25)、 optionCellSize でグラフの立方体の底面のサイズ(規定値 12)を変更できます。
また、MovesLayer のプロパティの optionChange (規定値 false )を true にすることでグラフを積み重ねることもできます。
表示例

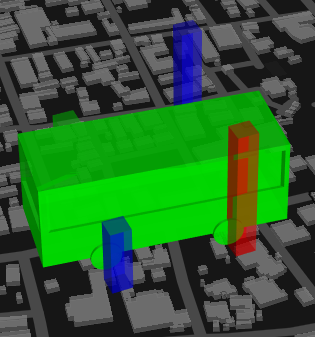
グラフを表示する際には丸形アイコンが適していると思いますが、3Dアイコンの場合は以下の様になります。
アイコンのセンターからの距離はプロパティの optionDisplayPosition (規定値 30)で変更できます。
表示例

3Dアイコンでもセンタリングできますが、オブジェクトを突き抜ける表示になりますのでお勧めしません。
グラフを非表示にするには MovesLayer のプロパティの optionVisible (規定値 true)に false を設定します。