はじめに
Oracle Analytics Cloud(OAC)のワークブックでパラメータが利用可能になりました。
パラメータは一種の変数として扱うことができ、これを使用して、より対話的なビジュアライゼーションを作成できます。
パラメータは、ビジュアライゼーションの他、フィルタや計算でも使用できます。
これ以降のステップで使用するデータセットは、こちらの記事を参考に入手してください。
1. 新規ワークブックの作成
OACにログインし、「作成」から「ワークブック」をクリックします。

「Sample Order Lines」データセットを選択し「ワークブックに追加」します。

Sample Order Linesデータセットがない場合は、こちらの記事の冒頭の手順で入手できます。
2. 新規ビジュアライゼーションの作成
「Product Container」「Customer Segment」「Sales」の3つの項目を使用して、積上げ棒ビジュアライゼーションを作成します。


3. パラメータの作成
パラメータを3つ作成します。
3.1 分析軸のためのパラメータ
「パラメータ」ペインで「+」をクリックして、新規パラメータを作成します。

| パラメータ | 値 |
|---|---|
| 名前 | 分析軸 |
| データ型 | テキスト |
| 複数値の許可 | オフ |
| 別名 | オン |
| 使用可能な値 | 値 |
| Order Priority | 受注優先度 |
| Product Category | 製品カテゴリ |
| Product Container | コンテナタイプ |
| 初期値 | 値 |
| 受注優先度 |
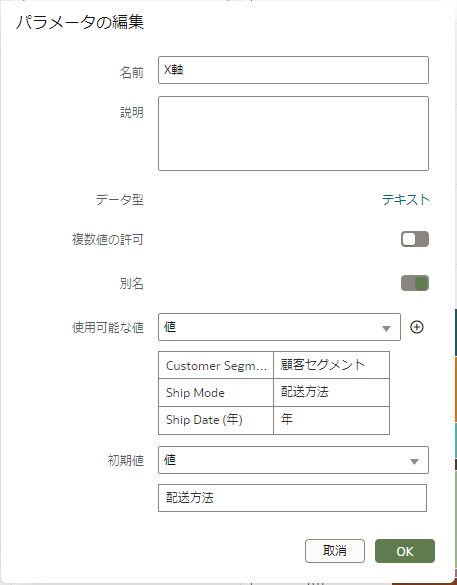
3.2 X軸のためのパラメータ
| パラメータ | 値 |
|---|---|
| 名前 | X軸 |
| データ型 | テキスト |
| 複数値の許可 | オフ |
| 別名 | オン |
| 使用可能な値 | 値 |
| Customer Segment | 顧客セグメント |
| Ship Mode | 配送方法 |
| Ship Date (年) | 年 |
| 初期値 | 値 |
| 配送方法 |
3.3 Y軸のためのパラメータ
| パラメータ | 値 |
|---|---|
| 名前 | X軸 |
| データ型 | テキスト |
| 複数値の許可 | オフ |
| 別名 | オン |
| 使用可能な値 | 値 |
| Profit | 利益 |
| Sales | 売上金額 |
| Discount | 値引き |
| Quantity Ordered | 受注数量 |
| 初期値 | 値 |
| 売上金額 |
4. 計算の追加
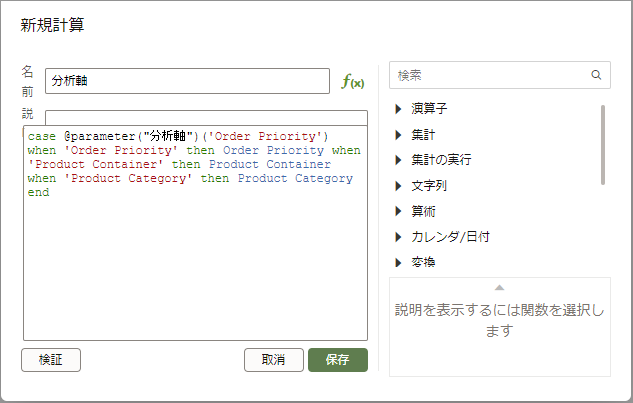
4.1 分析軸の計算を追加
名前を「分析軸」とし、次の式を入力し「保存」をクリックします。
case @parameter(分析軸)('Order Priority') when 'Order Priority' then Order Priority when 'Product Container' then Product Container when 'Product Category' then Product Category end
4.2 X軸の計算を追加
再度「+」をクリックして計算を追加します。
名前を「X軸」とし、次の式を入力し「保存」をクリックします。
case @parameter(X軸)('Customer Segment') when 'Customer Segment' then Customer Segment when 'Ship Mode' then Ship Mode when 'Ship Date (年)' then cast(Year(Ship Date) as char(4)) end
4.3 Y軸の計算を追加
「+」をクリックして計算を追加します。
名前を「Y軸」とし、次の式を入力し「保存」をクリックします。
case @parameter(Y軸)('Sales') when 'Sales' then Sales when 'Profit' then Profit when 'Discount' then Discount when 'Quantity Ordered' then Quantity Ordered end
5. パラメータをビジュアライゼーションで使う
作成した計算を積上げ棒ビジュアライゼーションで使用します。
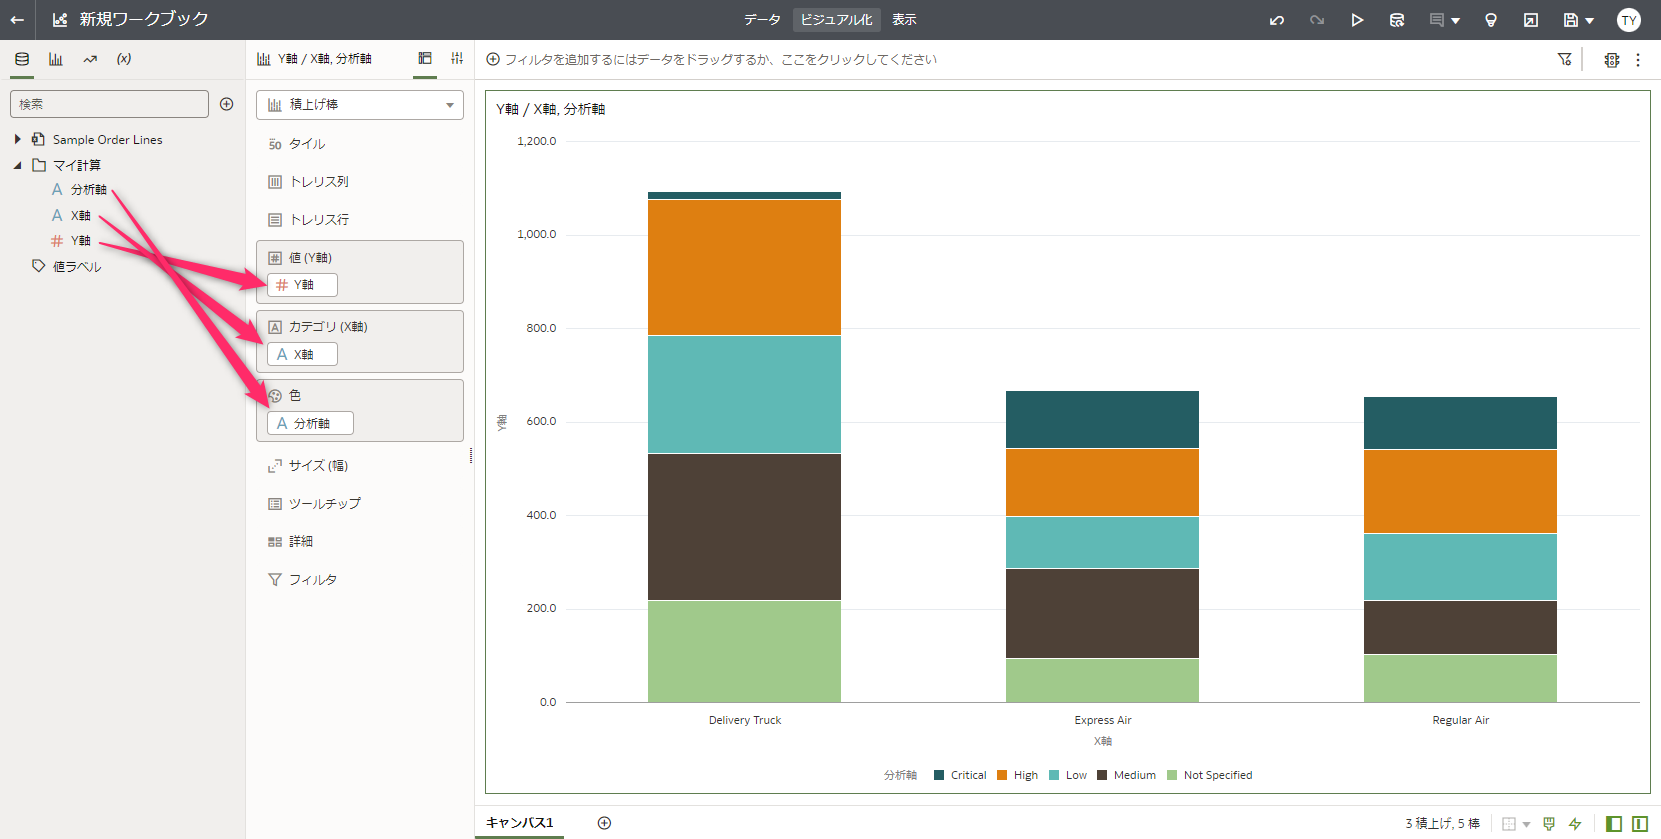
「マイ計算」を展開し、「分析軸」を色に、「X軸」をカテゴリ(X軸)に、「Y軸」を値(Y軸)にドラッグ&ドロップします。

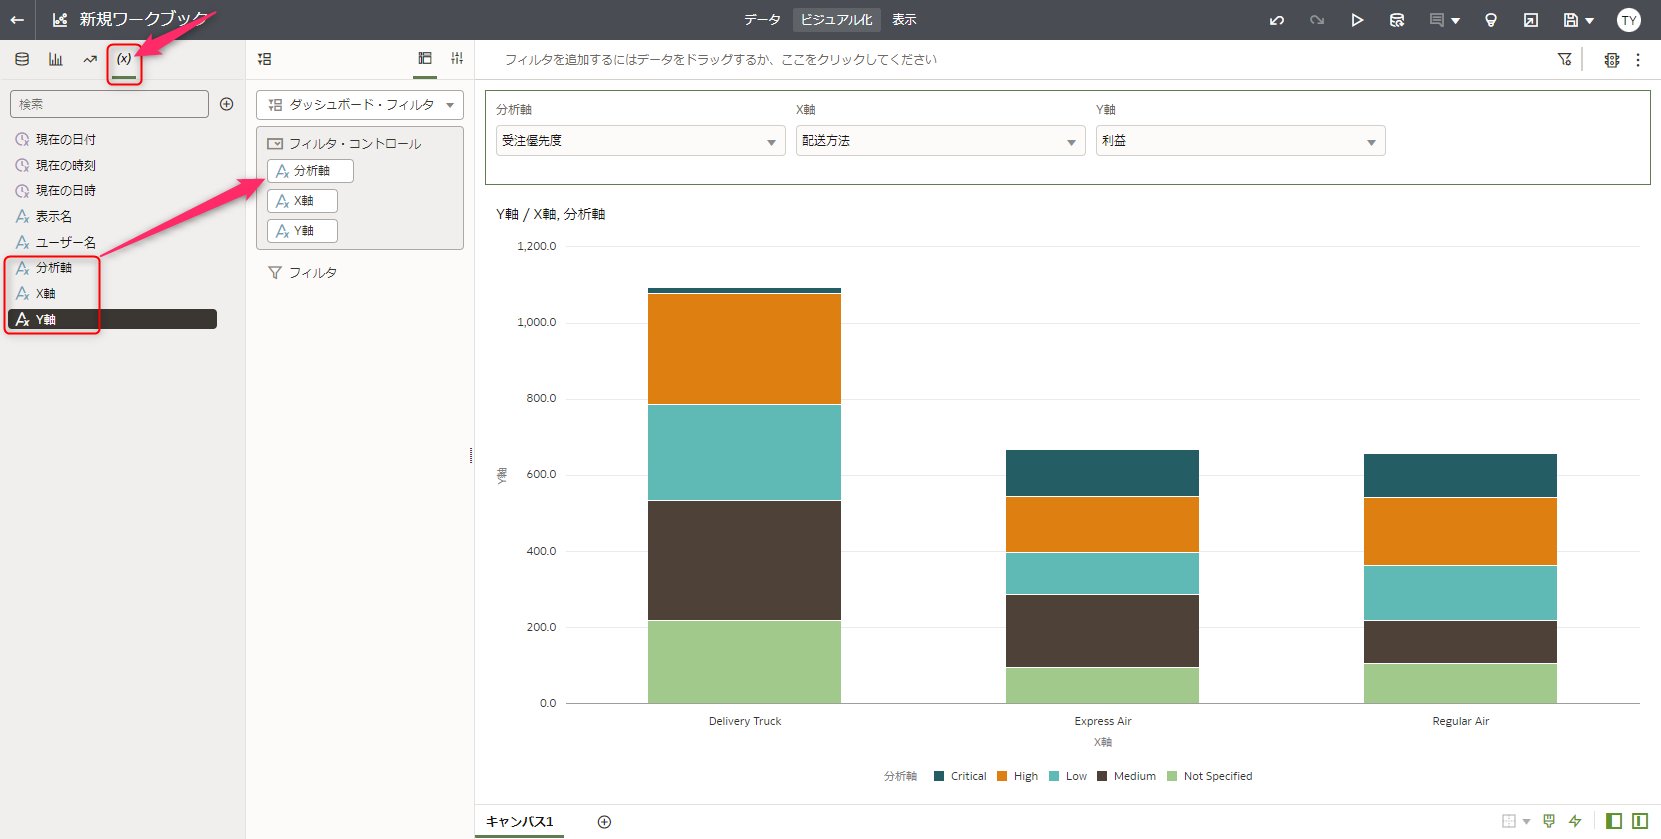
ビジュアライゼーション ペインから「ダッシュボード・フィルタ」をキャンバスにドラッグ&ドロップします。

パラメータ ペインに移動し、ダッシュボード・フィルタの「フィルタ・コントロール」に作成した3つのパラメータをドラッグ&ドロップします。


